Yes. At the bottom of pg 4 of the report I mention “If one wanted an IDT exact to the camera sensitivities only (i.e. no lens), then [lens transmittance] data could theoretically be factored out of the spectral calculations.”
The data was captured in 5 nm increments from 350nm - 800 nm. I’d have to check my script but I think I did all my calculations at that increment. If I did interpolate to say 2 nm increments, I would have used simple linear interpolation as the curves here are broad and not spiky.
If I did want more precise data, it would be most accurate to capture the characterization images directly at 2 nm or even 1 nm increments - but for this type of investigation that seemed like overkill. (It already took long enough for each camera without doubling the number of measurements and images needing to be processed).
That would depend on many factors. I don’t have any empirical evidence to support a claim one way or another. I think it comes down to what’s “good enough?” - which is a question only you can answer for your particular use-case or application. One could theoretically take time to generate a custom IDT for each individual camera (and lens!..and capture SPD!) combination - but in practical use does this make enough of difference to be worth the effort required? Far more likely to make mistakes than to reap any discernable benefit. Even a basic generic IDT using best principles puts us miles beyond the starting point of trying to match cameras from scratch without color management helping us to put them in a similar encoding.
Ah thanks! I remember reading that when the report first came out, and I was trying to find where you said that again (I was wrongly searching only in this thread)
Ok no problems with this then
You’re right, this is miles ahead of nothing, even if individual cameras differ. If I can find two cameras of the same model I will try to compare how similar their spectral response is (using a star analyser 100 filter).
Looks like I did use the same method. I was not aware of that document though. Thanks for linking it.
Interesting to see how extremely different Adobe DNG matrices are from error minimsation matrices. Slightly worrying, too. So much software uses those Adobe matrices. I wonder what reason there is for the difference.
I will upload code I used for generating these diagrams soon once it’s a bit more usable and clean.
Hi Scott, thank you for your interesting work. Question: are the SSF plots based on energy or quanta (or a combination of both)? In other words, when you say that
The Labview software that controls the monochromator also communicates with a power meter.
The radiant flux at each wavelength was automatically measured and recorded into a text file for
later use in normalizing the data.
…and…
To compensate for any variations in power, the averaged RGB values from each wavelength
snapshot were normalized by dividing each wavelength triplet by the radiant flux at that
wavelength. When the resulting RGB values are plotted per wavelength, the spectral sensitivity
curves emerge
it appears that a quantity proportional to photon counts is being divided by an energy-based quantity.
Did you compensate for the wavelength dependence of photon energy by multiplying/dividing either by a factor of lambda? I did not see this specified in the documentation.
Our general assumption is that the camera response function, abstracting non-linearity of the sensor when it reaches saturation levels and, assuming that the data is correctly processed defines a linear relationship between the irradiance, i.e. is the radiant flux received by a surface per unit area, at the image sensor plane and the resulting RGB pixel values. This holds true for all the work we do and we rely on that on a daily basis, i.e. intrinsically linear scene-referred workflow.
With that in mind, if there is knowledge of the radiant flux generated by the monochromator, it should be fine to normalise the RGB pixel values with it?
Hi Thomas, thank you for your reply, yes to the linearity assumption. I was wondering about the units of the SSFs, e.g. in Figure 3, and I think you are telling me that they show relative sensitivity to energy. In other words that’s the response to be expected if the CFAs were illuminated by equi-energy illuminant Se. So the units are something proportional to photoelectrons/joule/small wavelength interval.
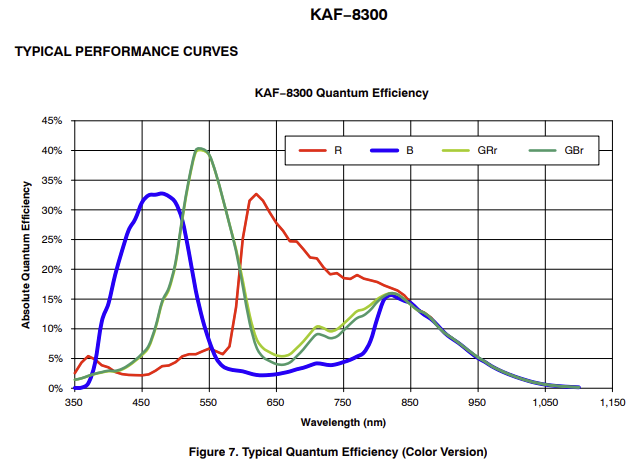
The alternative would have been a relative QE plot, where monochromator output would need to be converted to an equivalent number of photons via the relation you mention before being used to normalize the photoelectron count captured by the cameras. In this case the units would be the relative QE percentage around the given wavelength (ON Semiconductor KAF-8300 Spec Sheet):
Not your case. The only relevant difference between the two is the factor linked to wavelength, since the other constants get normalized away. Ok, got it thanks.