The first experiment I did was try and understand how M relates to J in the rendered image.
I tried several different curve fits and one that seemed to work well was an Asymetrical Gaussian.
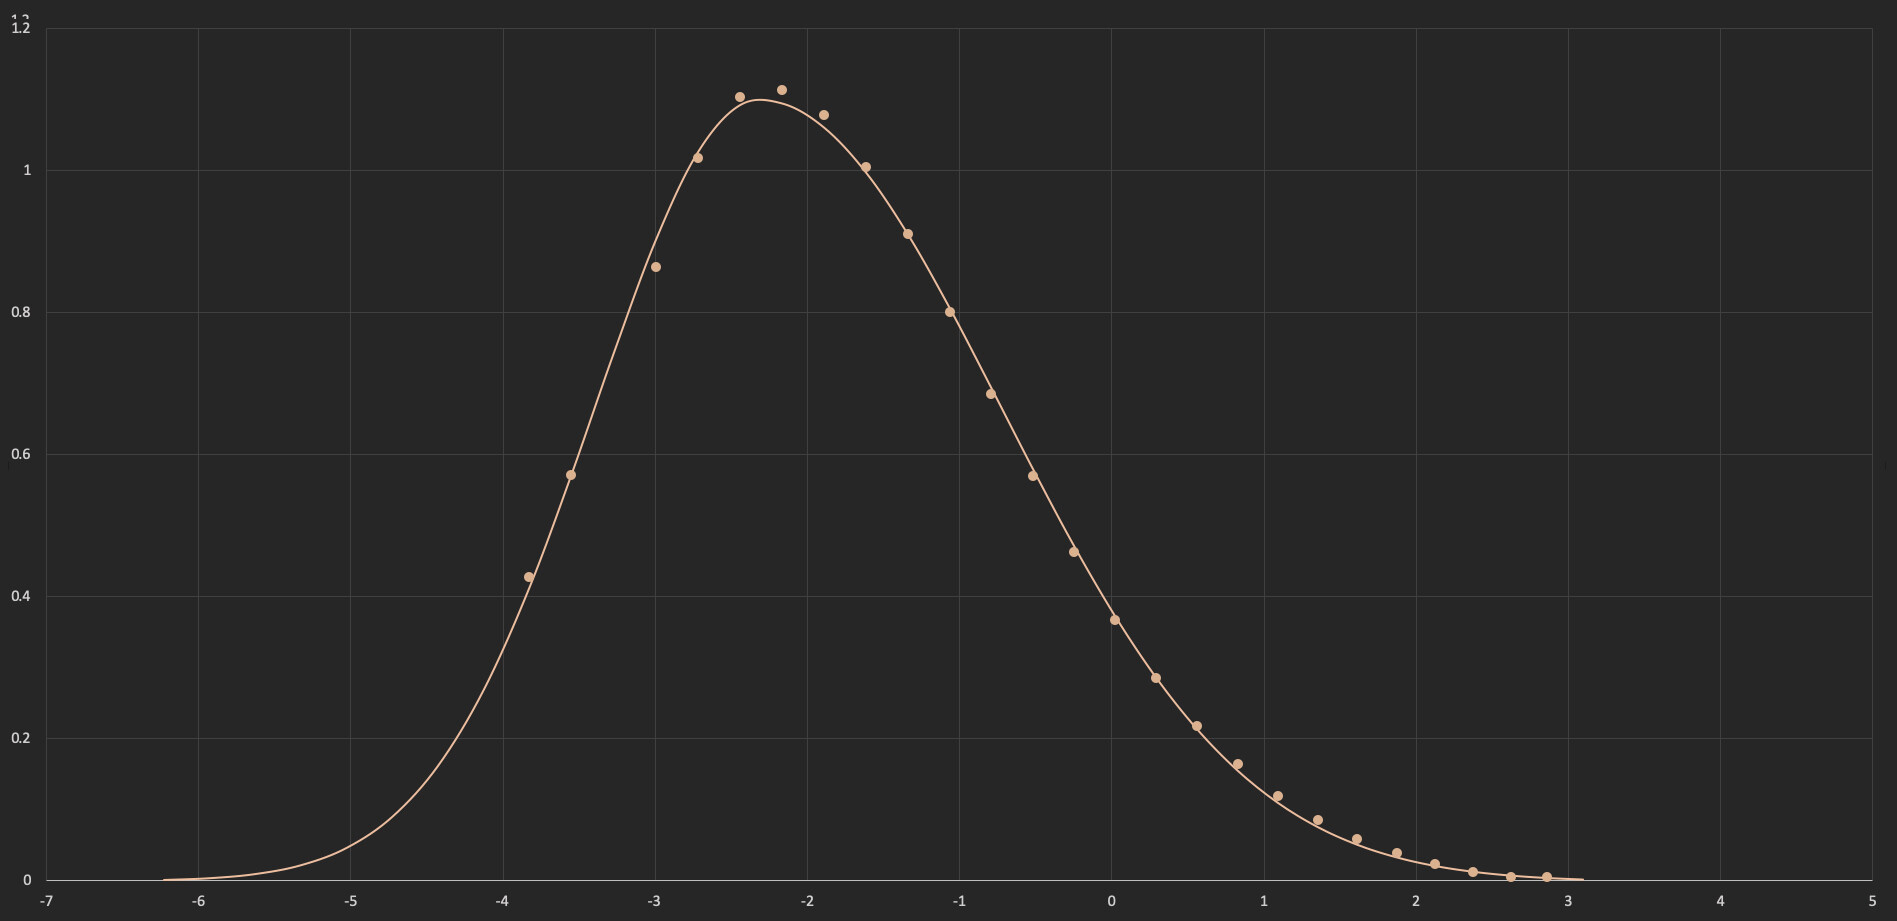
Here is ColorChecker Patch 2
The dots are difference of M (ACES in vs Rendered M) vs Log J (no tone mapping) and the curve is an Asymetrical Gaussian Fit
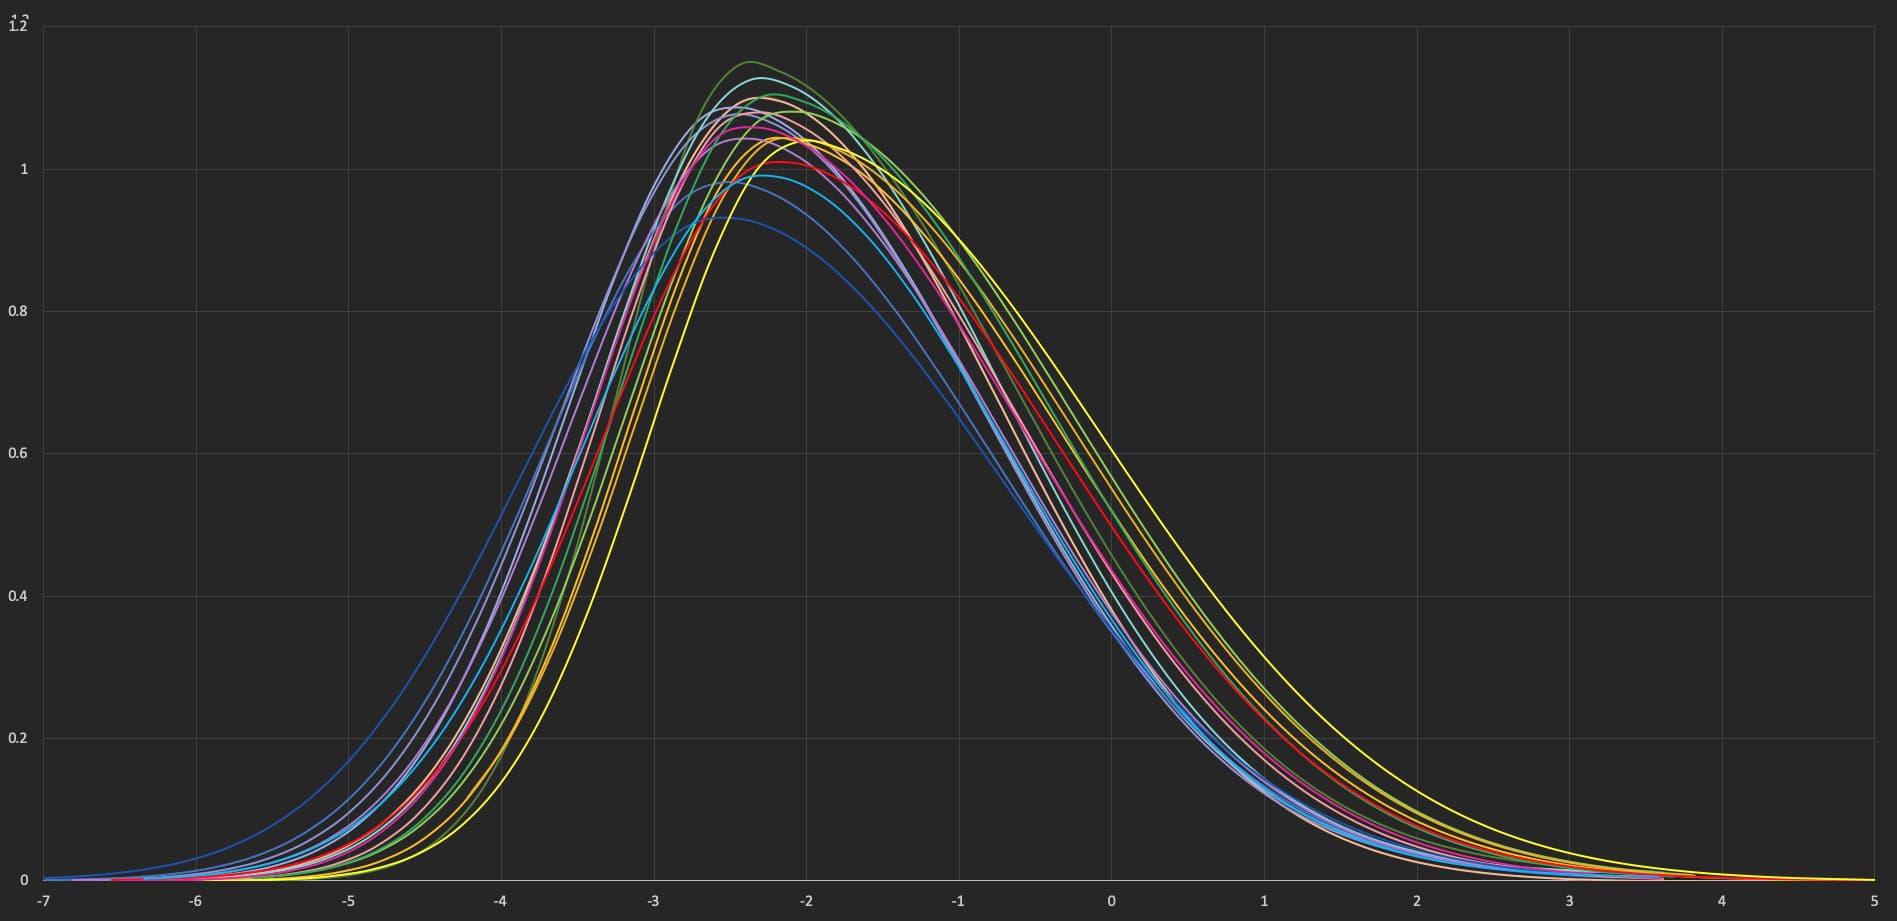
The Colorchecker obviously has a very limited gamut and (as Pekka has pointed out) these curves may not apply to highly saturated colors, but I think it is still useful to see what this range of the gamut is doing because it is an important part of the range where a pleasing/not pleasing/uncanny rendering will be evaluated. Because many (most?) of the midtones are getting a saturation boost and this is a Rec2020 output, many patches land outside of rec709 for even this limited gamut.