Something occurred to me while making the notes for meeting #69, when we talk about the linear extension making the curve not pass through zero. What if instead of just linearly extending on the tangent, we use a curve which has a linear extension through zero, offset and with the exponent modified to approximate the original power law curve? The same way the sRGB curve approximates 2.2 gamma.
Keeping it passing through zero seems an intuitively better thing to so. Otherwise the linear extension is really changing behaviour in some non-negative regions.
Here is a Desmos plot comparing the inverse sRGB curve (built using the CLF / OCIOv2 monCurveRev function) with a simple y=x^{1/2.2}.
I believe the exponent in the Hellwig non-linear compression is 0.42. I don’t know if there is a standard way of choosing constants to make a monCurve which approximates a particular exponent. But if you put 0.42 into the Desmos plot as the value of p, you can play with values for k and g (for example, k=0.035, g=2.5) to look for a good match.
If we want to split the function and replace both parts, then we would need to decide on our approach to determining the constraints, for example:
If we want to limit the slope of the linear segment, we would pick a number, which given the (0.0, 0.0) intersection would fully define that portion.
Next we need to determine the break point.
Finally we need to fit a new function to the upper part, depending on the form of the function we could try add appropriate constraints; e.g. c2 continuity, weighting of particular range to fit etc.
In principal you can fit all of these in one go, but you need a non-linear fit and to make sure of the slope constraint, else it would be really easy to find you have a zero length linear segment and a power function that is exactly the original
One thing to be clear about is what the full range of the fit needs to be, else we could end up with a really good fit for some values but a terrible one for ones outside the fitting samples.
Indeed. The piecewise sRGB style monCurve function is clearly not c2 continuous. The derivative of the sRGB curve approaches 12.92 quite steeply as it approaches the break point, and then changes instantaneously to being 12.92 everywhere below that. So at the break point the derivative plot turns through 90 degrees.
@bottosson also showed a simple technique with Oklab in this Colab. This should work with other models too, and I suppose Hellwig with linear extension does something similar (?).
I forgot about this one! Great archeology skills The intent is similar but the technique is different as it perform and operation on the entire space before applying the non-linearity and then inverse that operation post-linearity. The technique in use for Hellwig’s is currently a linear extension of the non-linearity for values under a threshold.
Yeah, I think I’ve got a bead on what’s causing that now.
Moving the gamut compression focus point position to a much larger value seems to calm the crazy noise down. The current default value is yanking the J of low end noisy values up very differently to ZCAM.
Apologies in advance if this is a bit much maths for a forum post!
I have been looking further into the possibility of using a piecewise ‘sRGB-style’ curve in place of the mirrored power function in the non-linear compression in the Hellwig CAM. I realised that there is a potential issue due to the fact that there is more to the compression than just the power curve. There is a second step of the form:
y=0.1+\frac{400x}{27.13+x}
(Note, this also means the compression curve actually passes though (0, 0.1) not (0, 0).
The x in that equation is the output of the power curve. Clearly this will have an asymptote where the denominator is zero. Because the mirrored power curve rolls off where the piecewise curve is linear, the piecewise curve reaches the asymptote much sooner. This may be problematic, if it means it can’t handle the negative range which may occur in real-world image data from out-of-gamut bright sources.
This plot shows the standard Hellwig compression curve and my alternative. Zoom out, and you can see the asymptotes in both curves. The input will (I believe) be normalised to the 0-100 range, so I think the matching of the curves should be judged at that scale.
(Note: the value of f used is arbitrary for testing purposes, and doesn’t impact principle of the demonstration. The values of k, g, x_{break} and s are values I have chosen to roughly match the curve of the 0.42 exponent in Hellwig.)
You can avoid the asymptote by changing the formula to:
y=0.1+\frac{400x}{27.13+abs(x)}
I think the 0.1 is actually subtracted again later in the conversion process, so the final result goes through 0. (after the conversion from rgb to Aab, 0.305 is subtracted - which is what rgb 0.1 turns into).
There is also a power curve to convert A to J. That one will probably need a linear segment as well.
It’s harder to do the same sRGB-style linear extension on the A to J power function. The non-linear compression has a fixed exponent of 0.42, so I could find constants for the monCurve function to approximate that. The exponent in the A to J conversion is driven by other variables. But it is not unreasonable that A might end up negative. Currently the spow function used simply clips negatives. Hopefully that is not too problematic in the context of a DRT. You can’t map a negative brightness value to a display. But being able to preserve it mathematically for inversion could be beneficial.
My version with the monCurve option is in my fork of @alexfry’s repo if anybody would like to take a look. It does not appear to make any difference in the majority of cases.
Been finding and squashing a few bugs around the place.
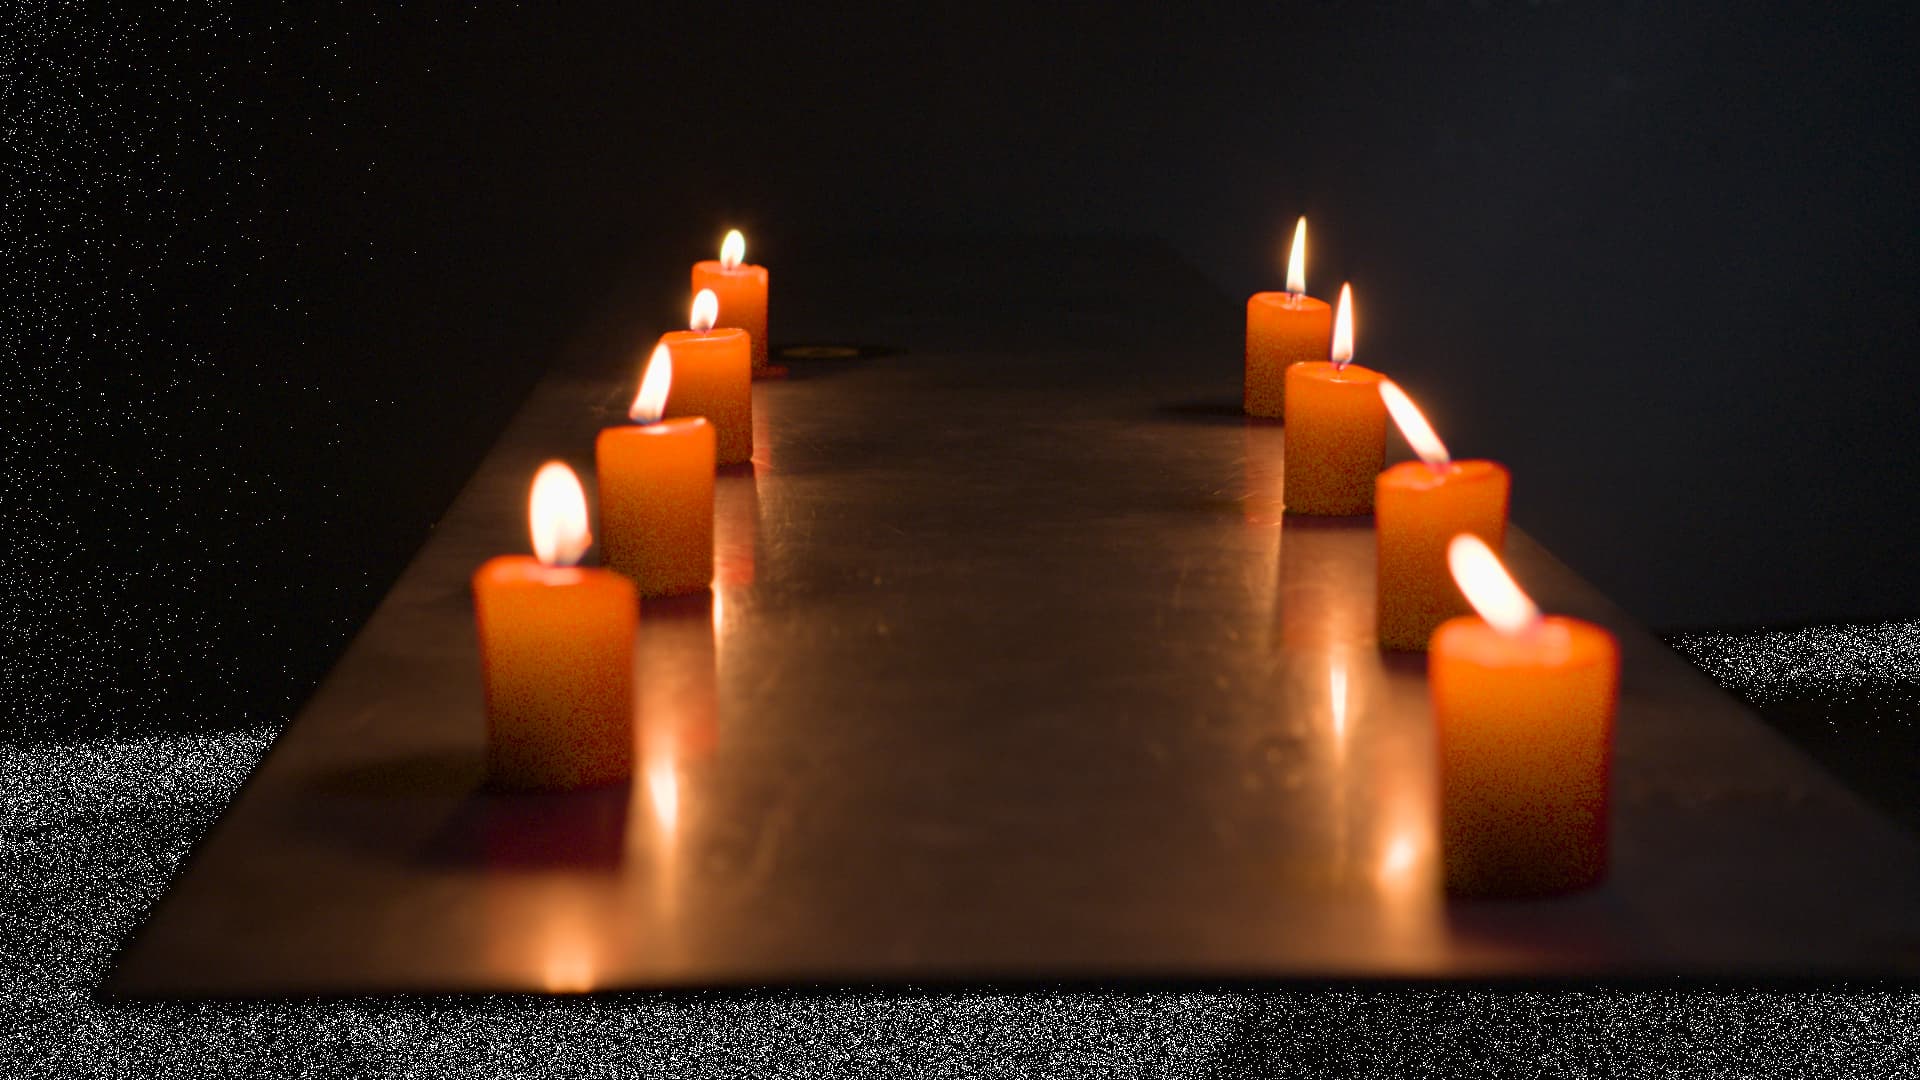
The “CompressMode” seems to really calm down the crazy red/orange split we were seeing with redXmas and the candle frame. (And without having to goose the focus distance value)
FYI: The version I have here (v18) works, but can crash Nuke, and sometimes the whole machine, so proceed with caution. I don’t really know why, but certain input images can cause some sort of dramatic GPU freakout, causing a full hard reboot. All very uncool…
Questions:
Upon seeing the breaking in Desmos piecewise_sRGB with rather small changes in “s” or “xbrk” I was wondering if there might be some rounding errors, especially when then going to a GPU (which typically uses single precision.) Things might slow down if using double precision, but even this may still have the rounding errors. Could these rounding errors then destabilize boundary conditions enough causing the GPU issues? (or maybe trying to access nan memory?)
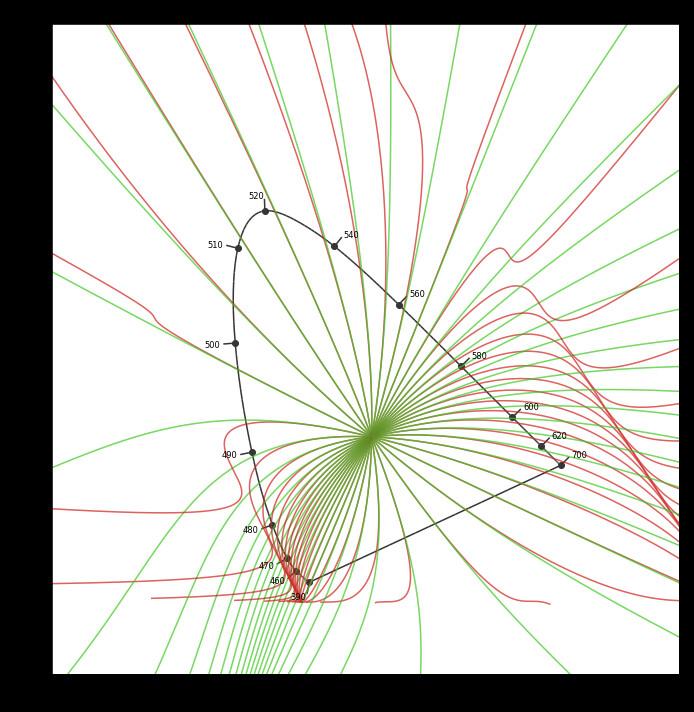
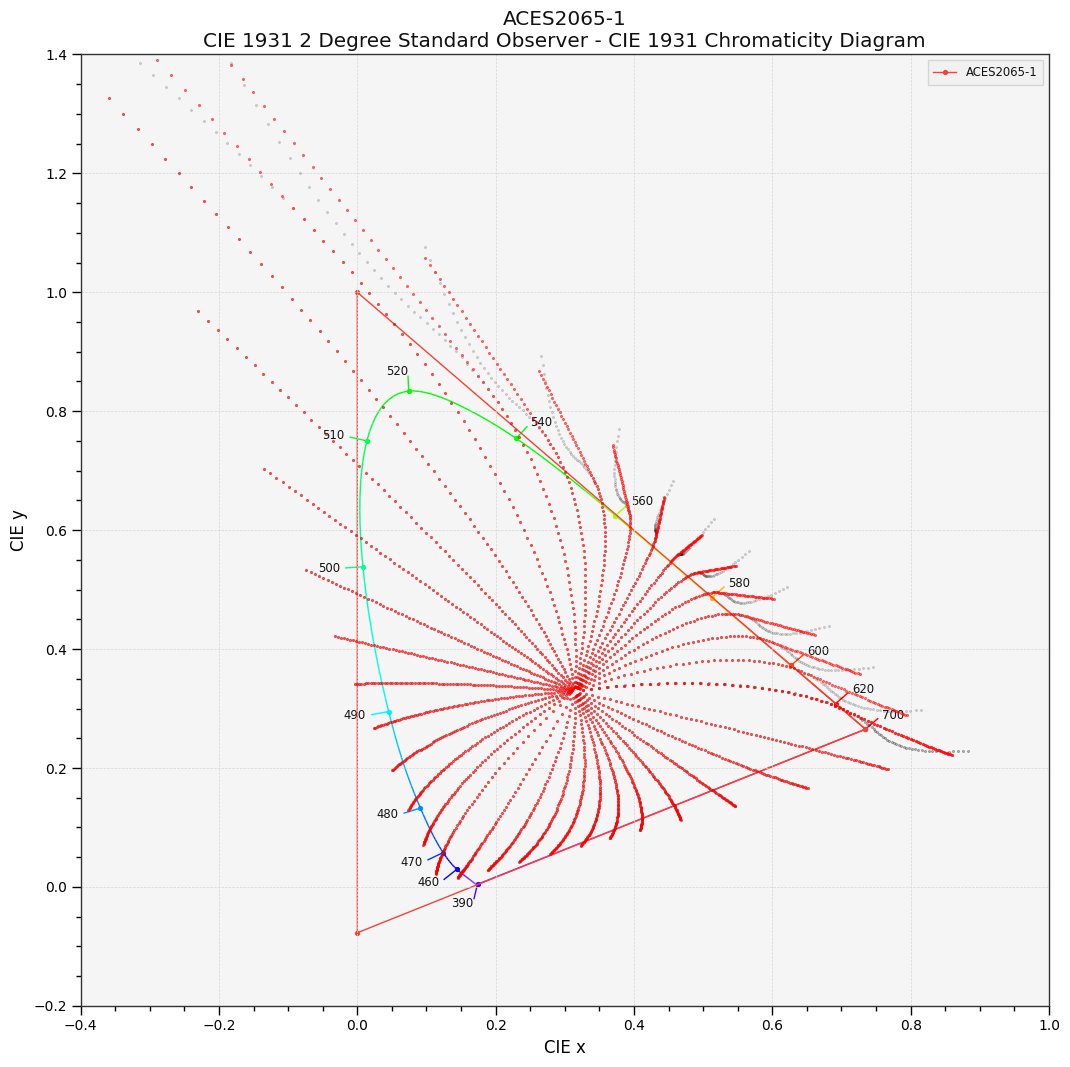
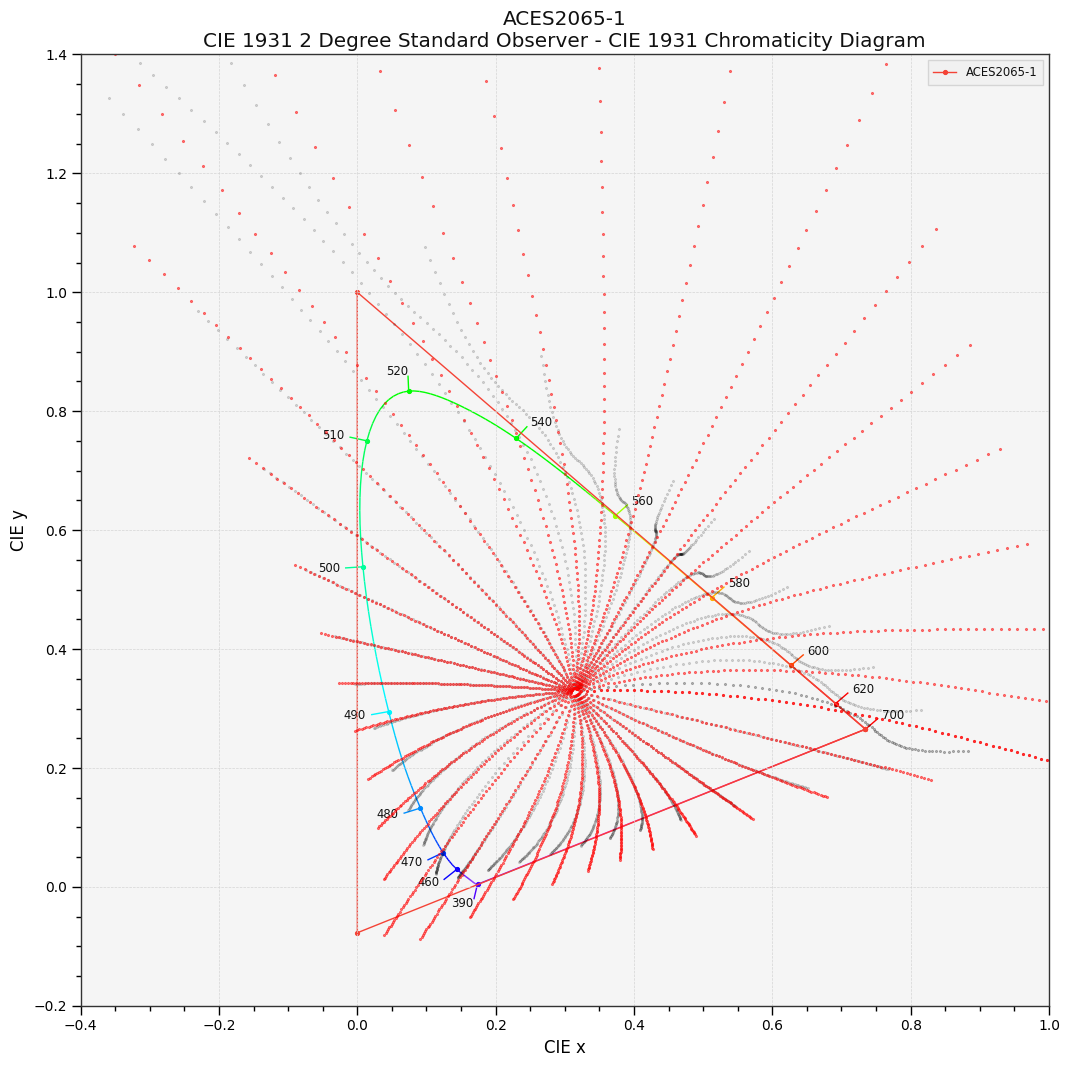
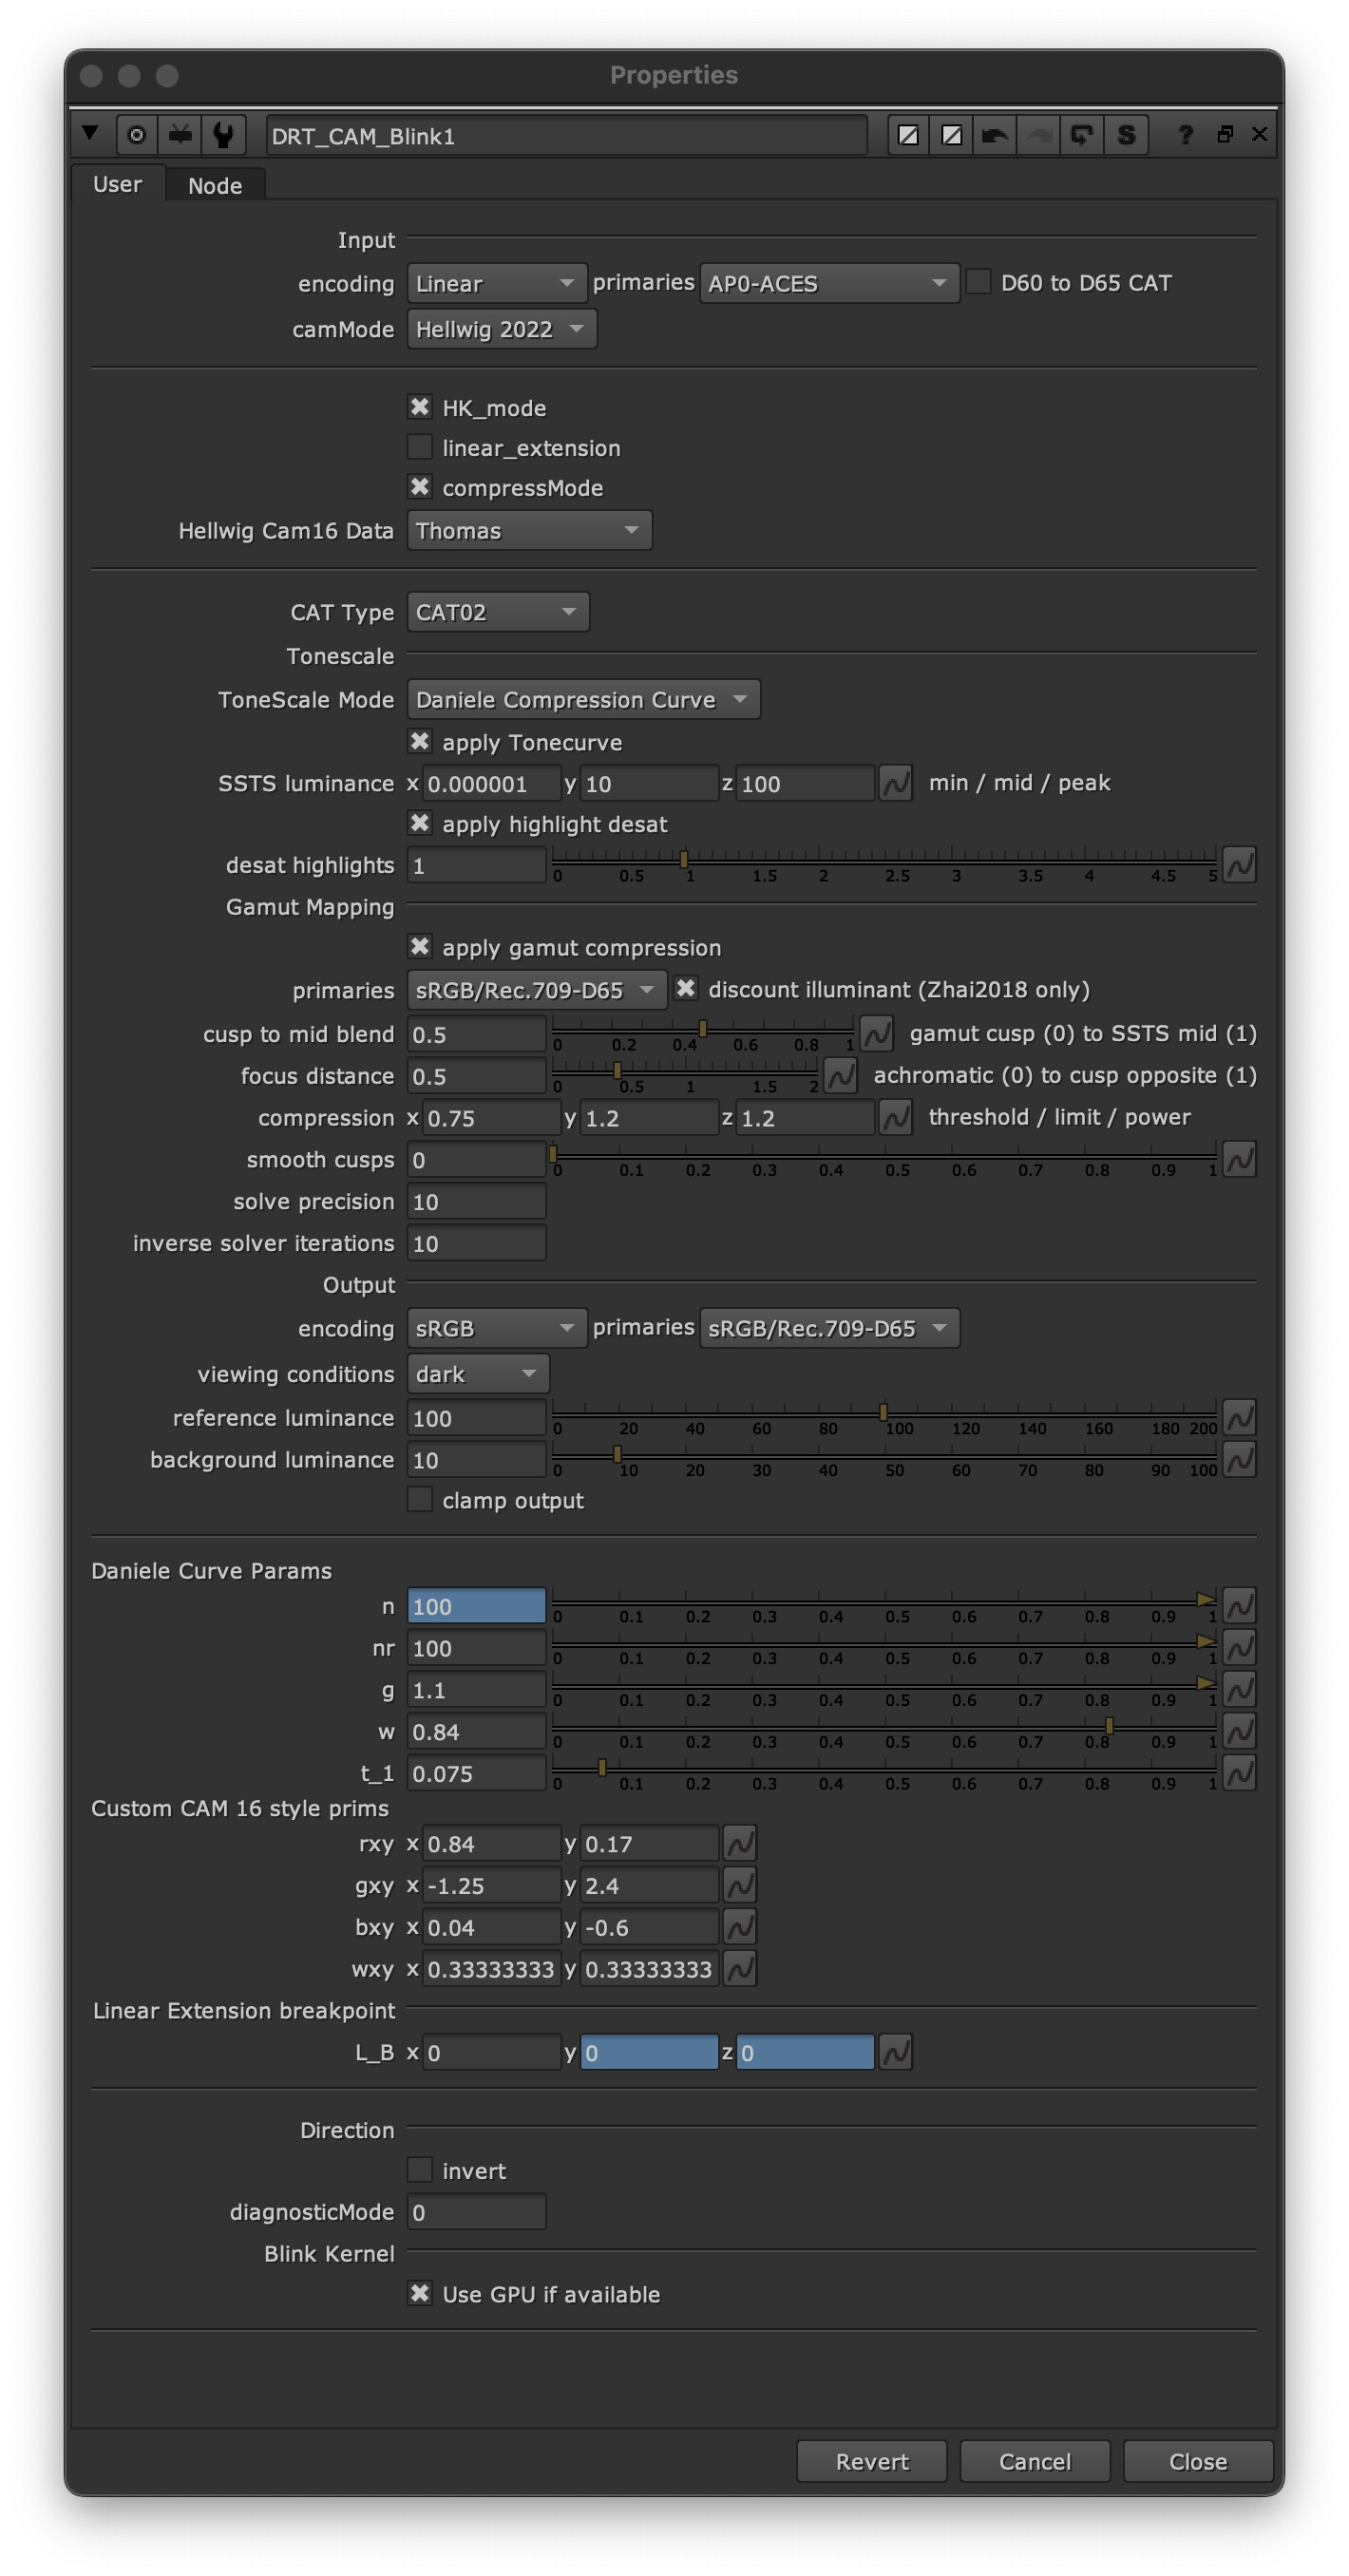
You likely may have considered this already, but I have this “sensitivity/precision” thing in my thoughts and also in relation to the accuracy of RGB values of the image. I also have this in mind when looking at the much more closeness of the blue lines of the JMh plot. Does this closeness indicate less accuracy of calculating a color in this region?
Another thought is how much accuracy is needed in the calculations to provide for the accurate output values (whether 12-bit or 14-bit?) (I ask this because the math has seemed very sensitive to some parameters.)
Precision related effects are certainly worth taking into consideration. However I do not believe they are the cause of the GPU crashes. @alexfry is seeing the same crashes with his version, which does not yet include my piecewise sRGB-style curve.