You may join via computer/smartphone (preferred) which will allow you to see any presentations or documents that are shared, or you can join using a telephone which will be an audio only experience.
Please note that meetings are recorded and transcribed and open to the public. By participating you are agreeing to the ACESCentral Virtual Working Group Participation Guidelines.
Audio + Video
Topic: ACES Virtual Working Group Meetings
Time: This is a recurring meeting Meet anytime
Might be worth mentioning that post the meeting I was also able to recreate the behaviour we showed at the end of the meeting with near violet using both CIECAM 16 as well as a pure implementation of Luke’s model, suggesting that the root of the problem is unlikely due to any of our modifications. But likely lives in the common portions (unfortunately this is most of the models)
I think what you are seeing are the differences in the J and Y weightings. You cannot tonemap Y and expect to get the same result in J or any other signal once you plug in the original other two components.
Also a question about the image you are using:
How many watts of energy do you need to put into a room to get a measurable or perceivable visual stimulus if the wavelength is close to ultra violett laser. It would be quite dangerous for the eye to look at such a scene. I guess this is also why the system gets unstable in this area.
Don’t get me wrong, it is a very nice test to stress a system, but is the input data “visually plausible”.
I don’t think the primaries have anything to do with that.
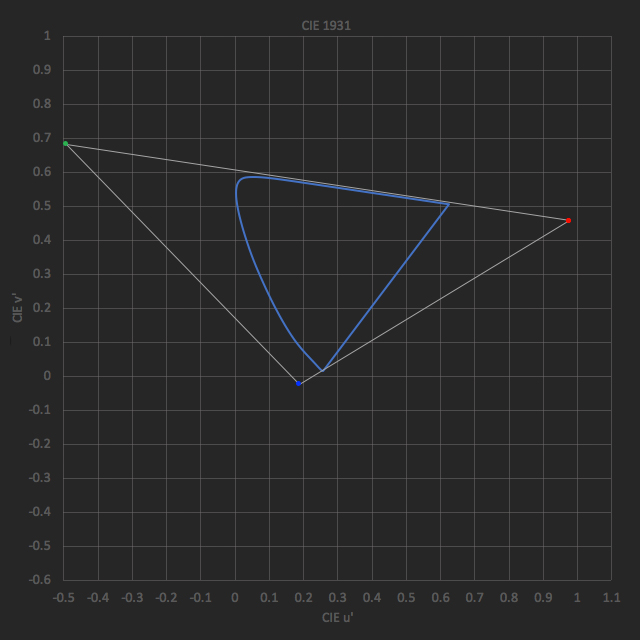
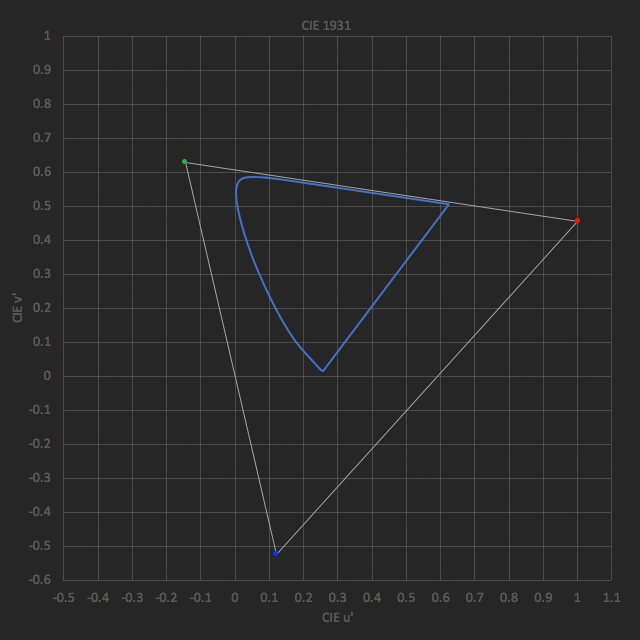
But wow I thought you guys just nudged the proxy LMS space a tiny bit. But from the plots it looks that we are talking about two very different gamut definitions.
the Blue/S numbers in Pekka’s current matrix are just a nudge from CAM16 but they get exaggerated in the Yu’v’ diagram.
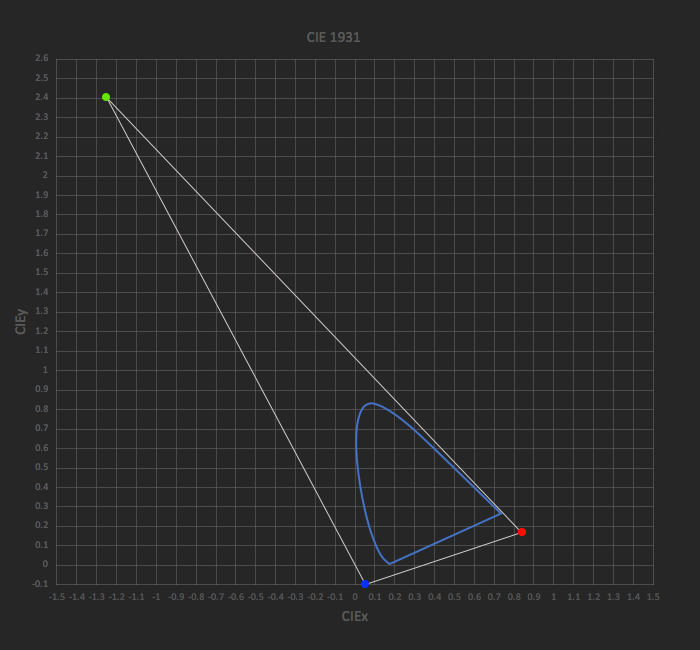
Here is how they look in Yxy, which does work as a closed triangle, this appears to be close, but not exactly the same as Thomas’ diagram, since Pekka has made further tweaks.
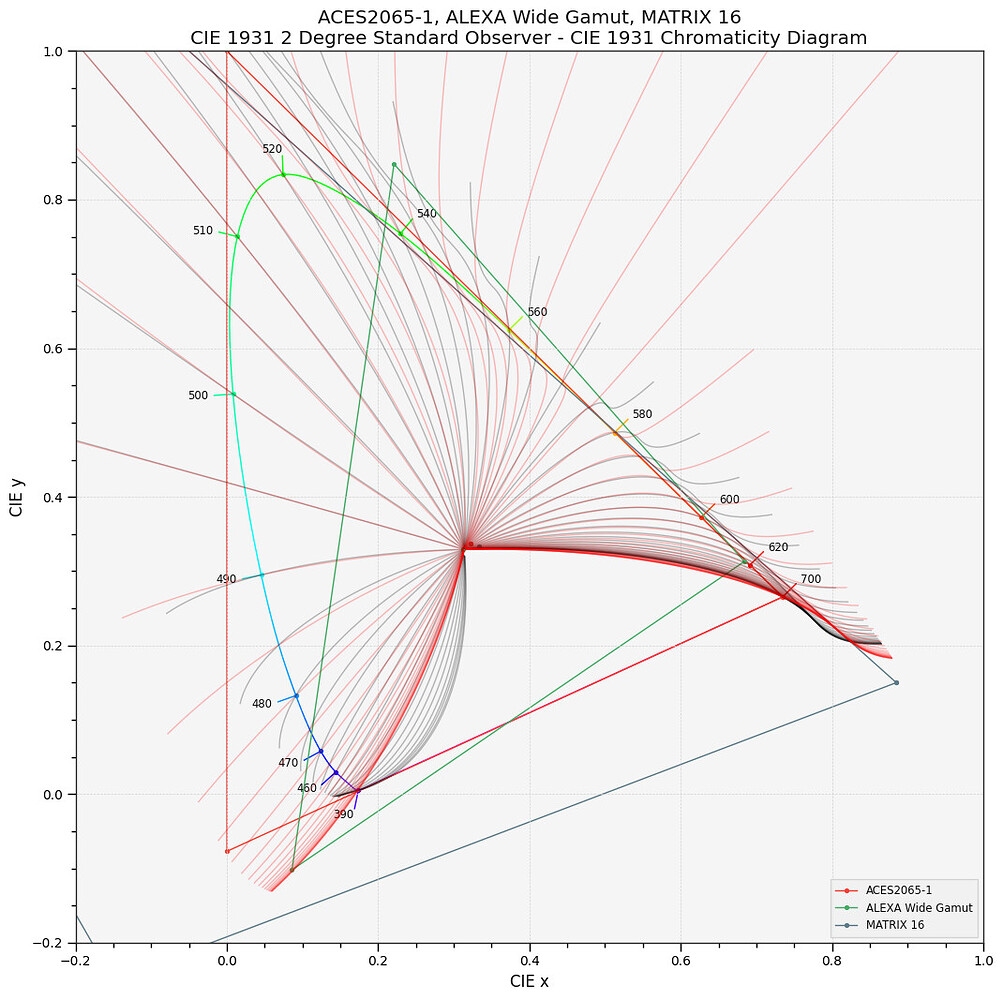
I also don’t think the LMS is the is the source of the problem, or at least not the sole source, but I did find it curious how the CAM16 triangle almost touches edge of boundary at 380nm.
I also want to point out that my diagram does not fully agree with diagrams in CAM16 paper for some reason…
And my adjustments were to try and bring the green and yellow hue lines back closer to what the original primaries gave (with the LMS compress mode enabled).
Watched the recording of the meeting again. Also glad many with much more experience than I are on this.
It still seems to me that the ‘tilt’ along the magenta-green direction, between the calculated 100 nit edge of the ‘bowl’ (contained cusp call it) and the plane of 100 nit is directly related to the wildly curving up in the magenta area. Might some power, exponential or hyperbolic be doing this? But then, what do I know as I am still impressed by an arc-sine of a sine being able to produce a sharp triangle wave. However this is not magic nor does it seem natural behavior so there must be something in the math making this happen.
It does seem to happen early on in the code and compression was said to be off. Maybe comment out one line at a time to find where it comes from. I understand there are hundreds of lines of code, but many won’t be capable of contributing to this issue. Some math has to be making this non-linear offset.