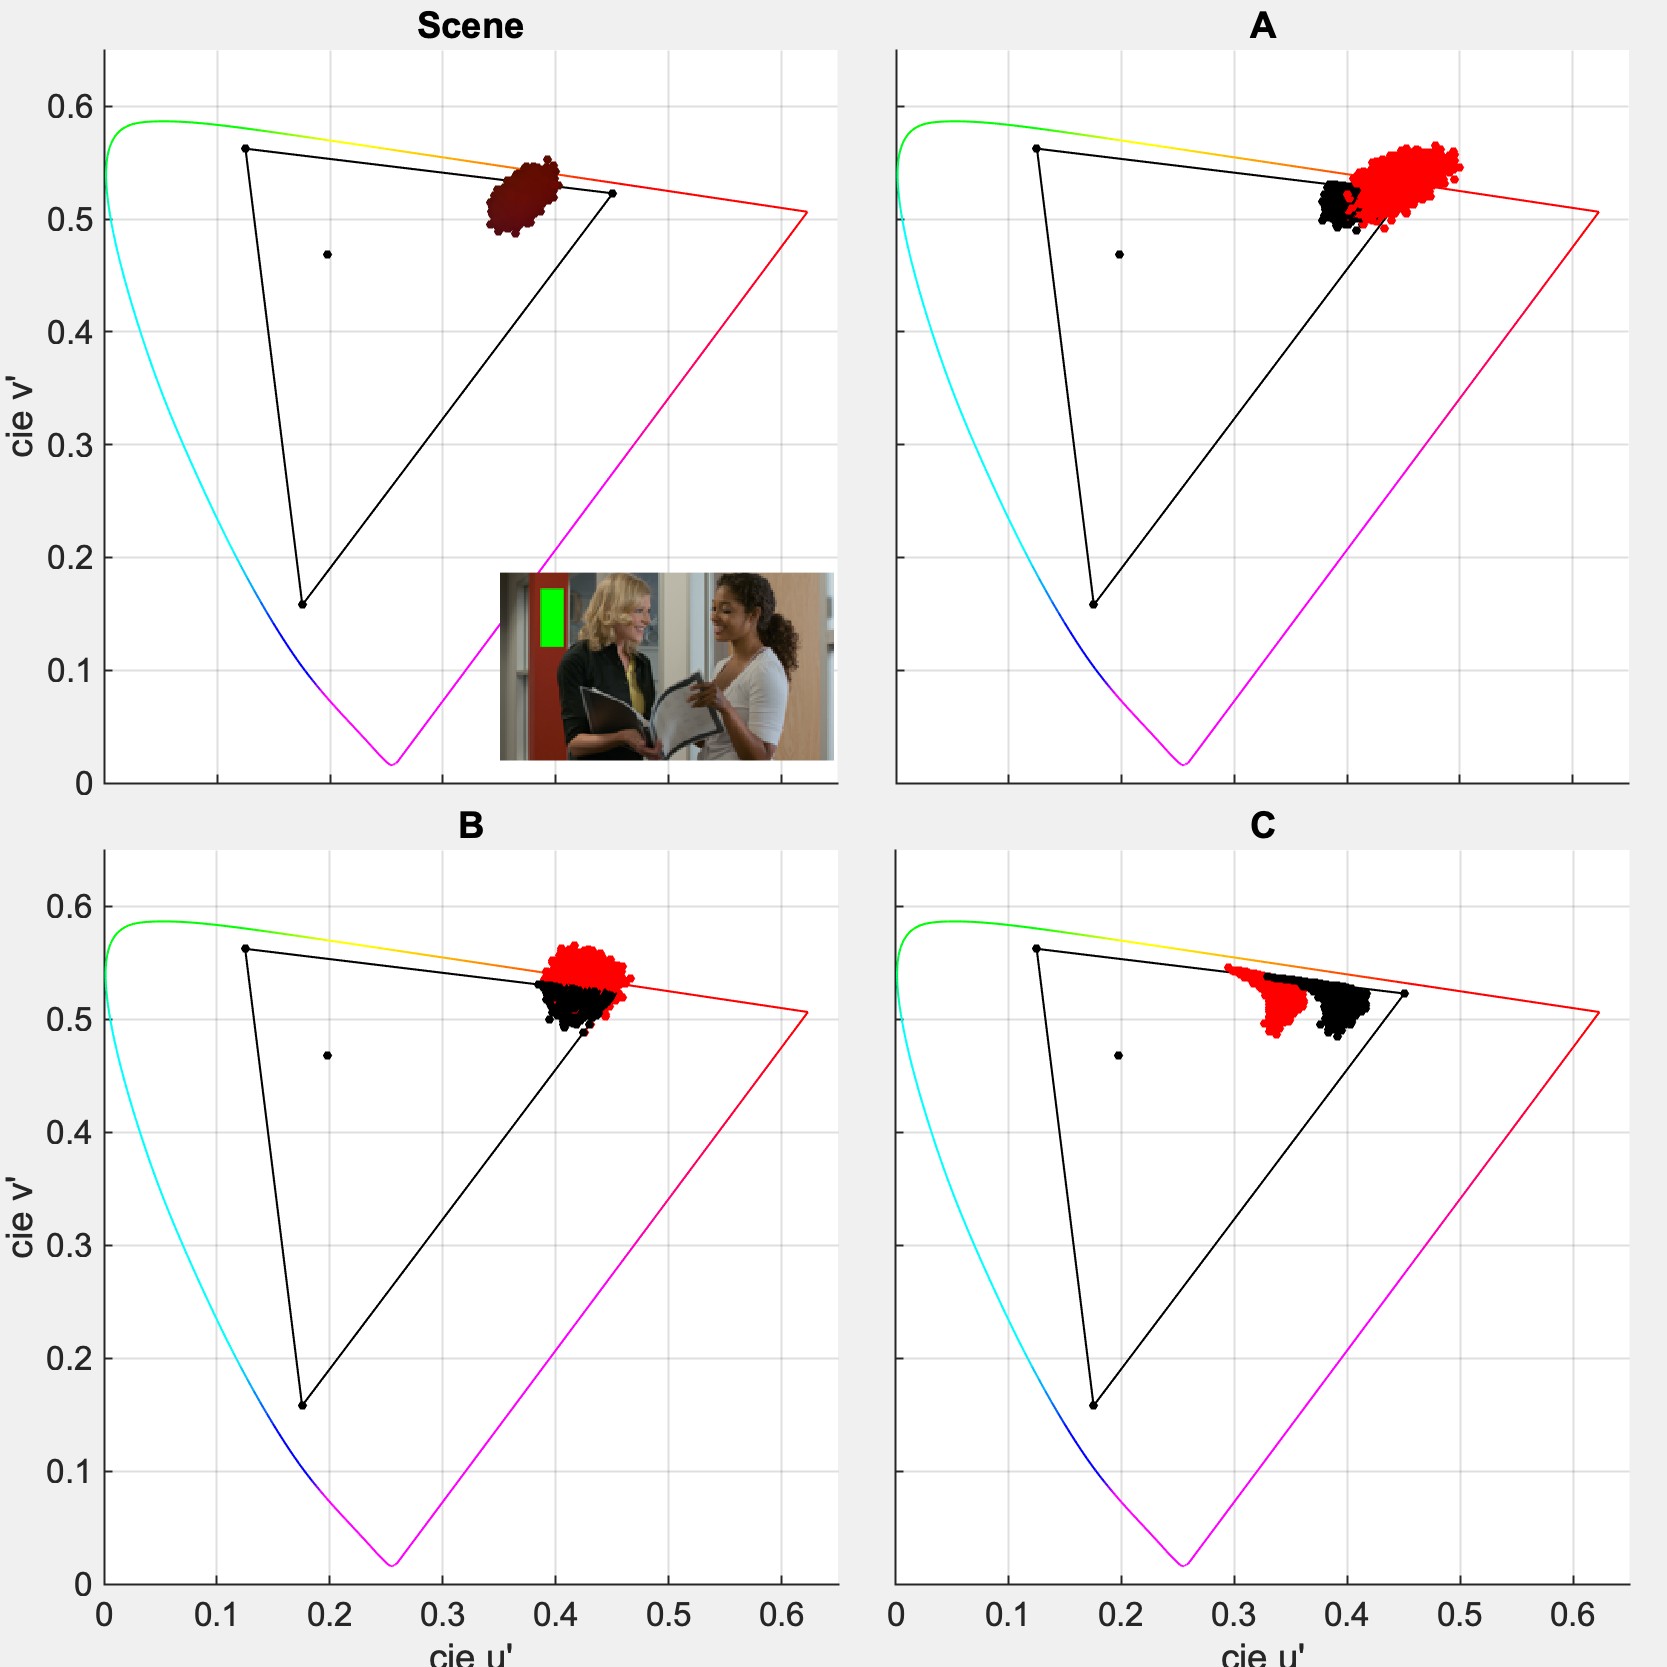
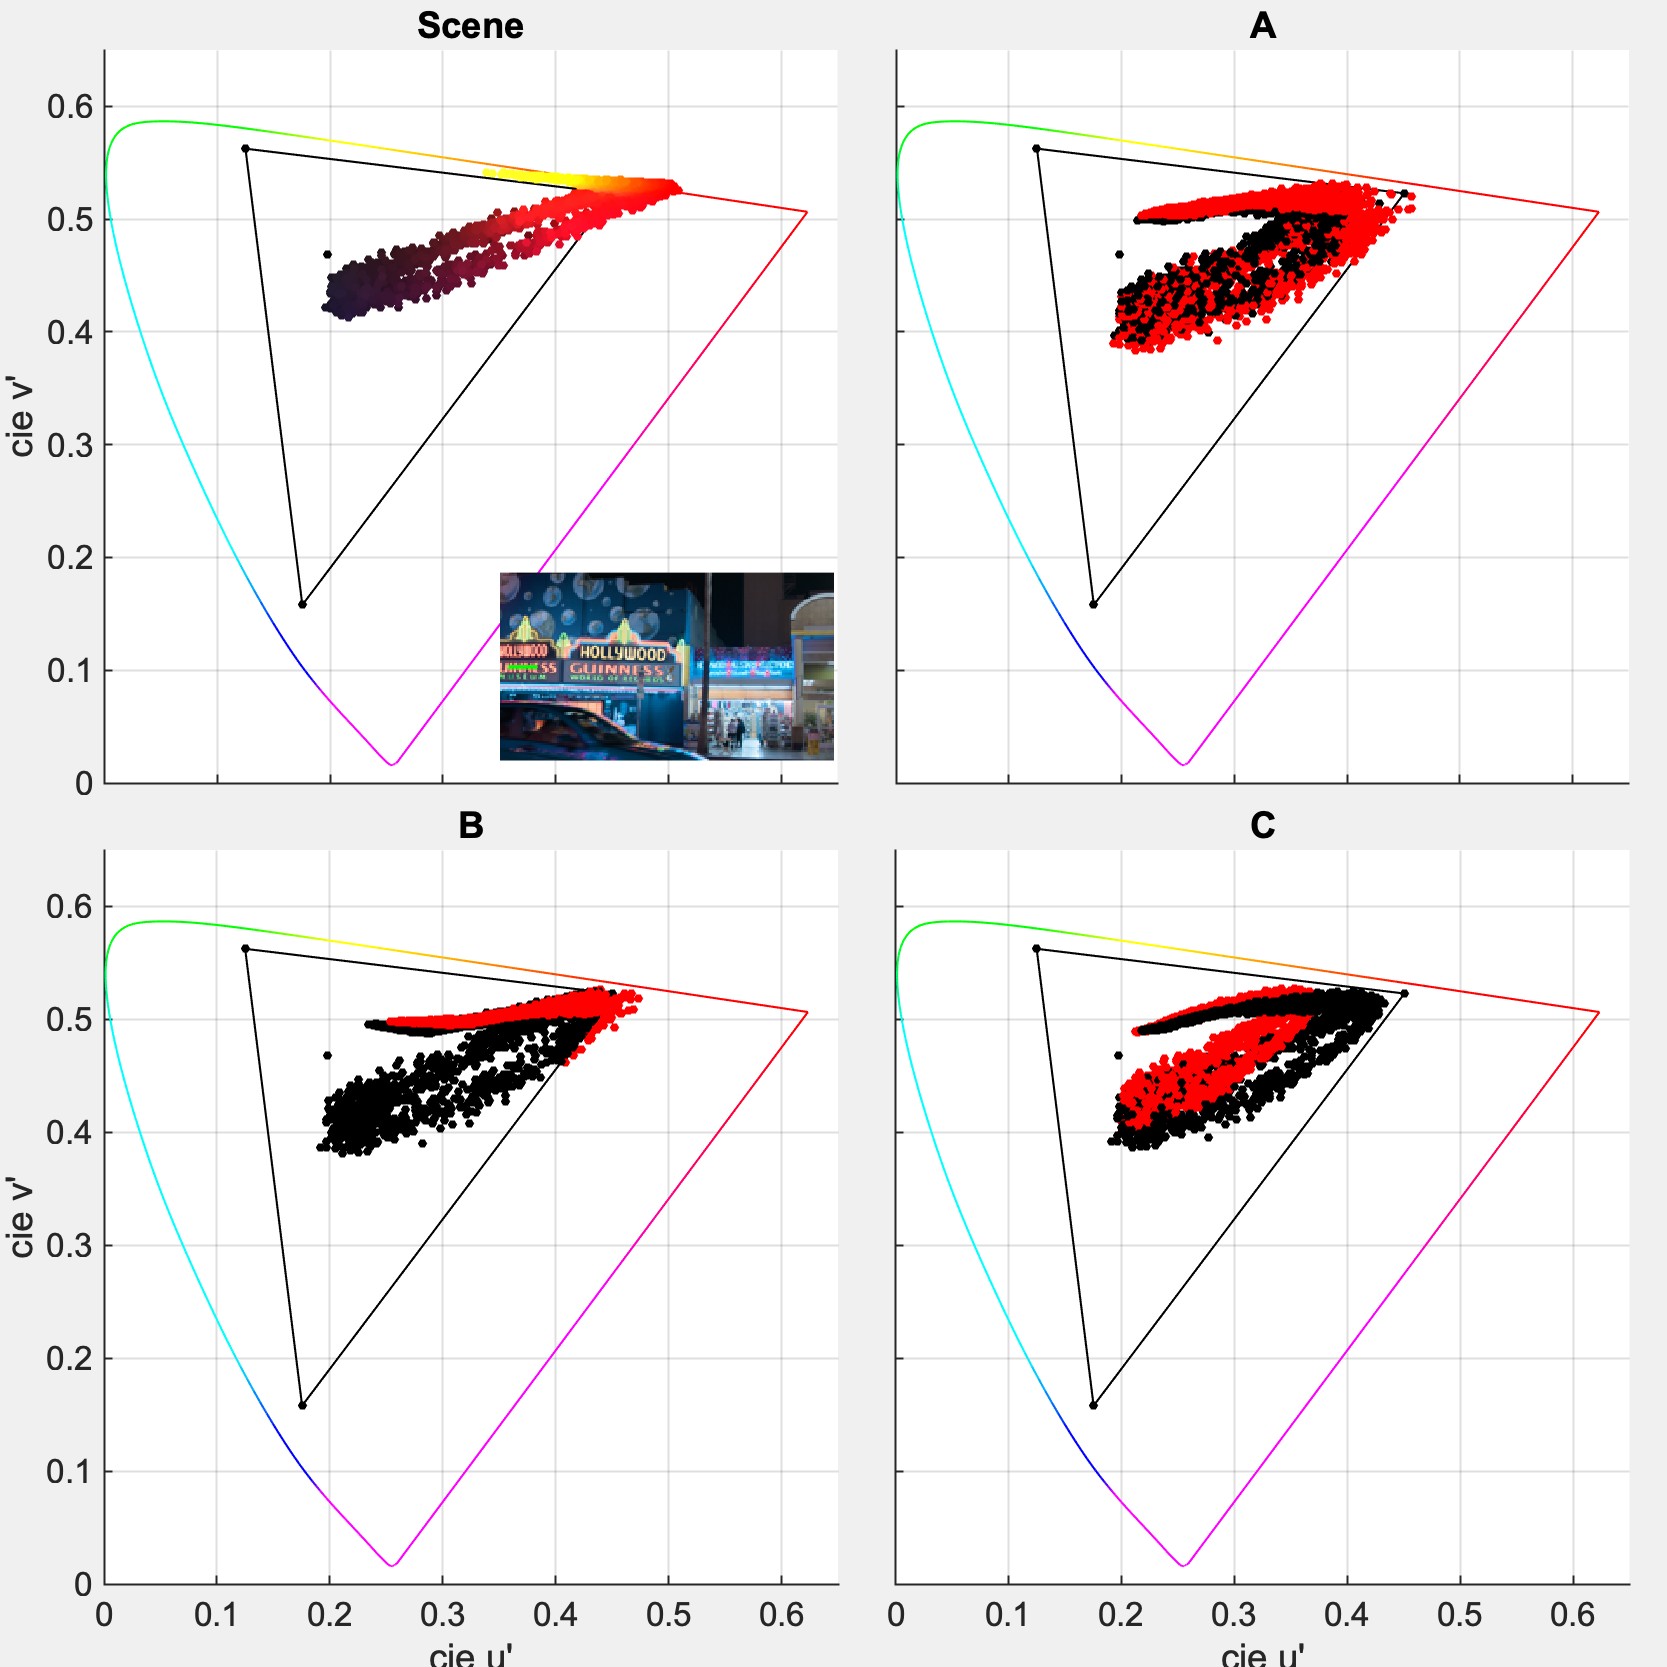
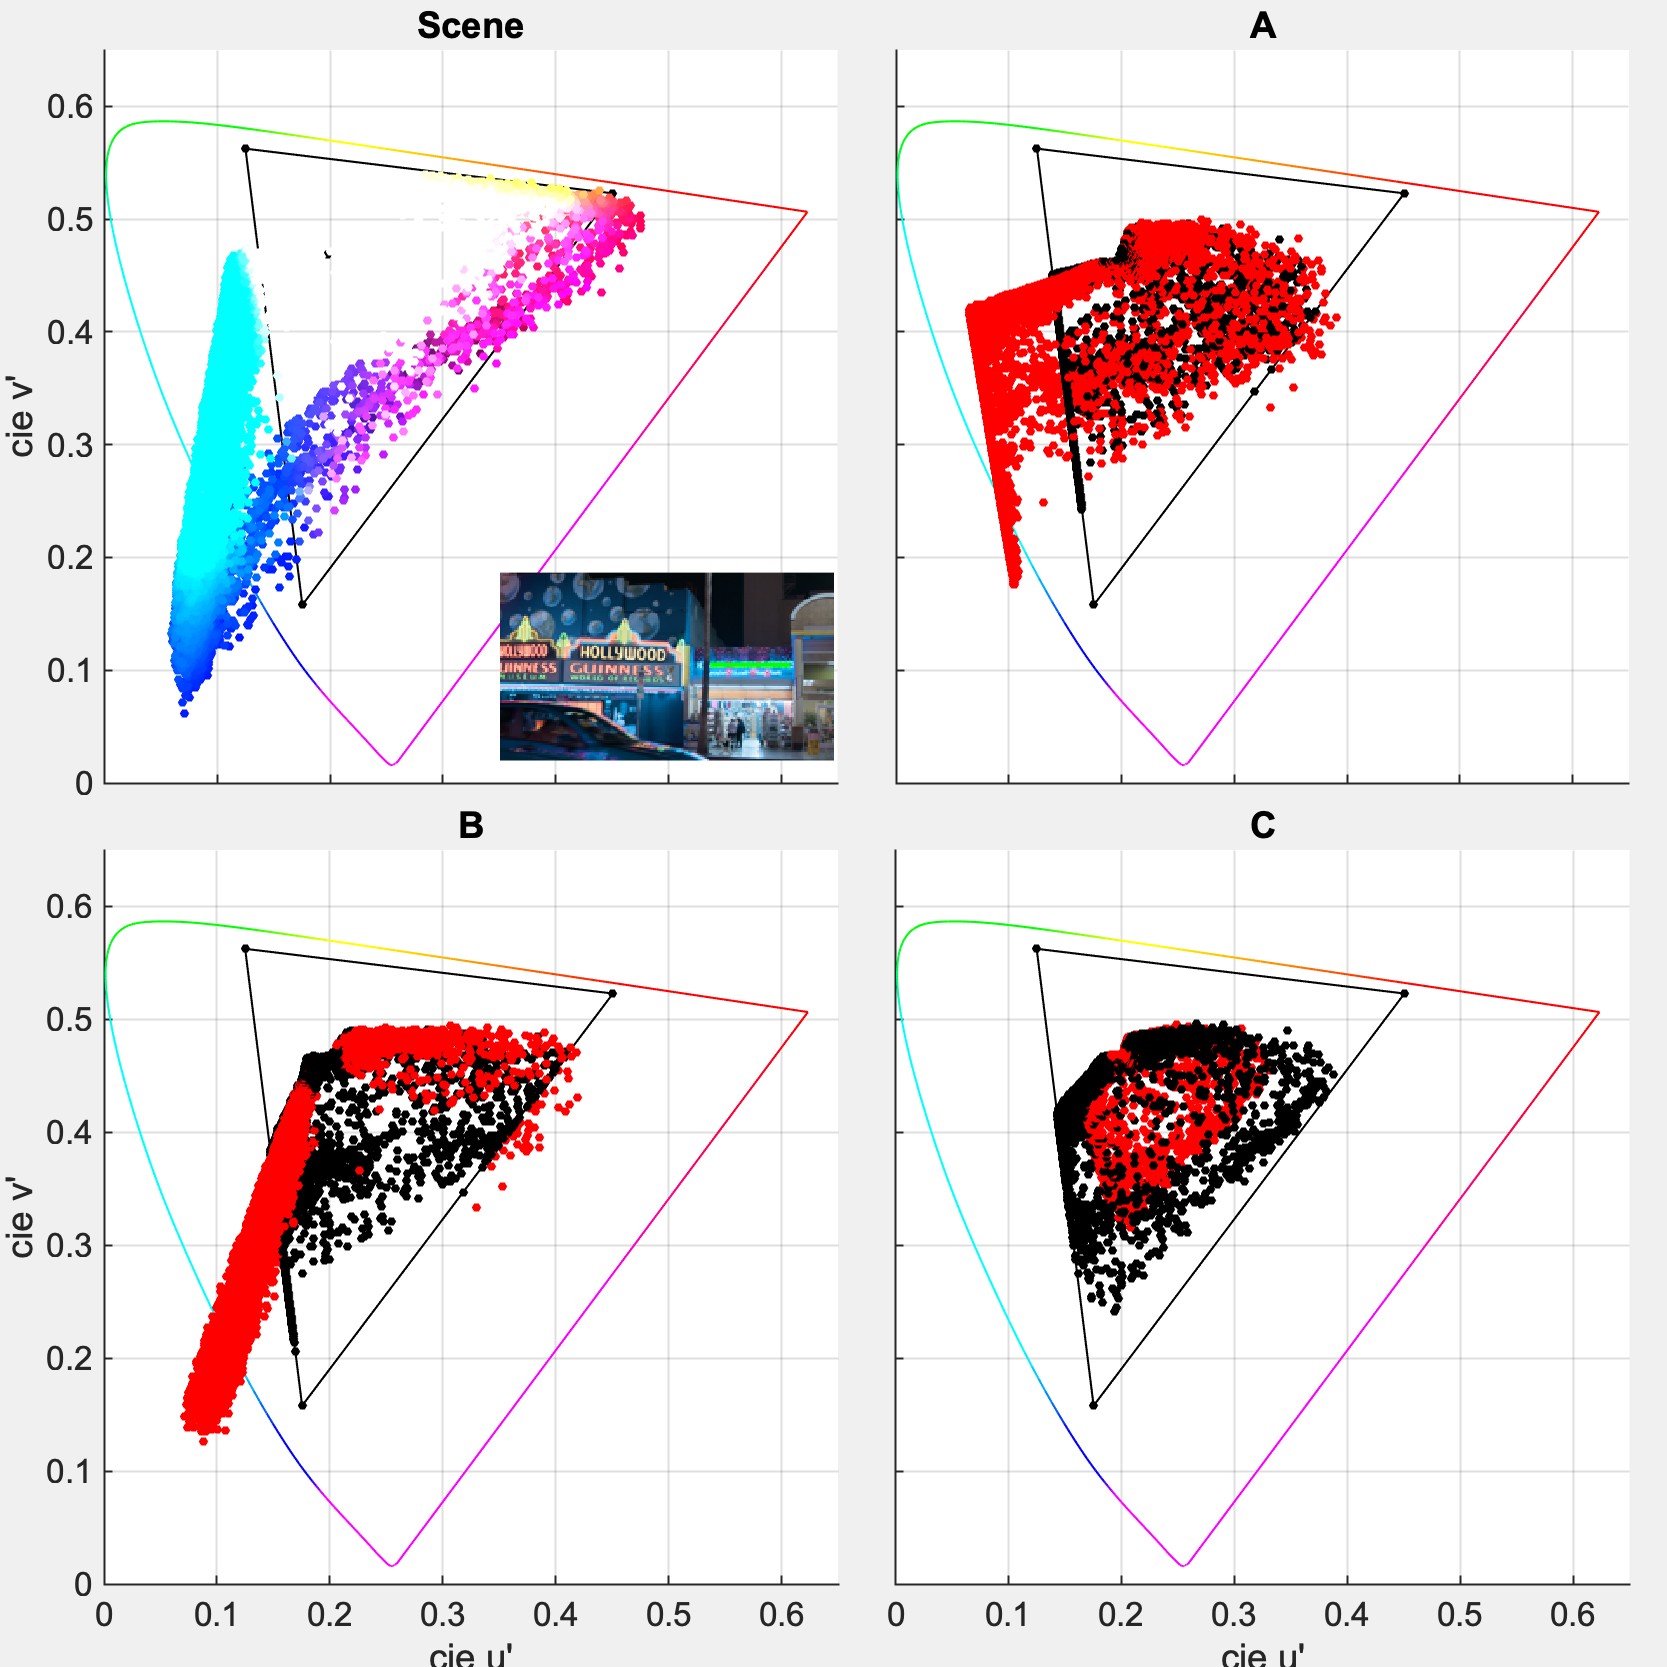
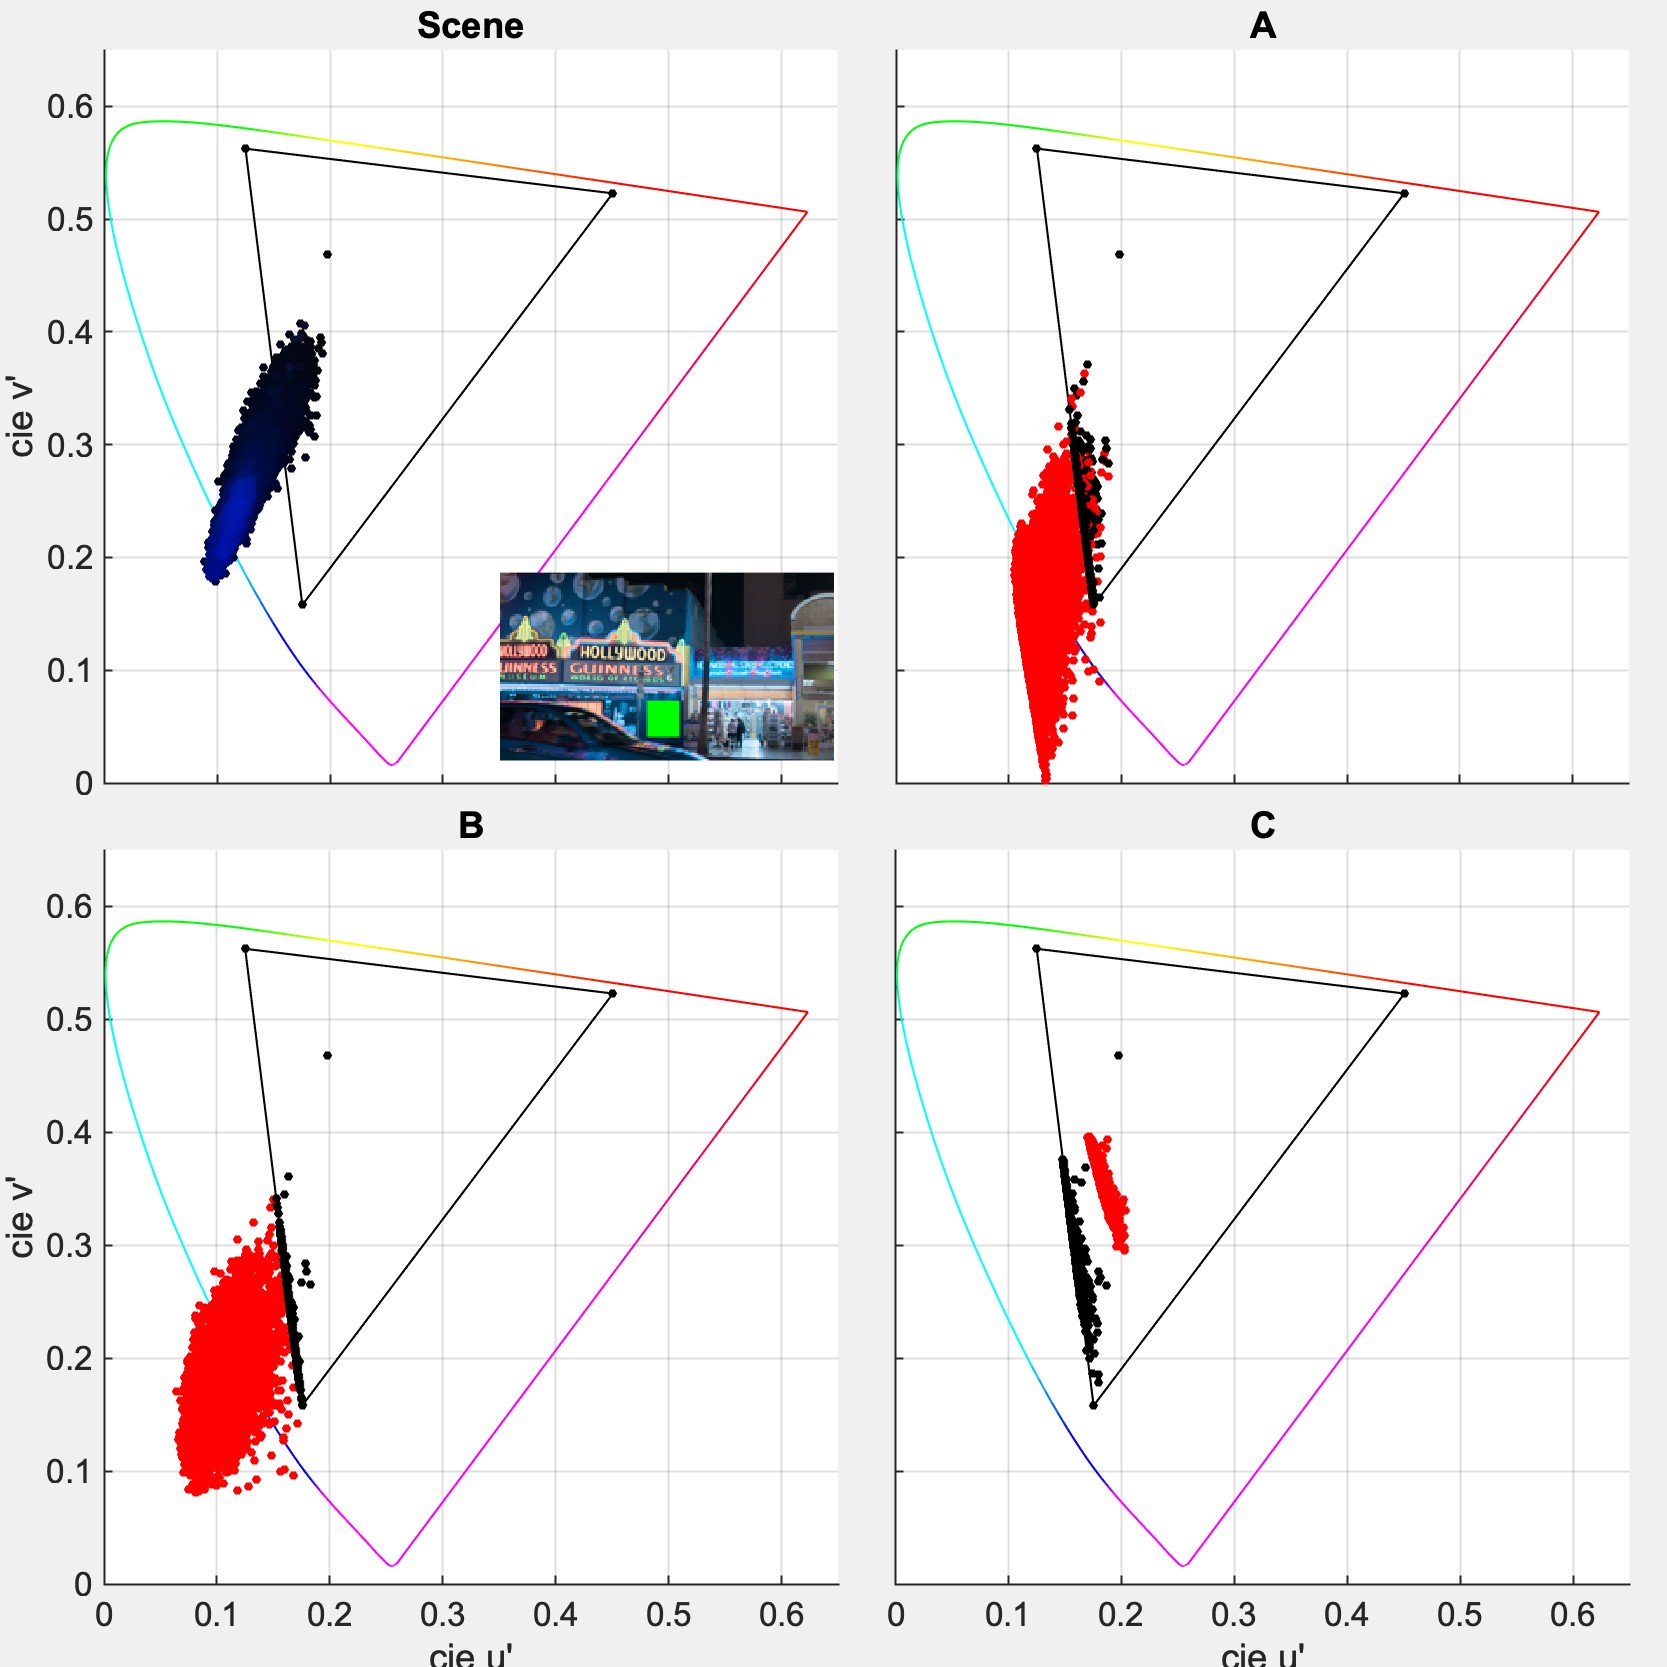
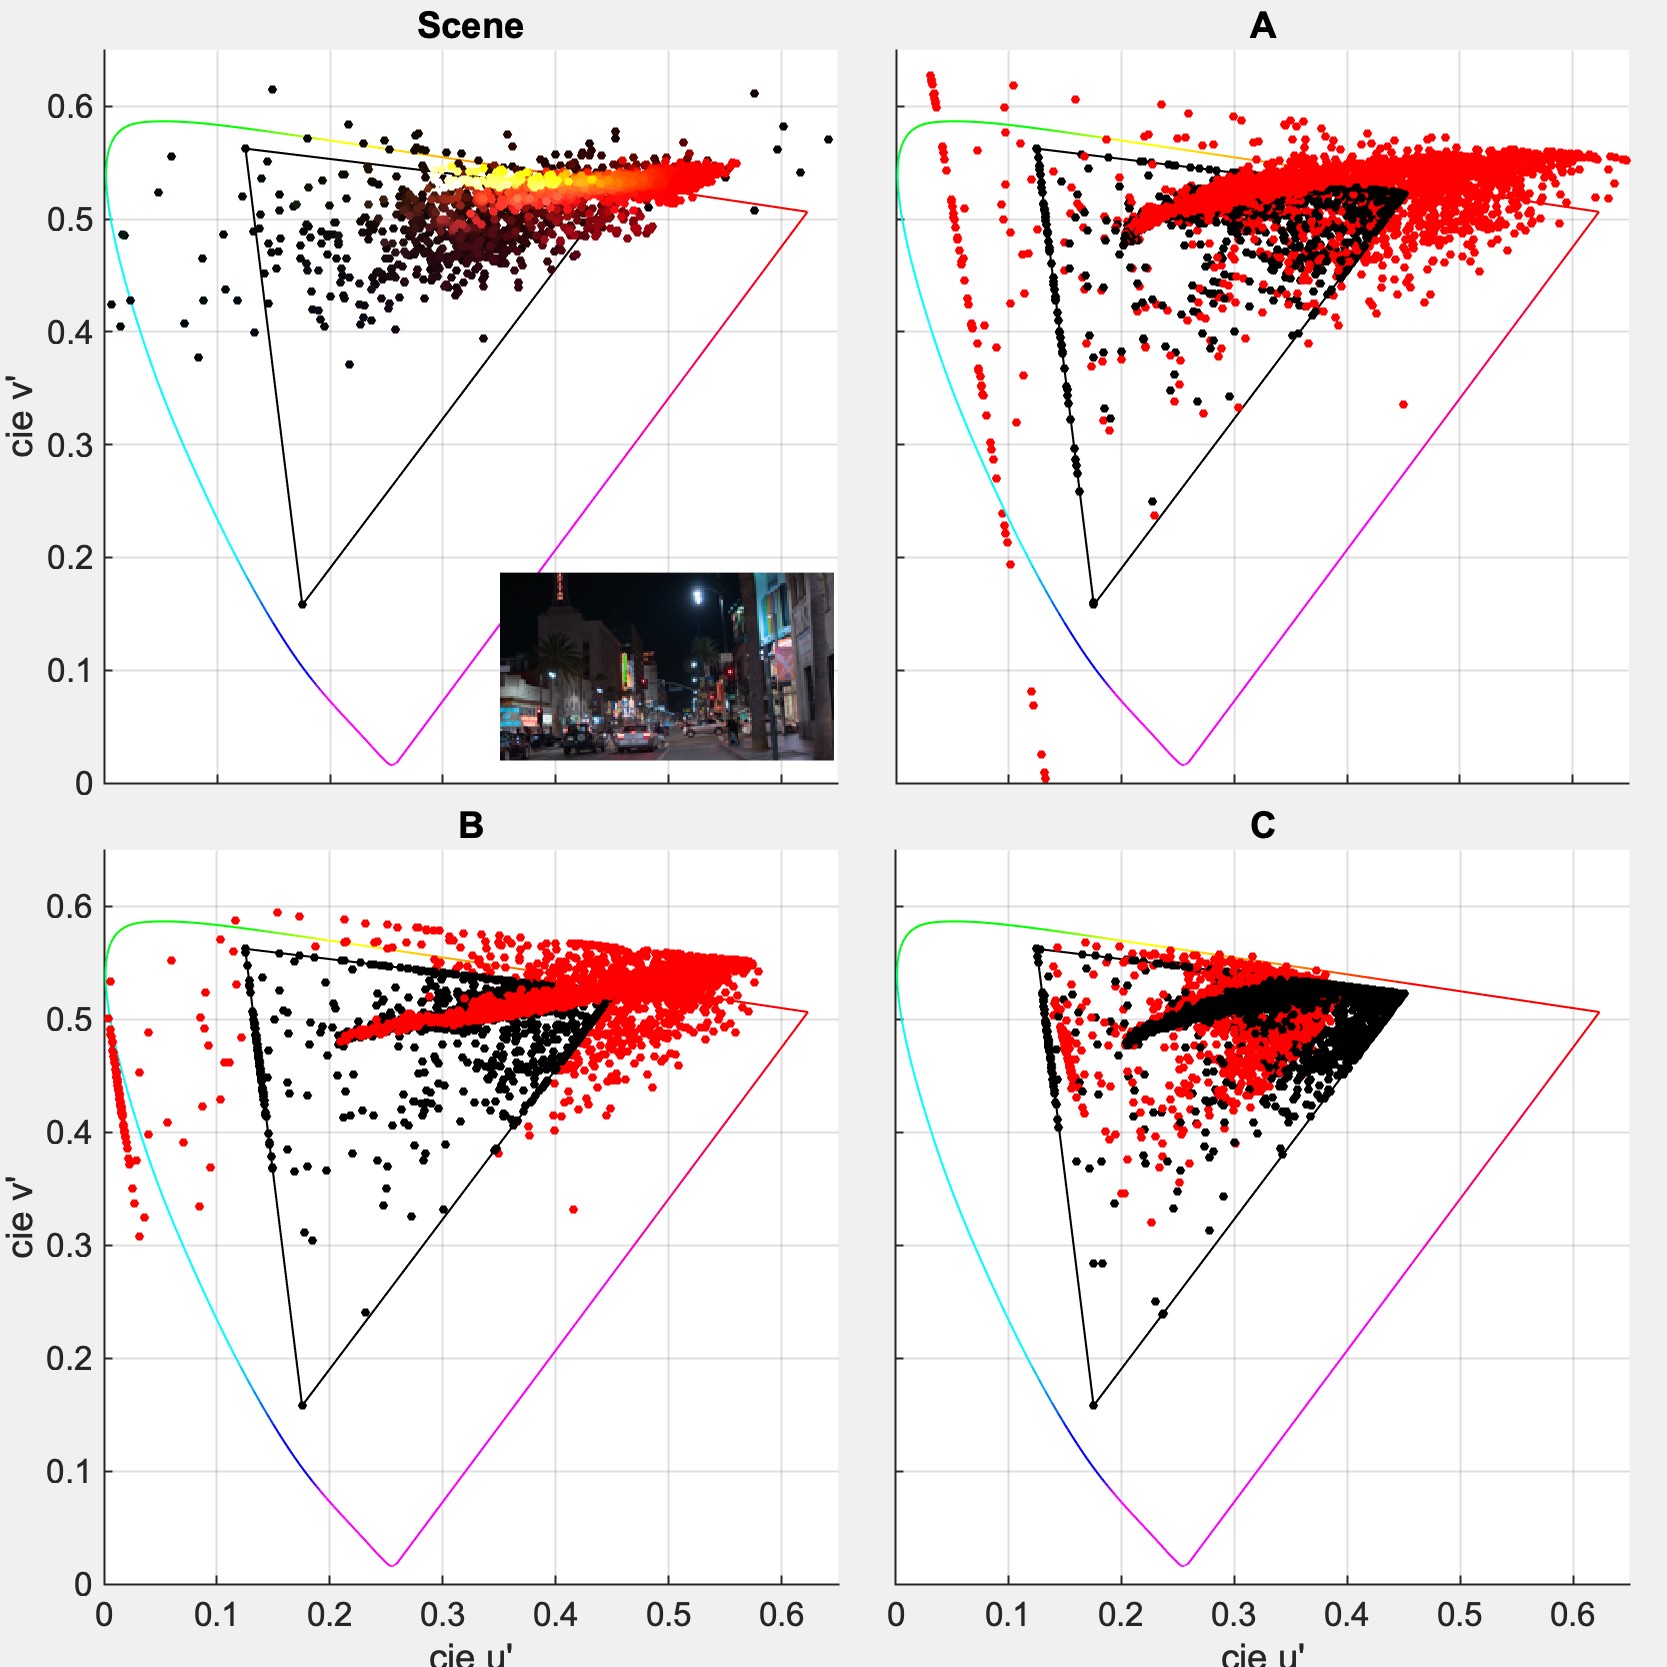
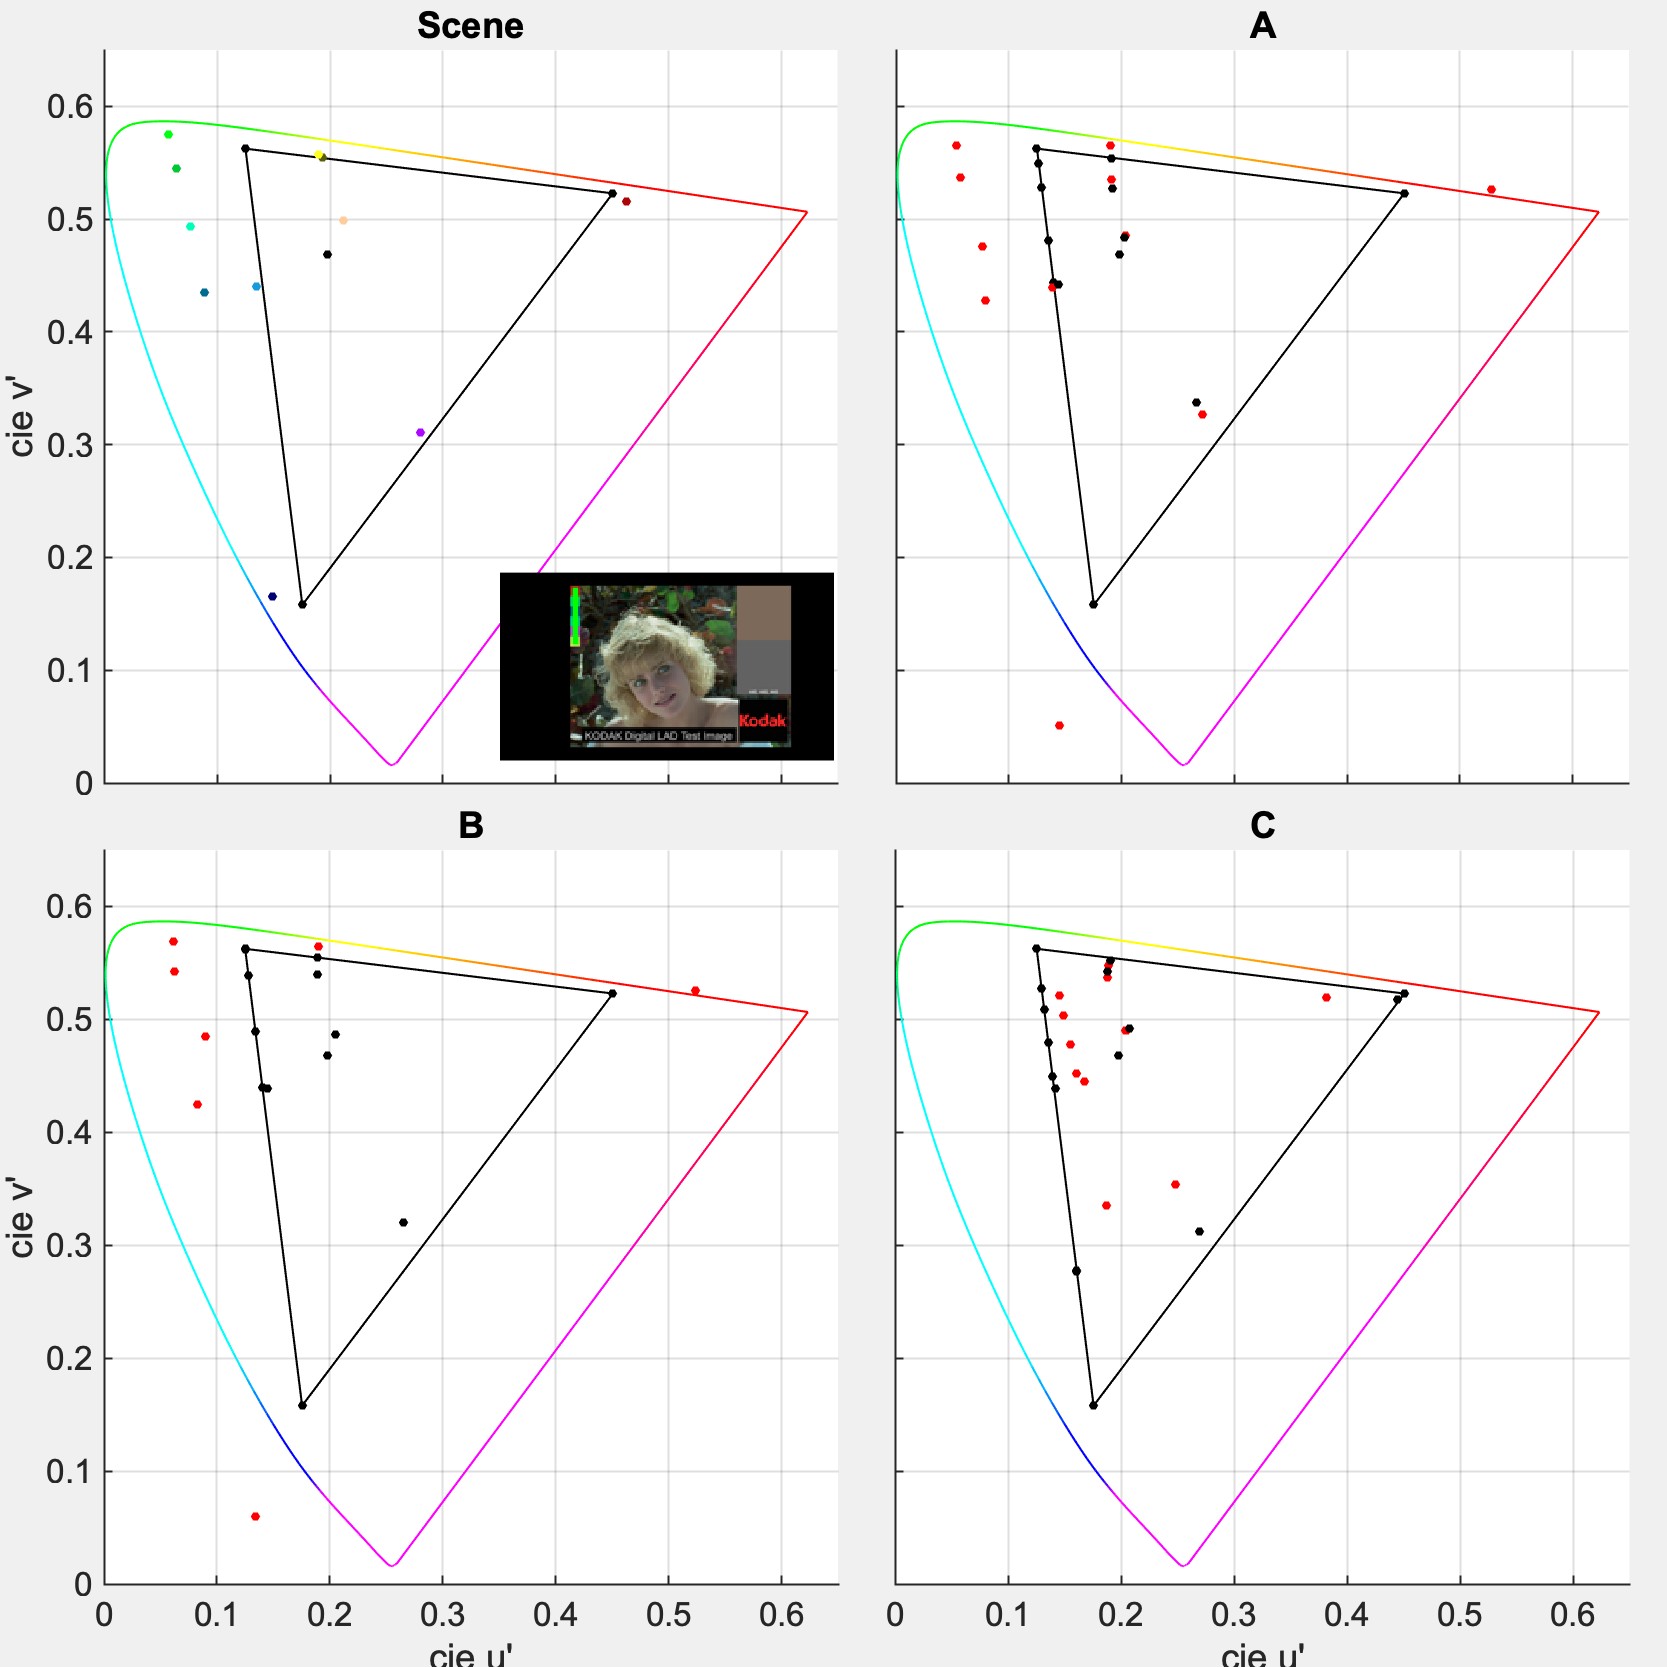
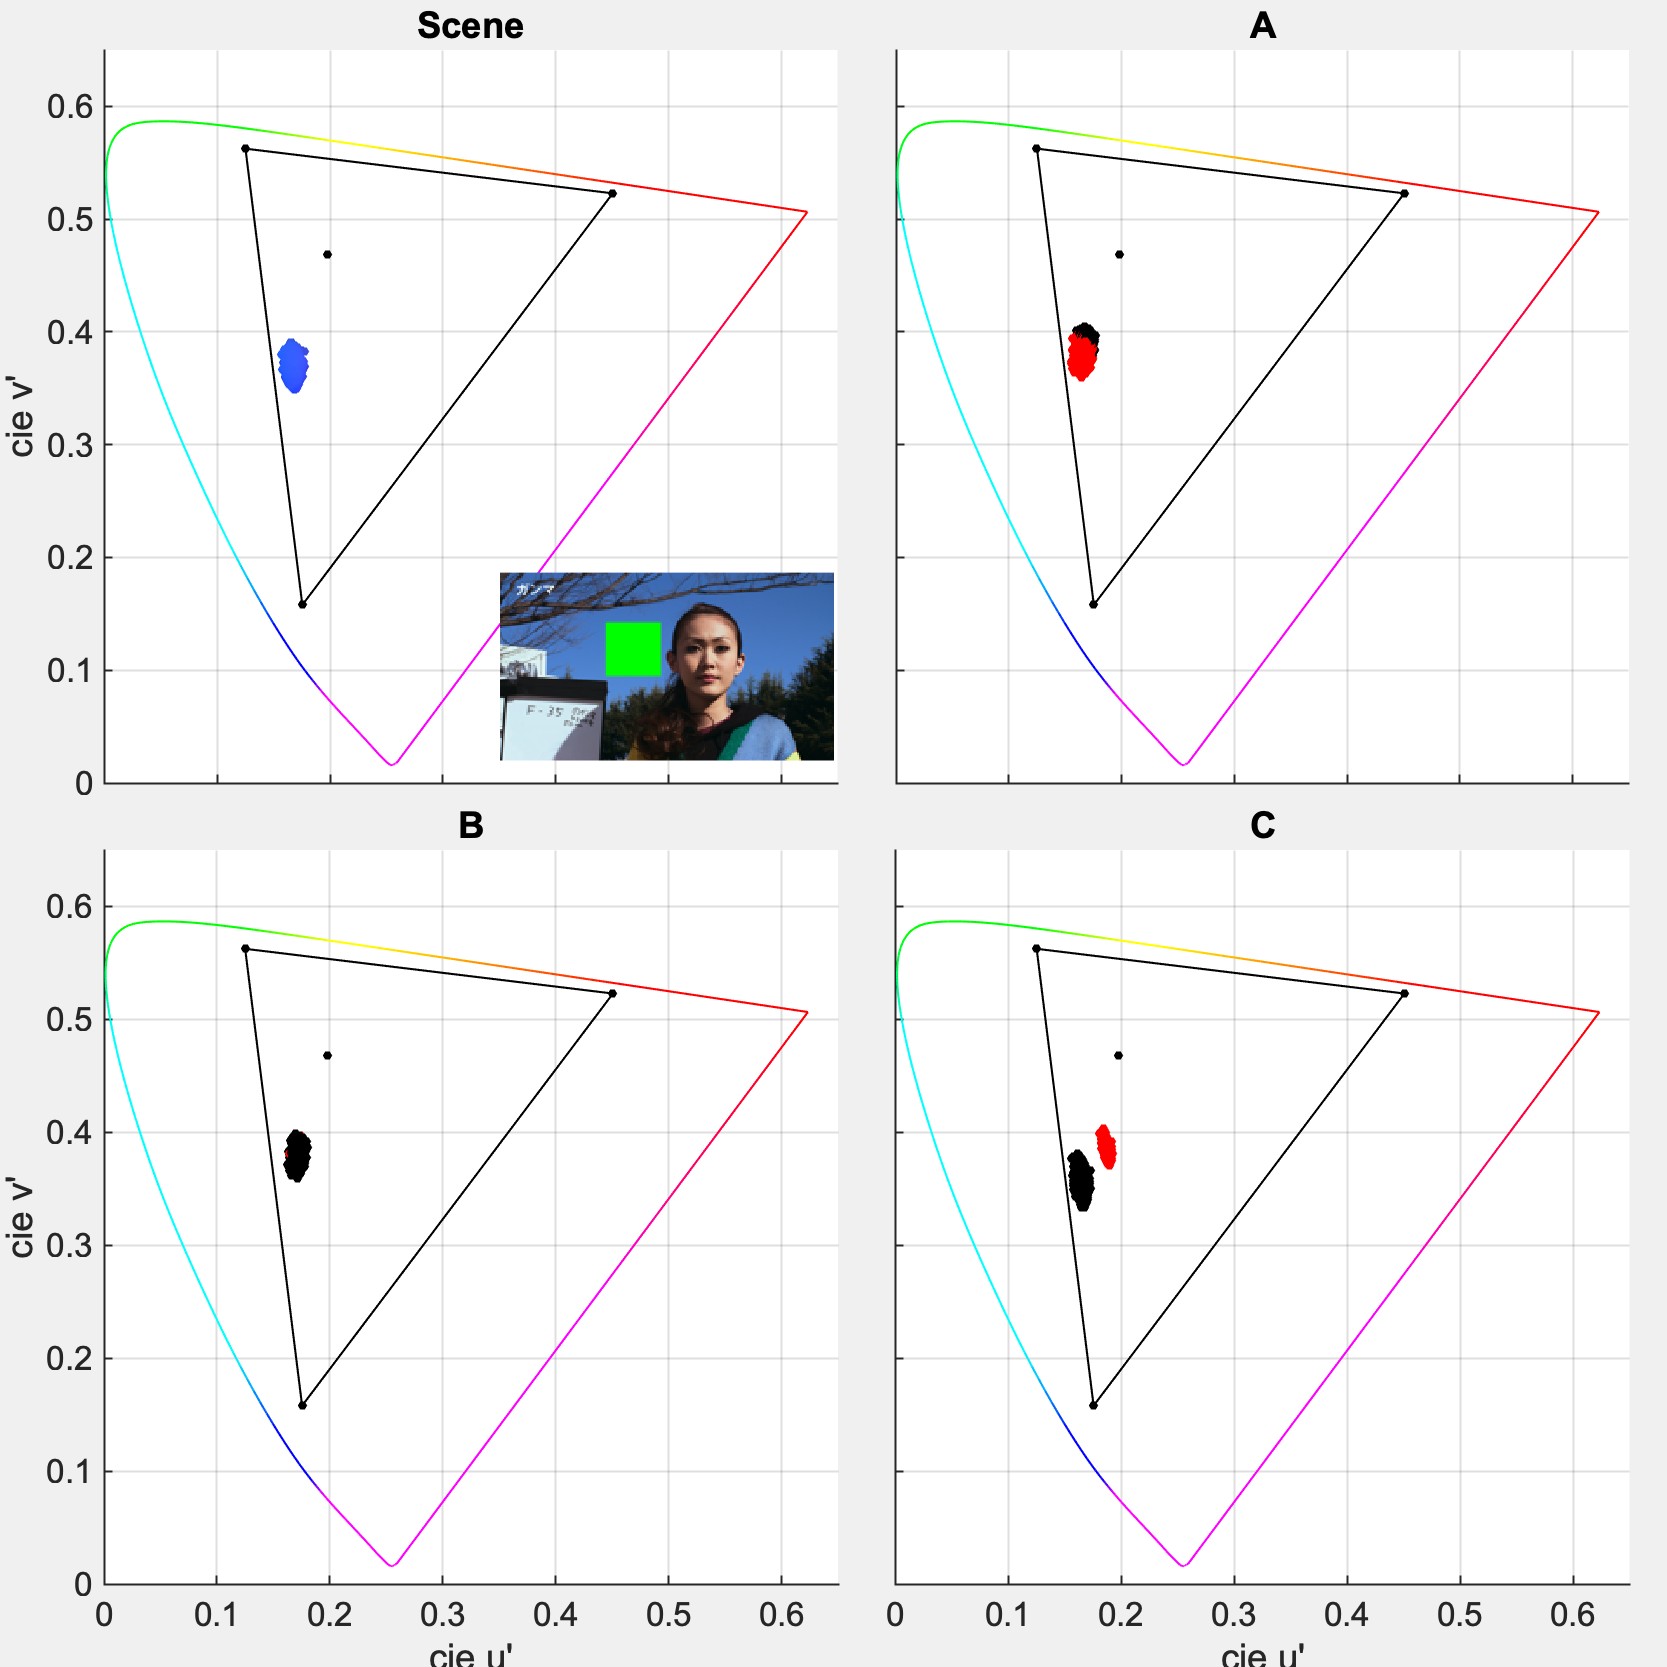
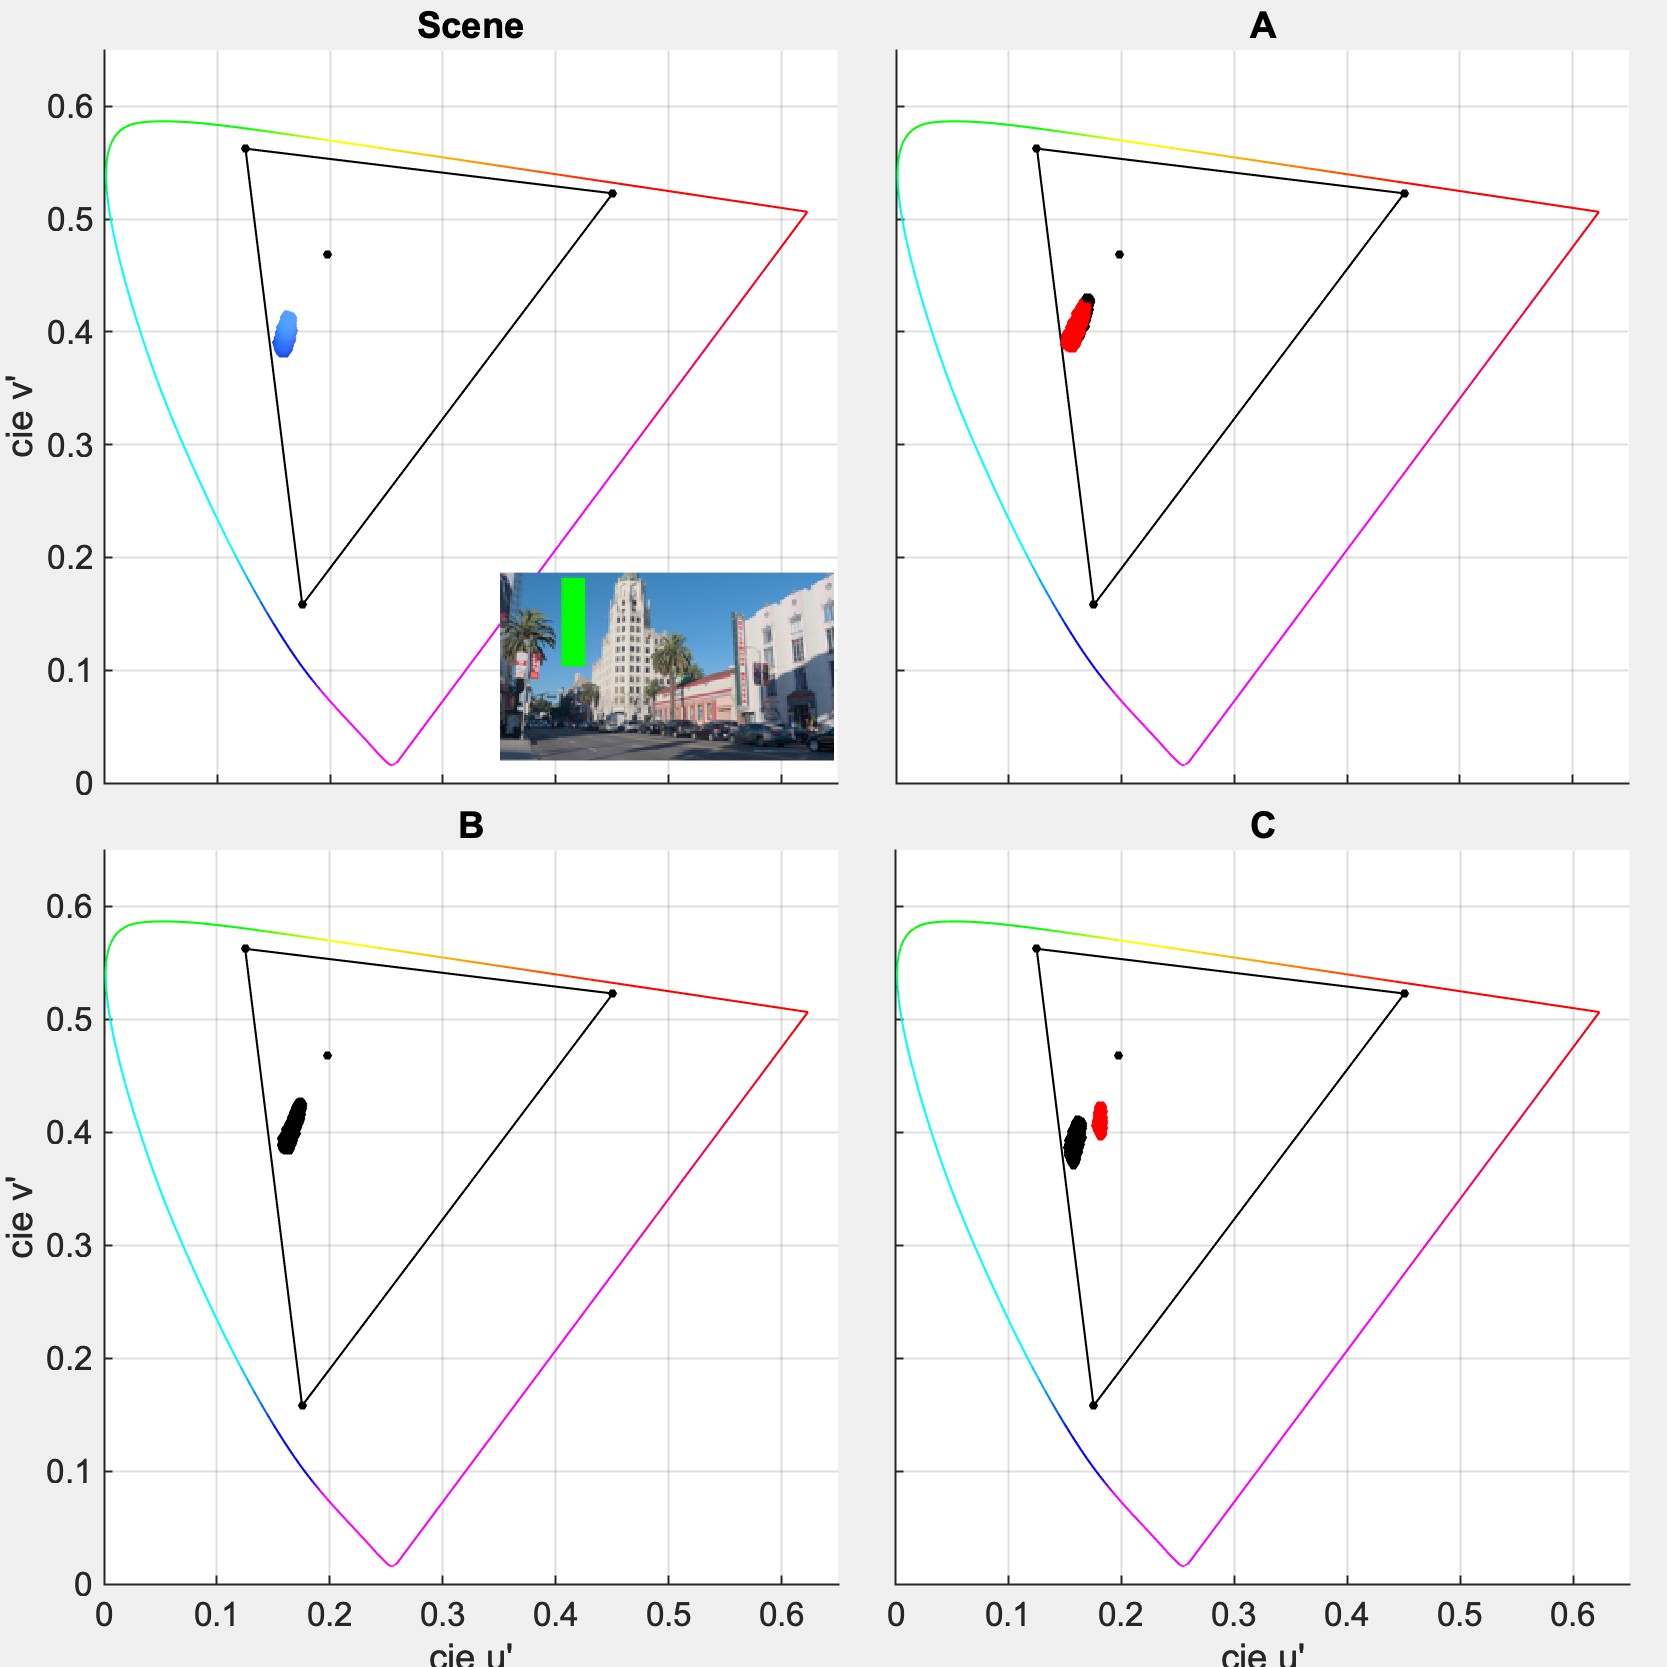
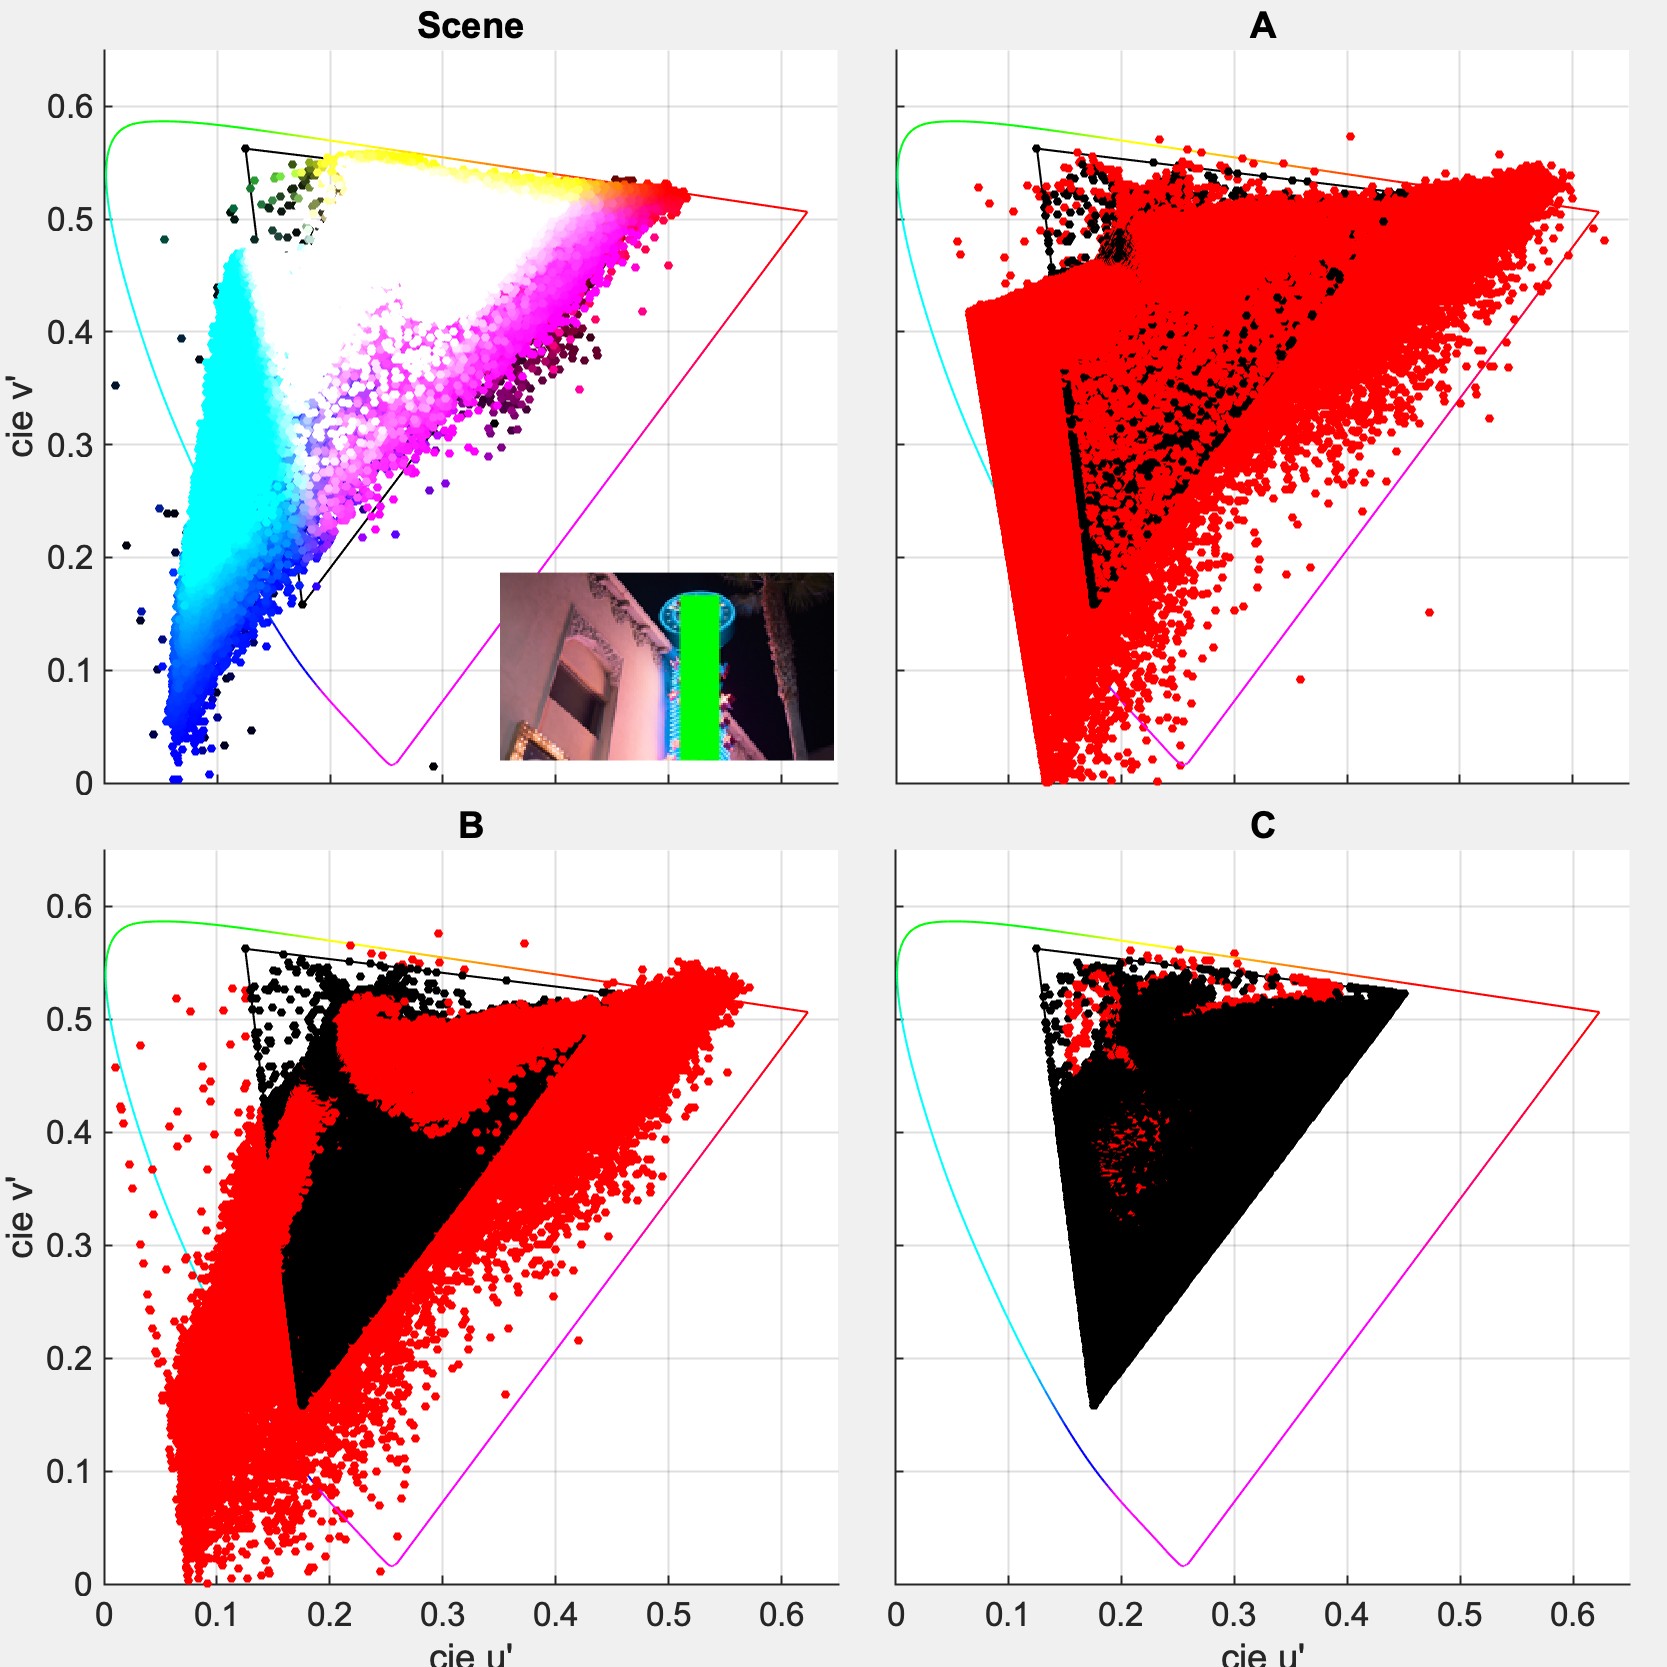
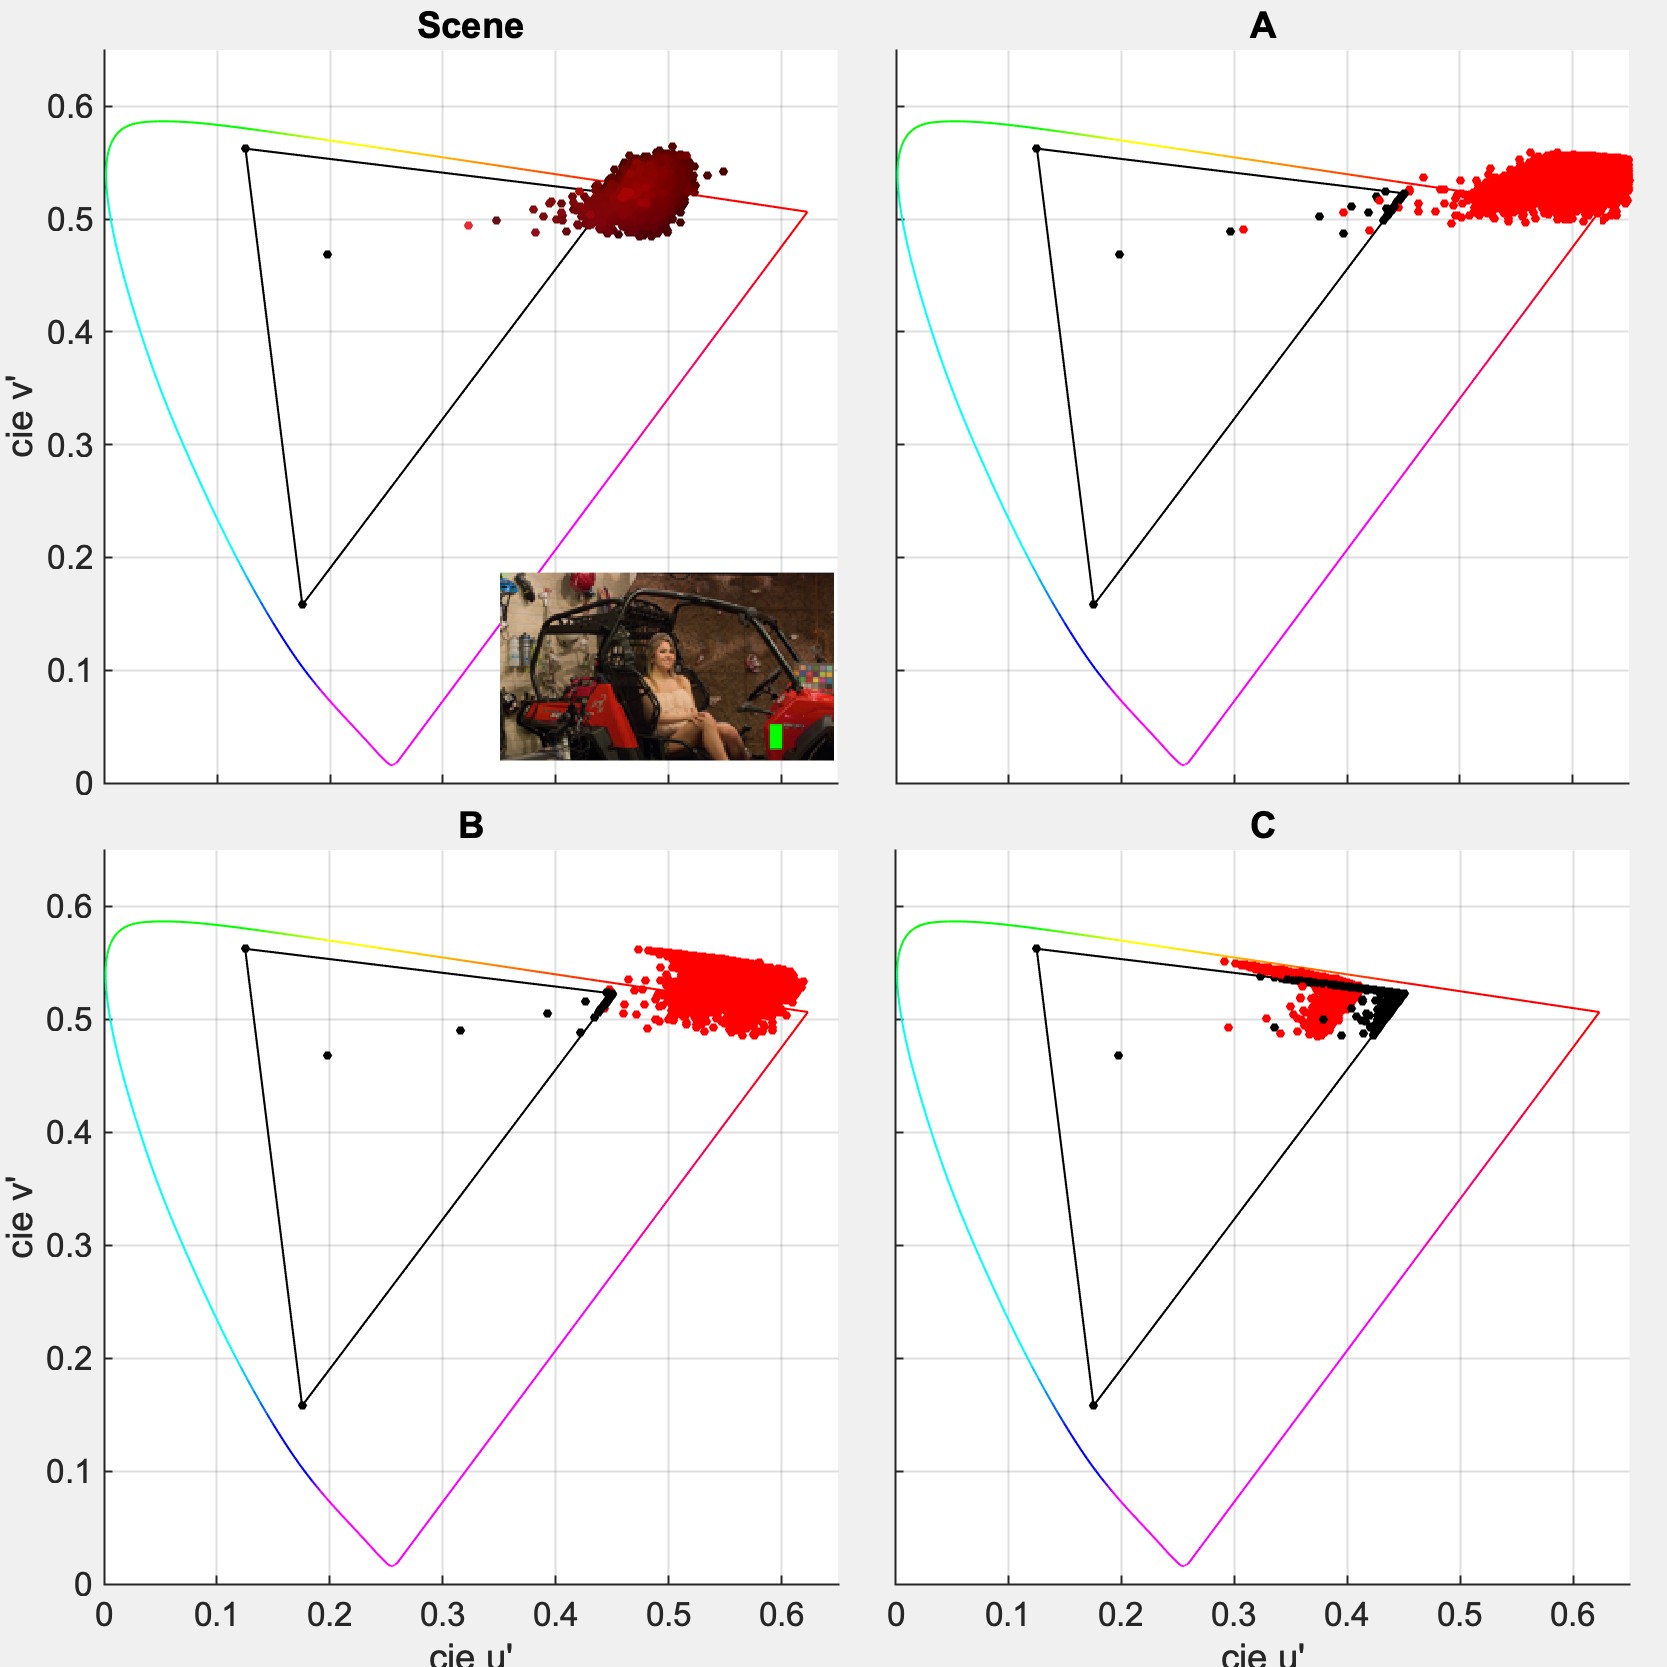
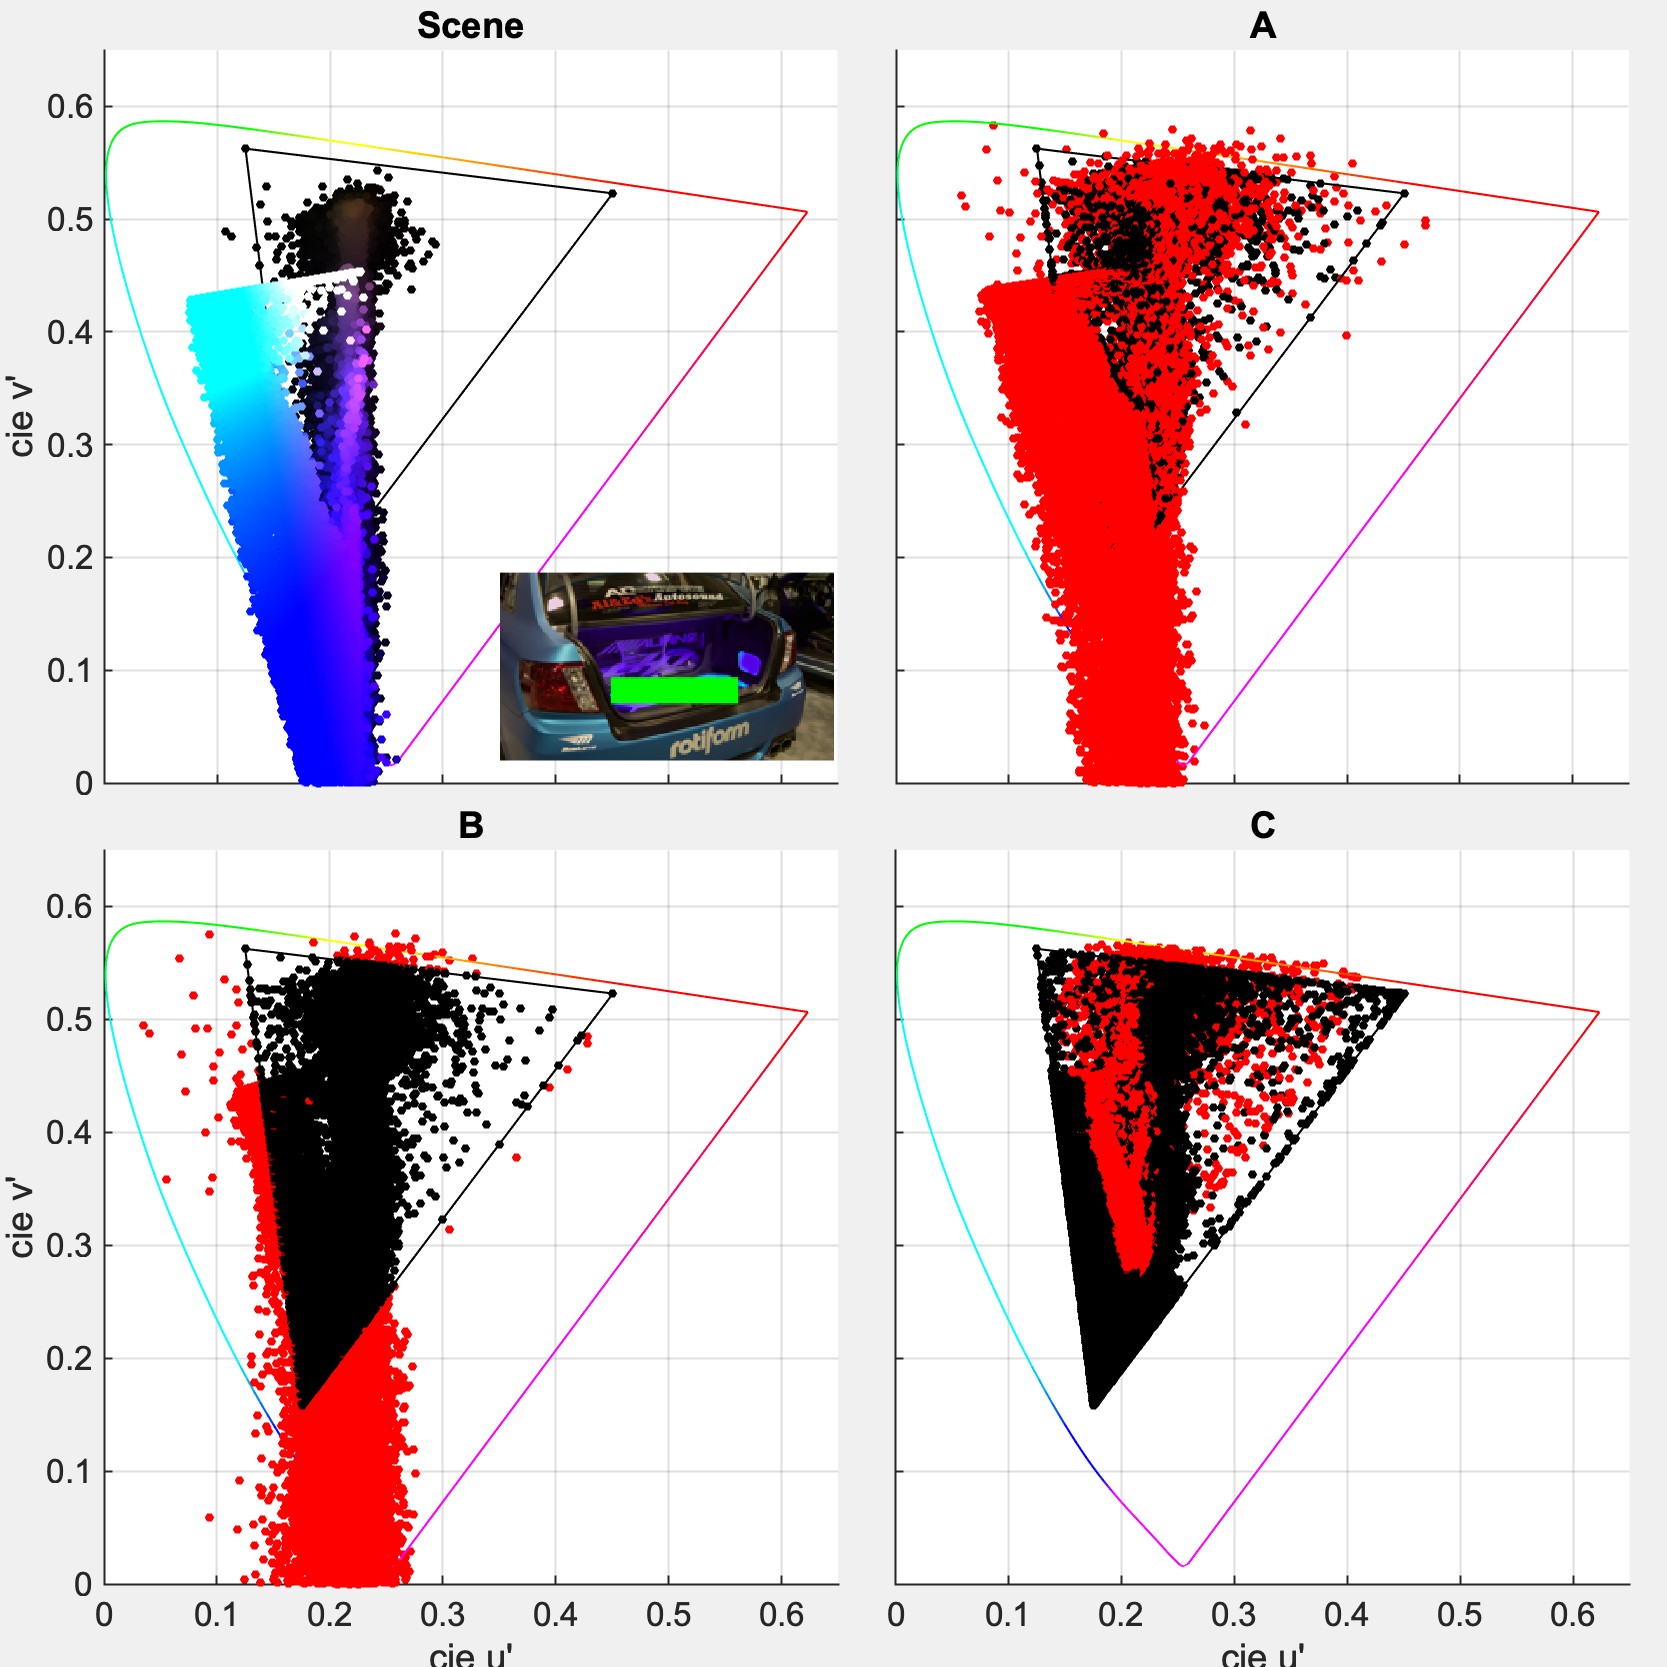
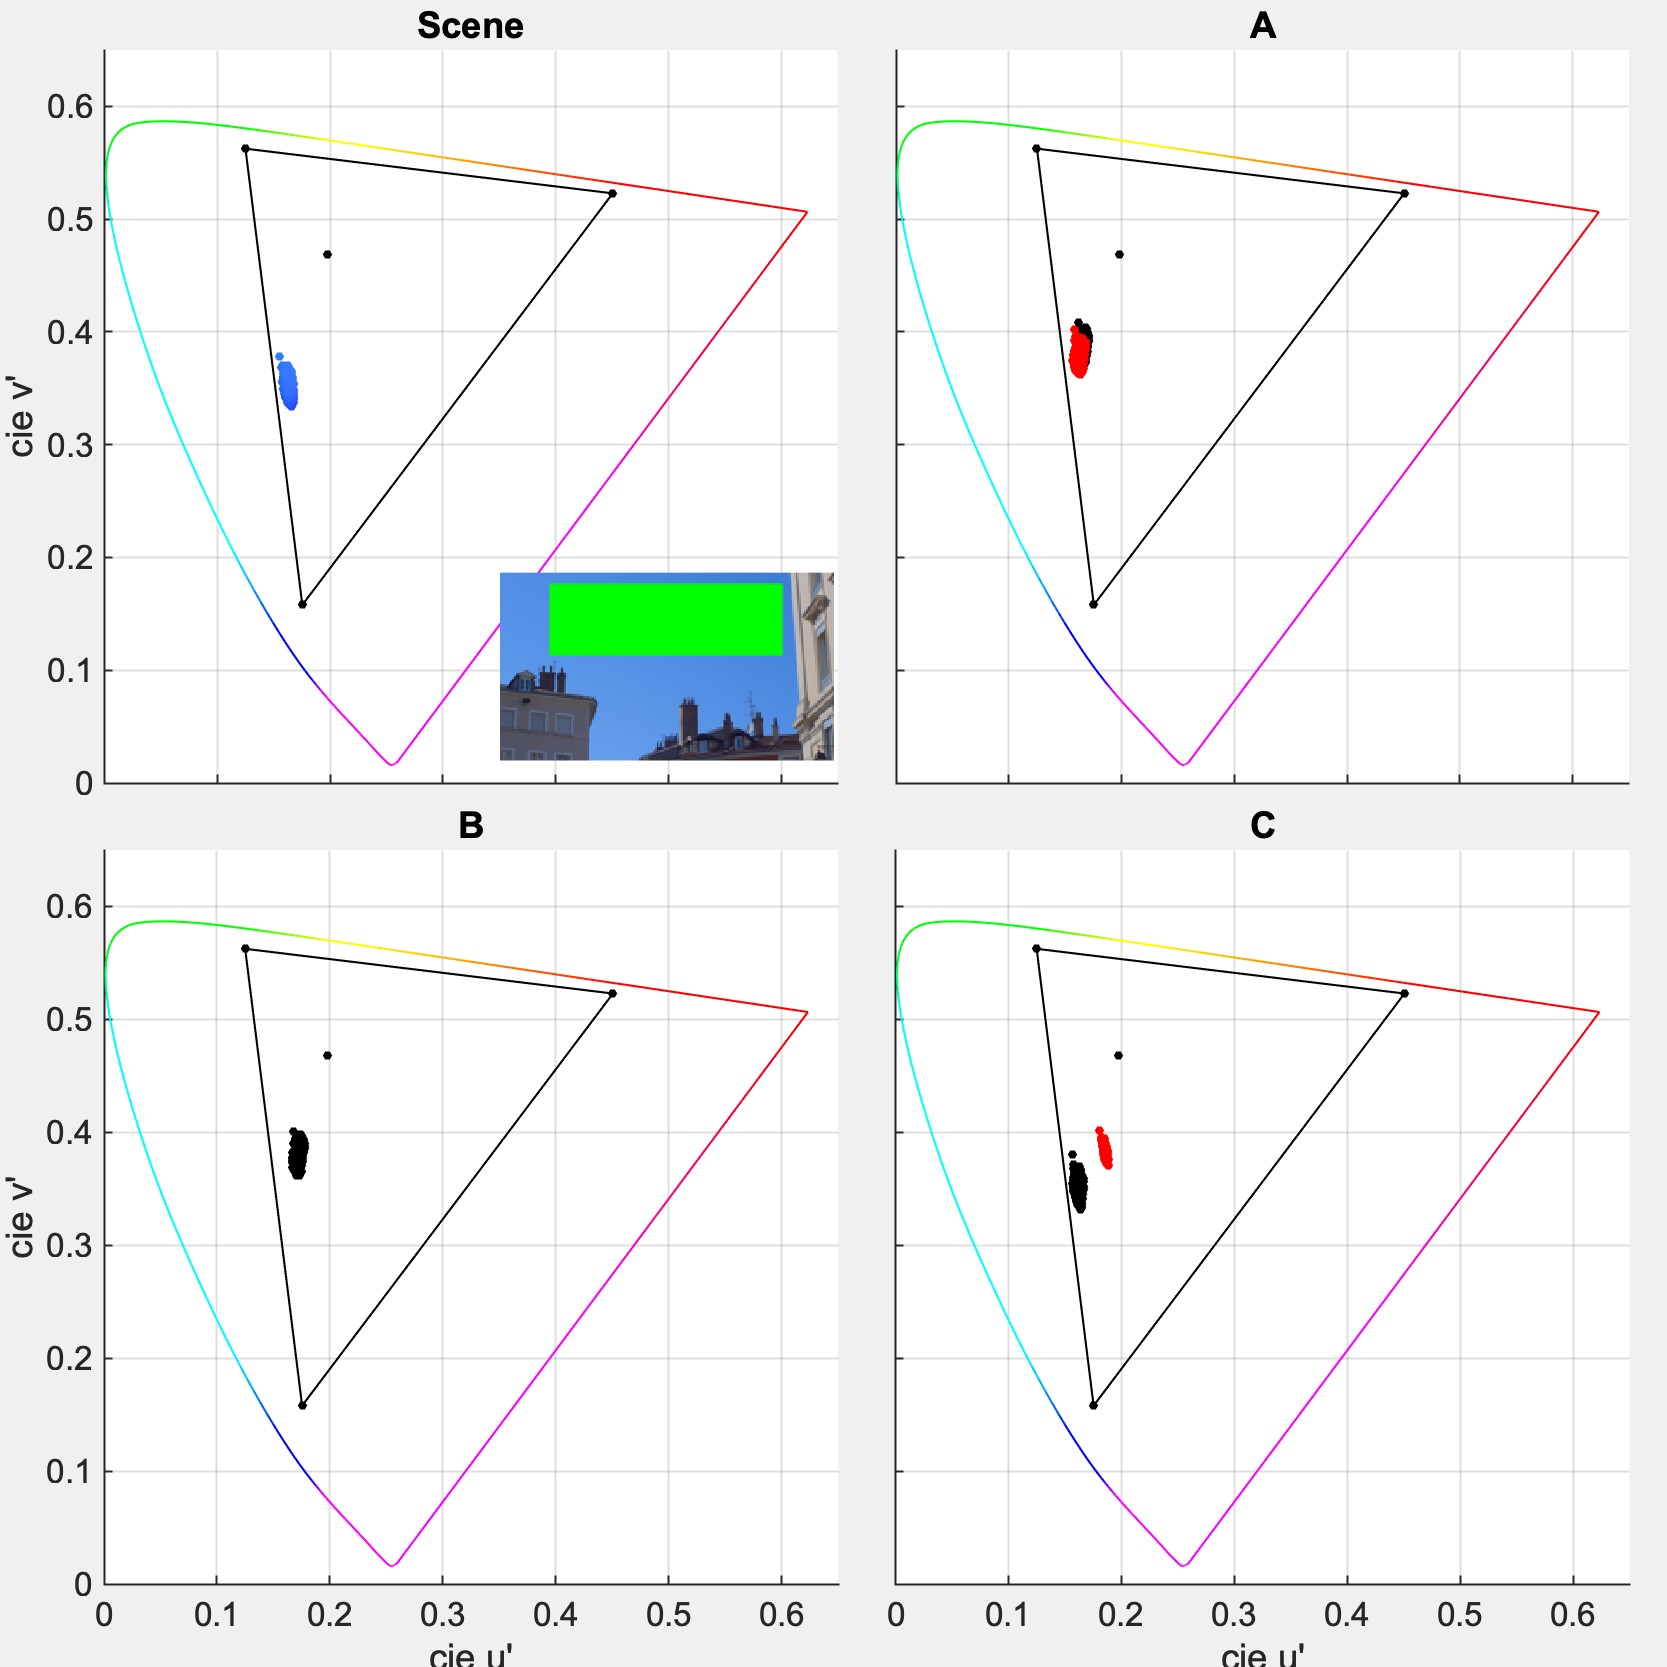
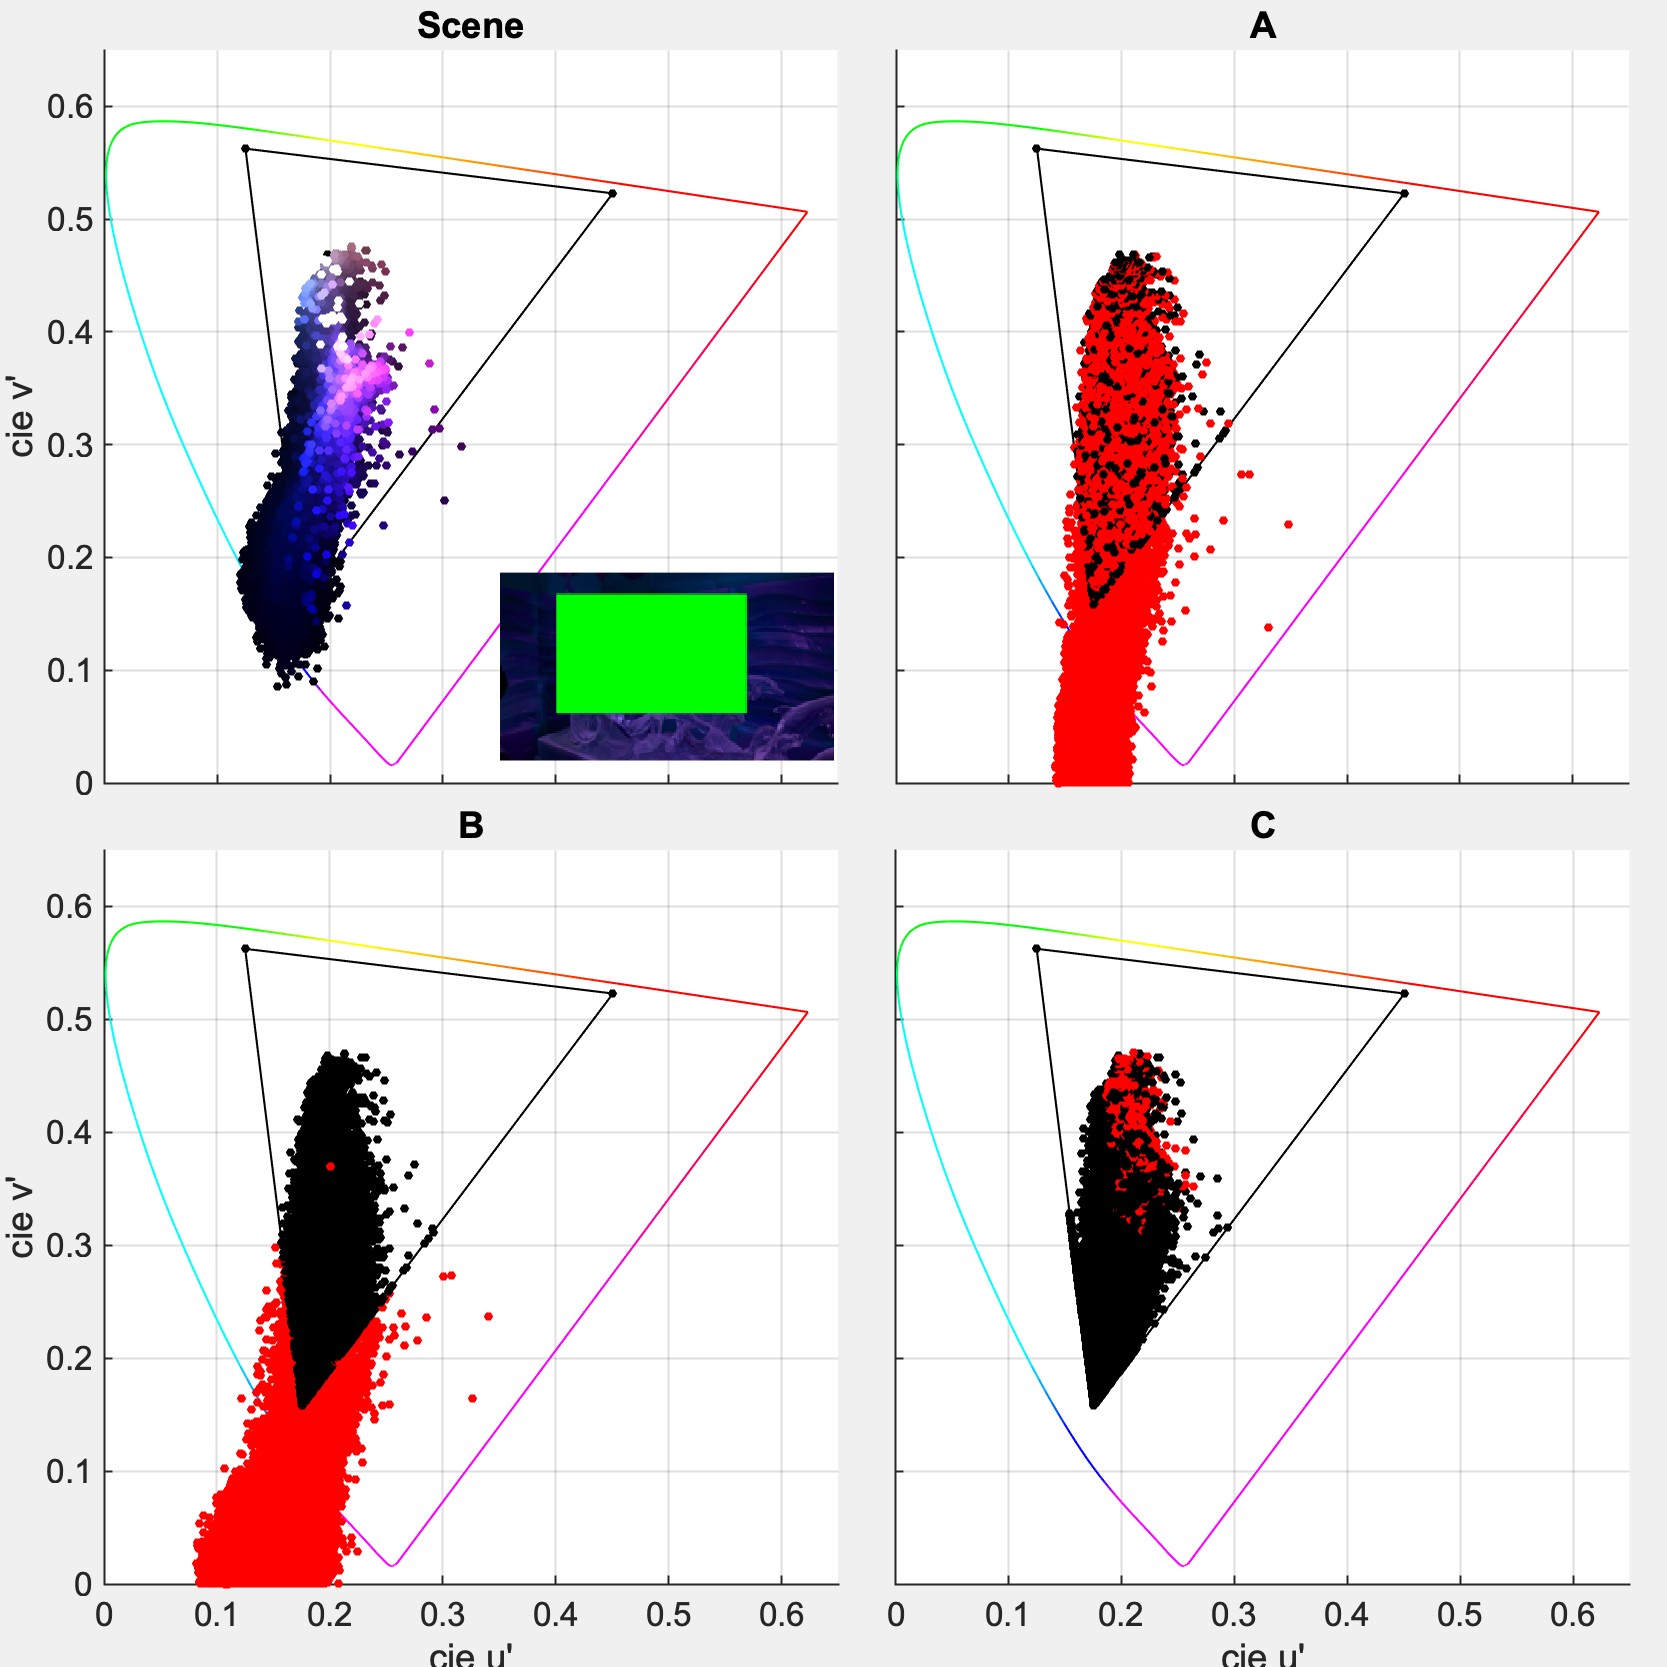
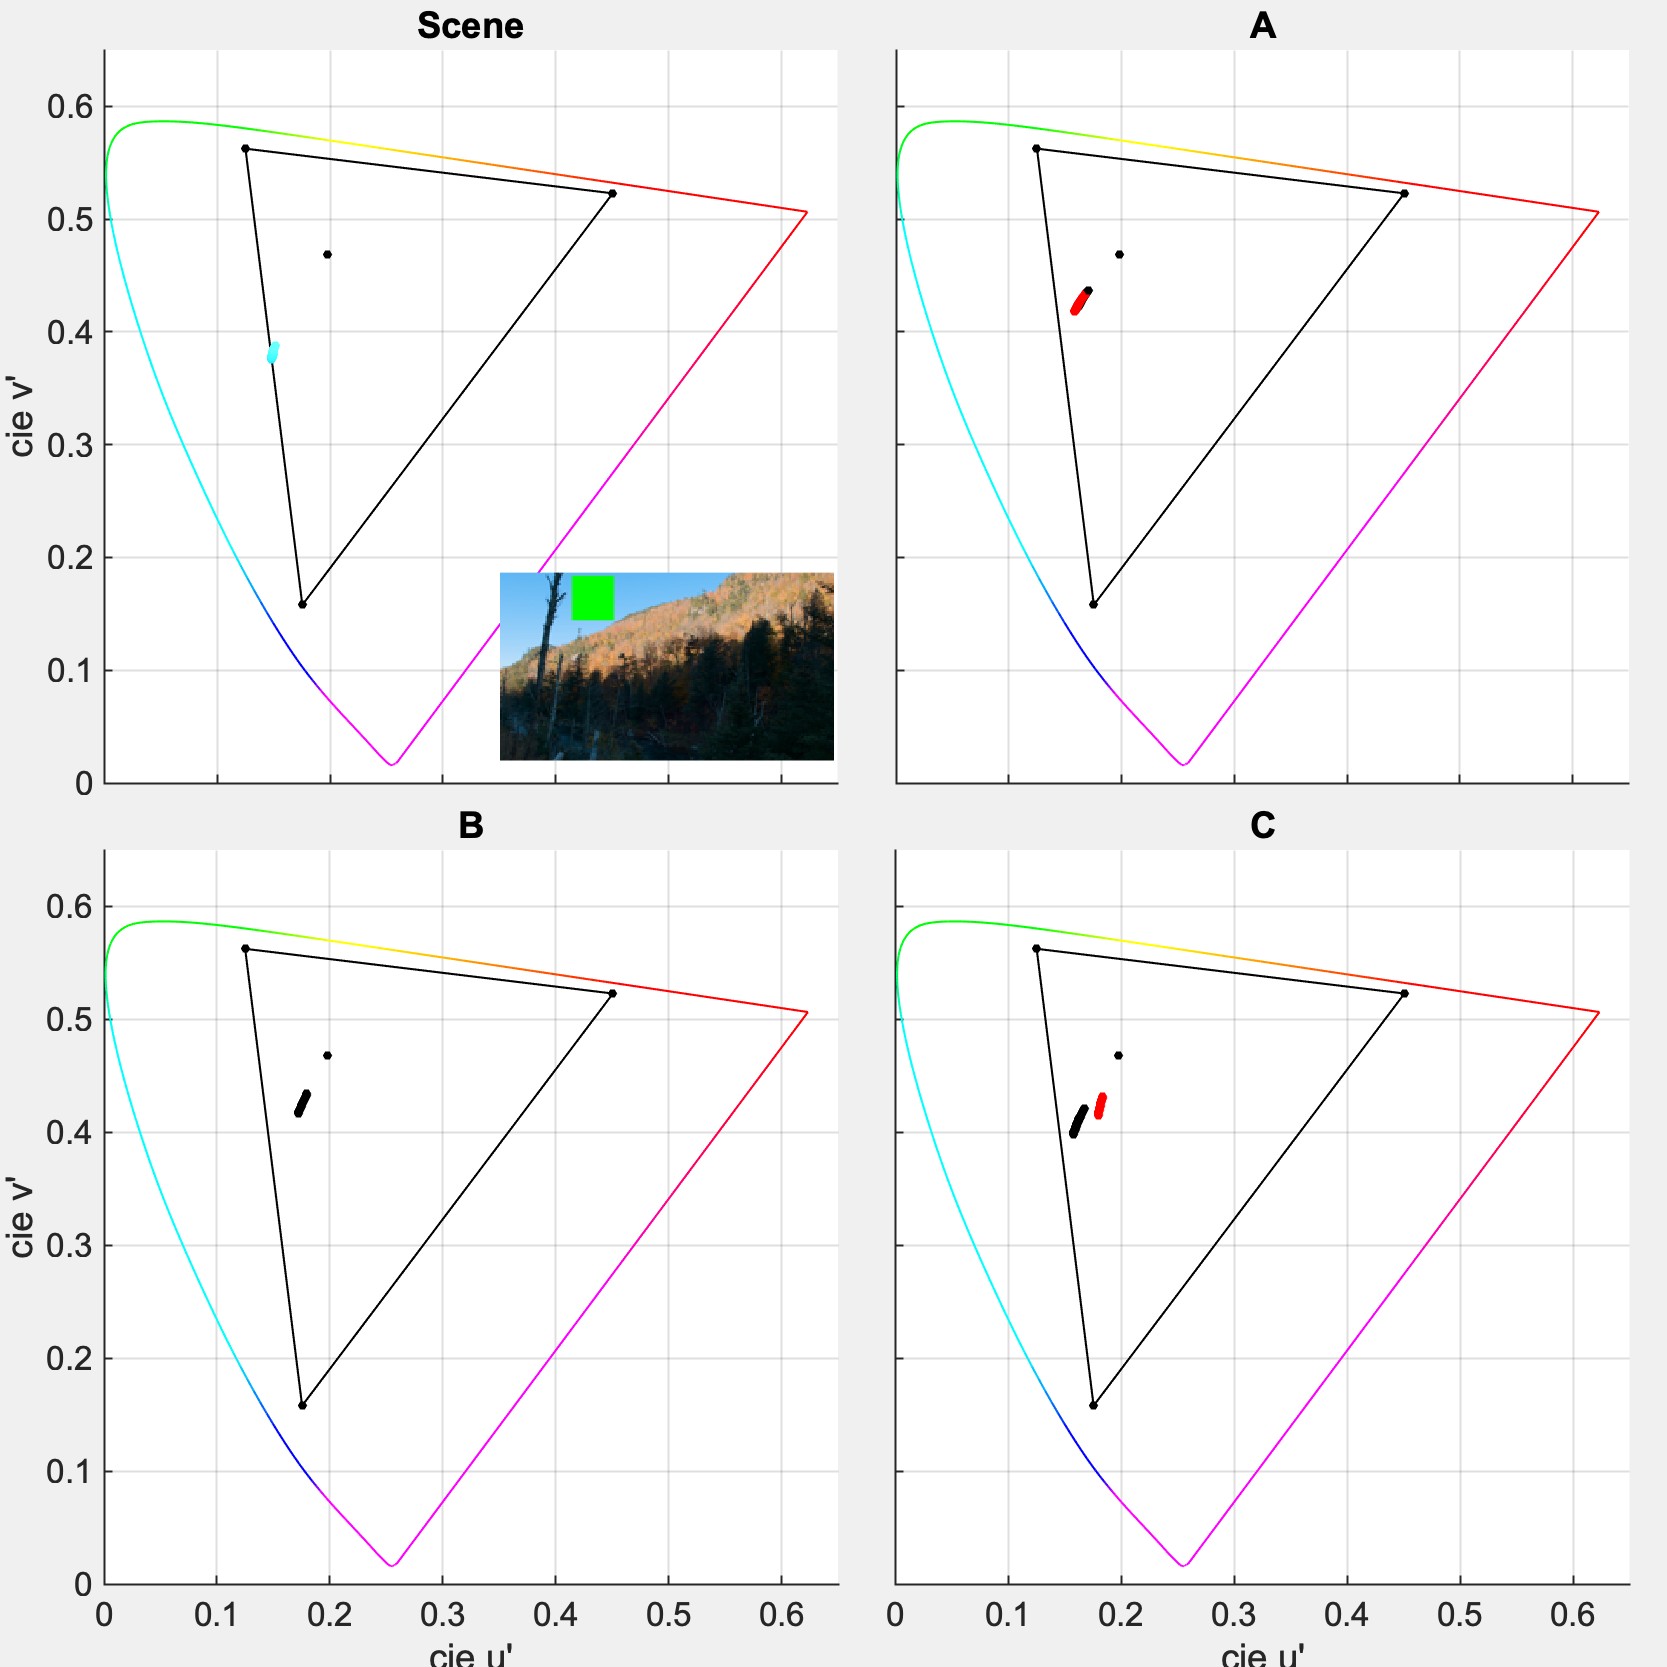
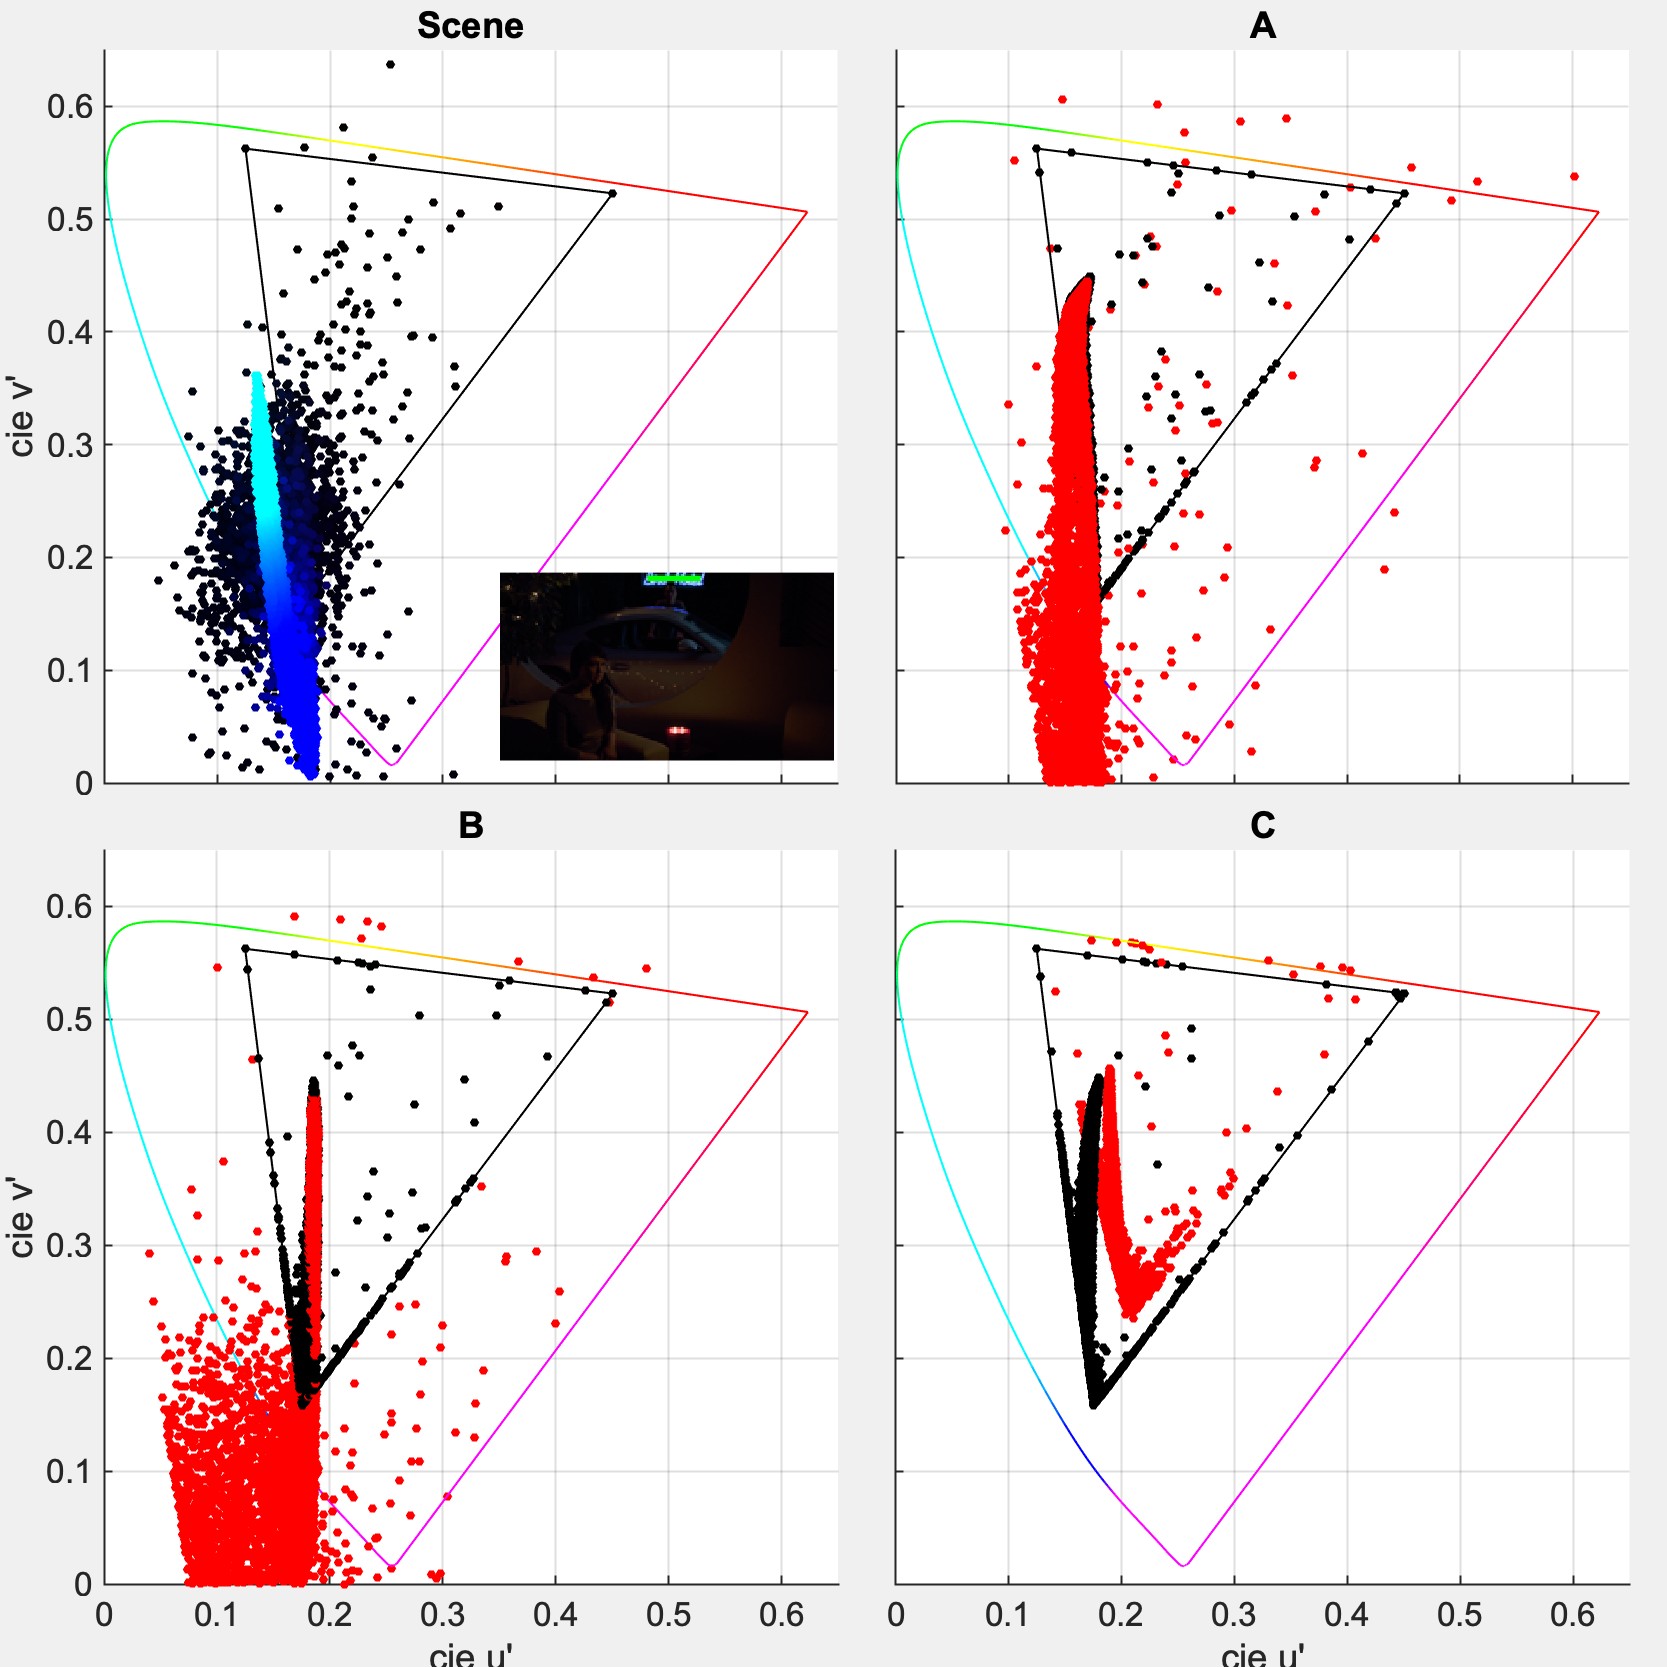
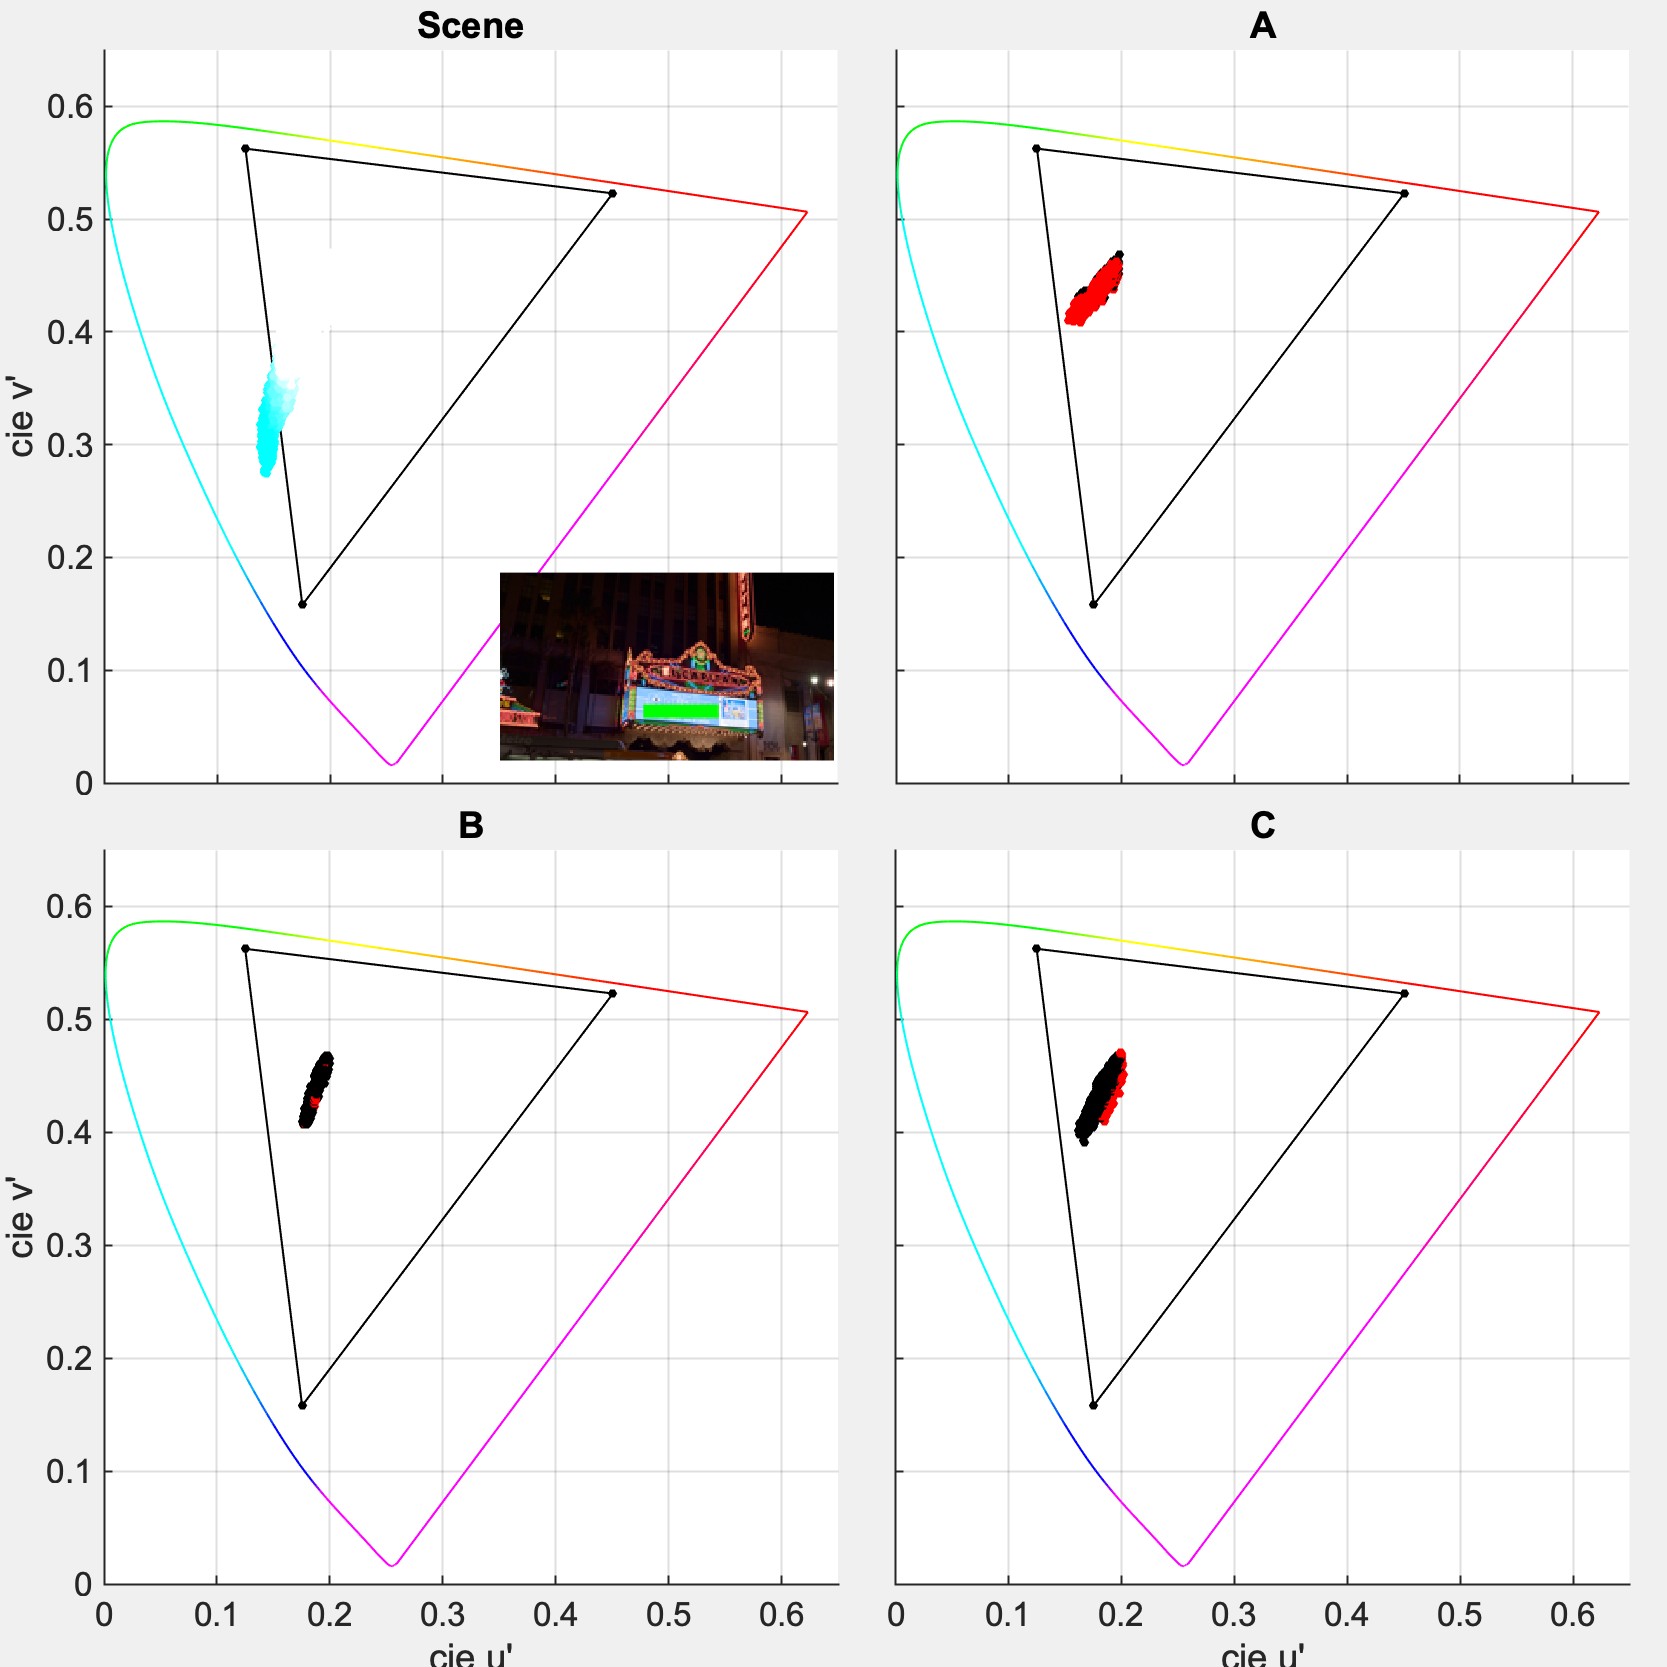
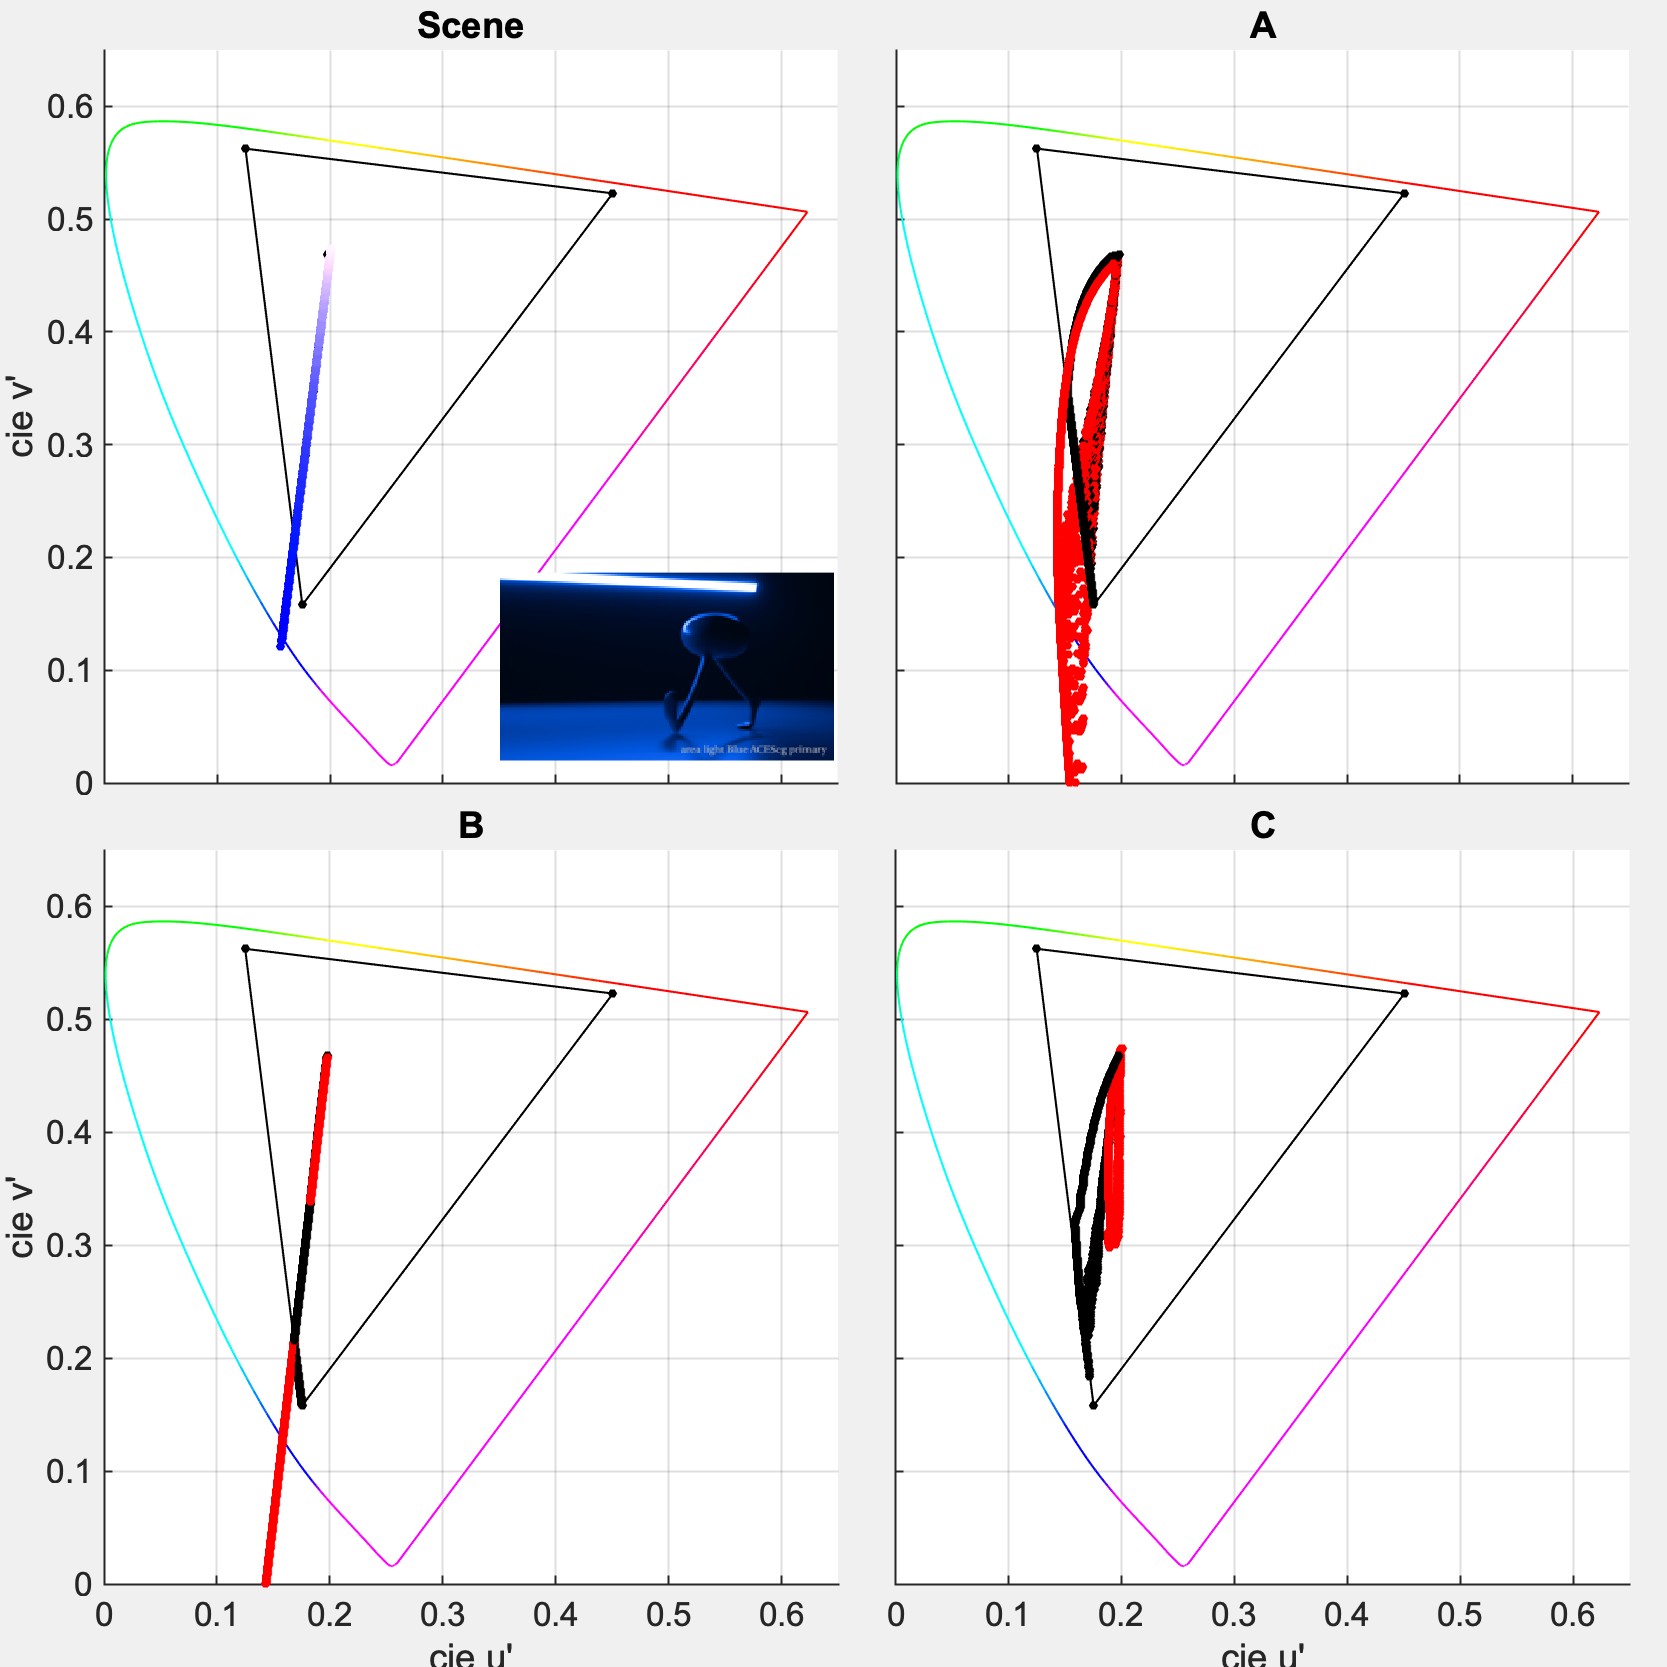
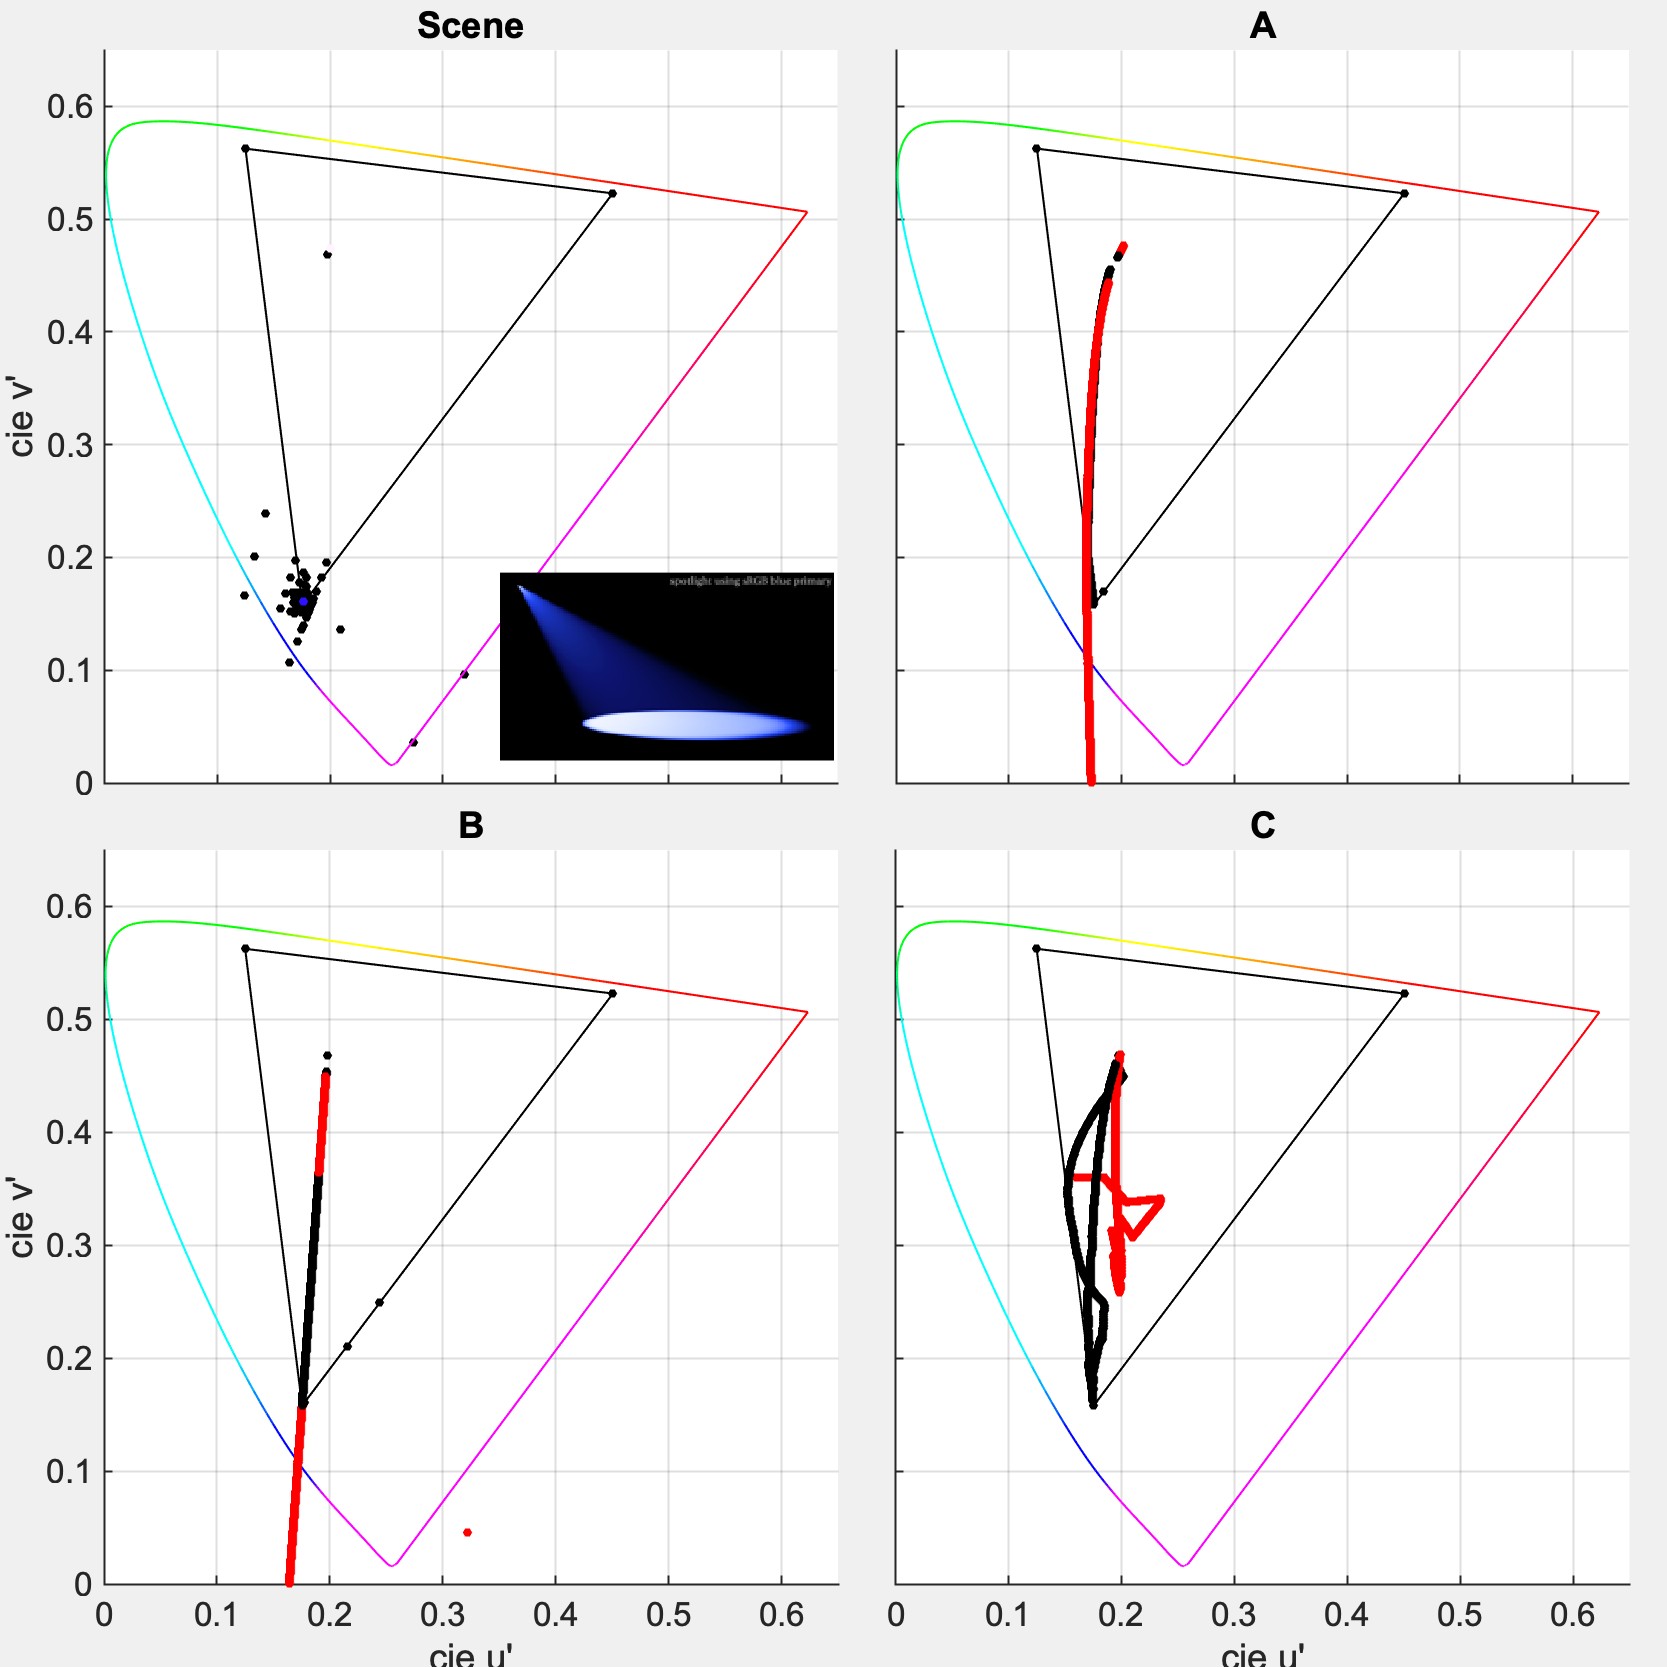
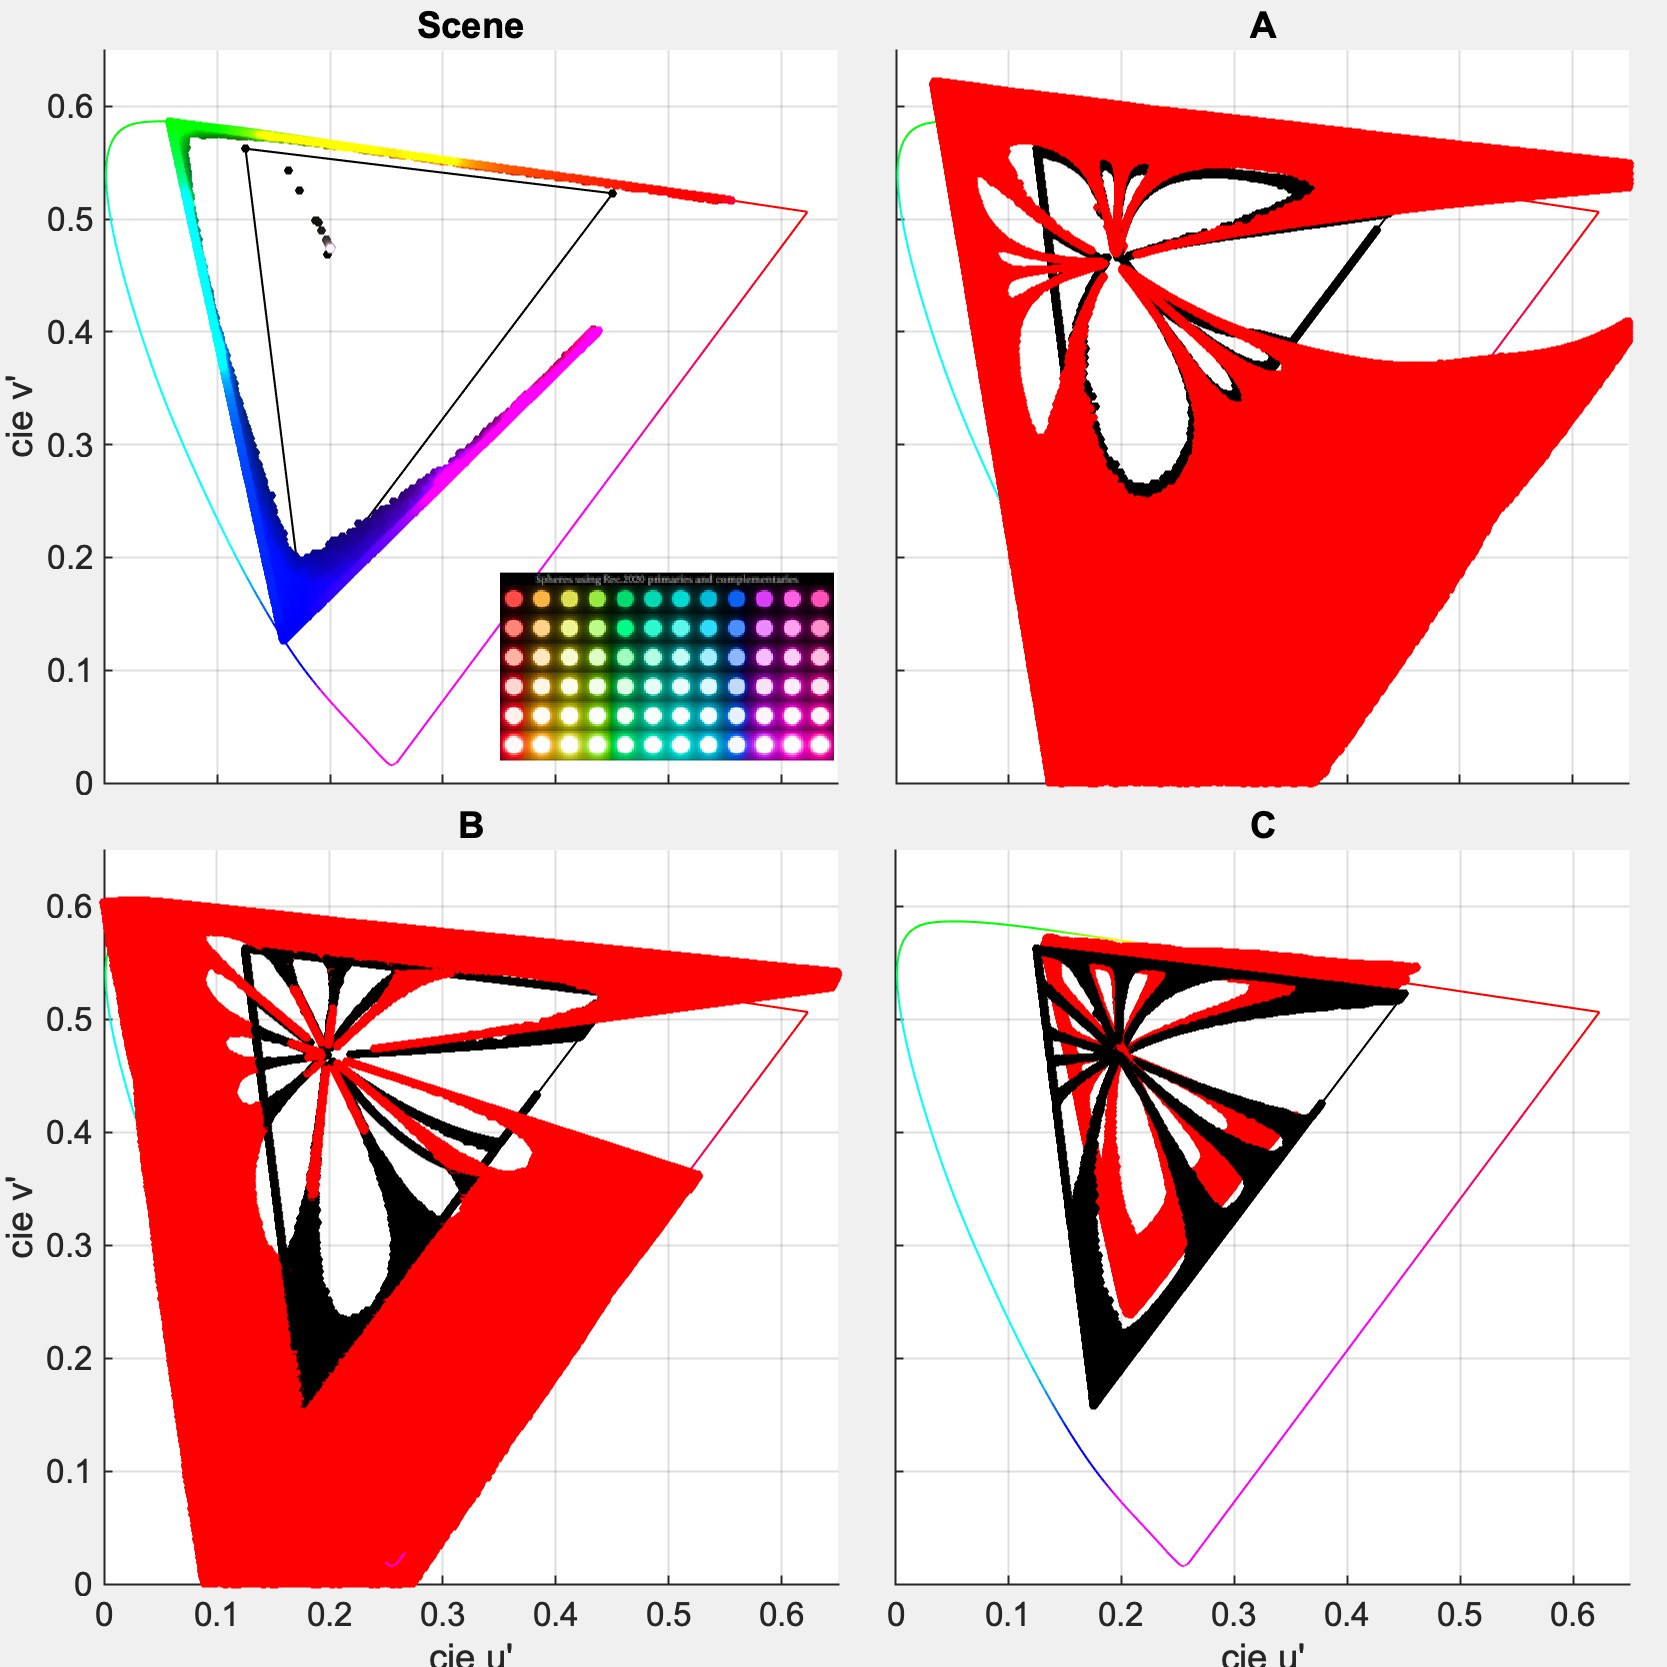
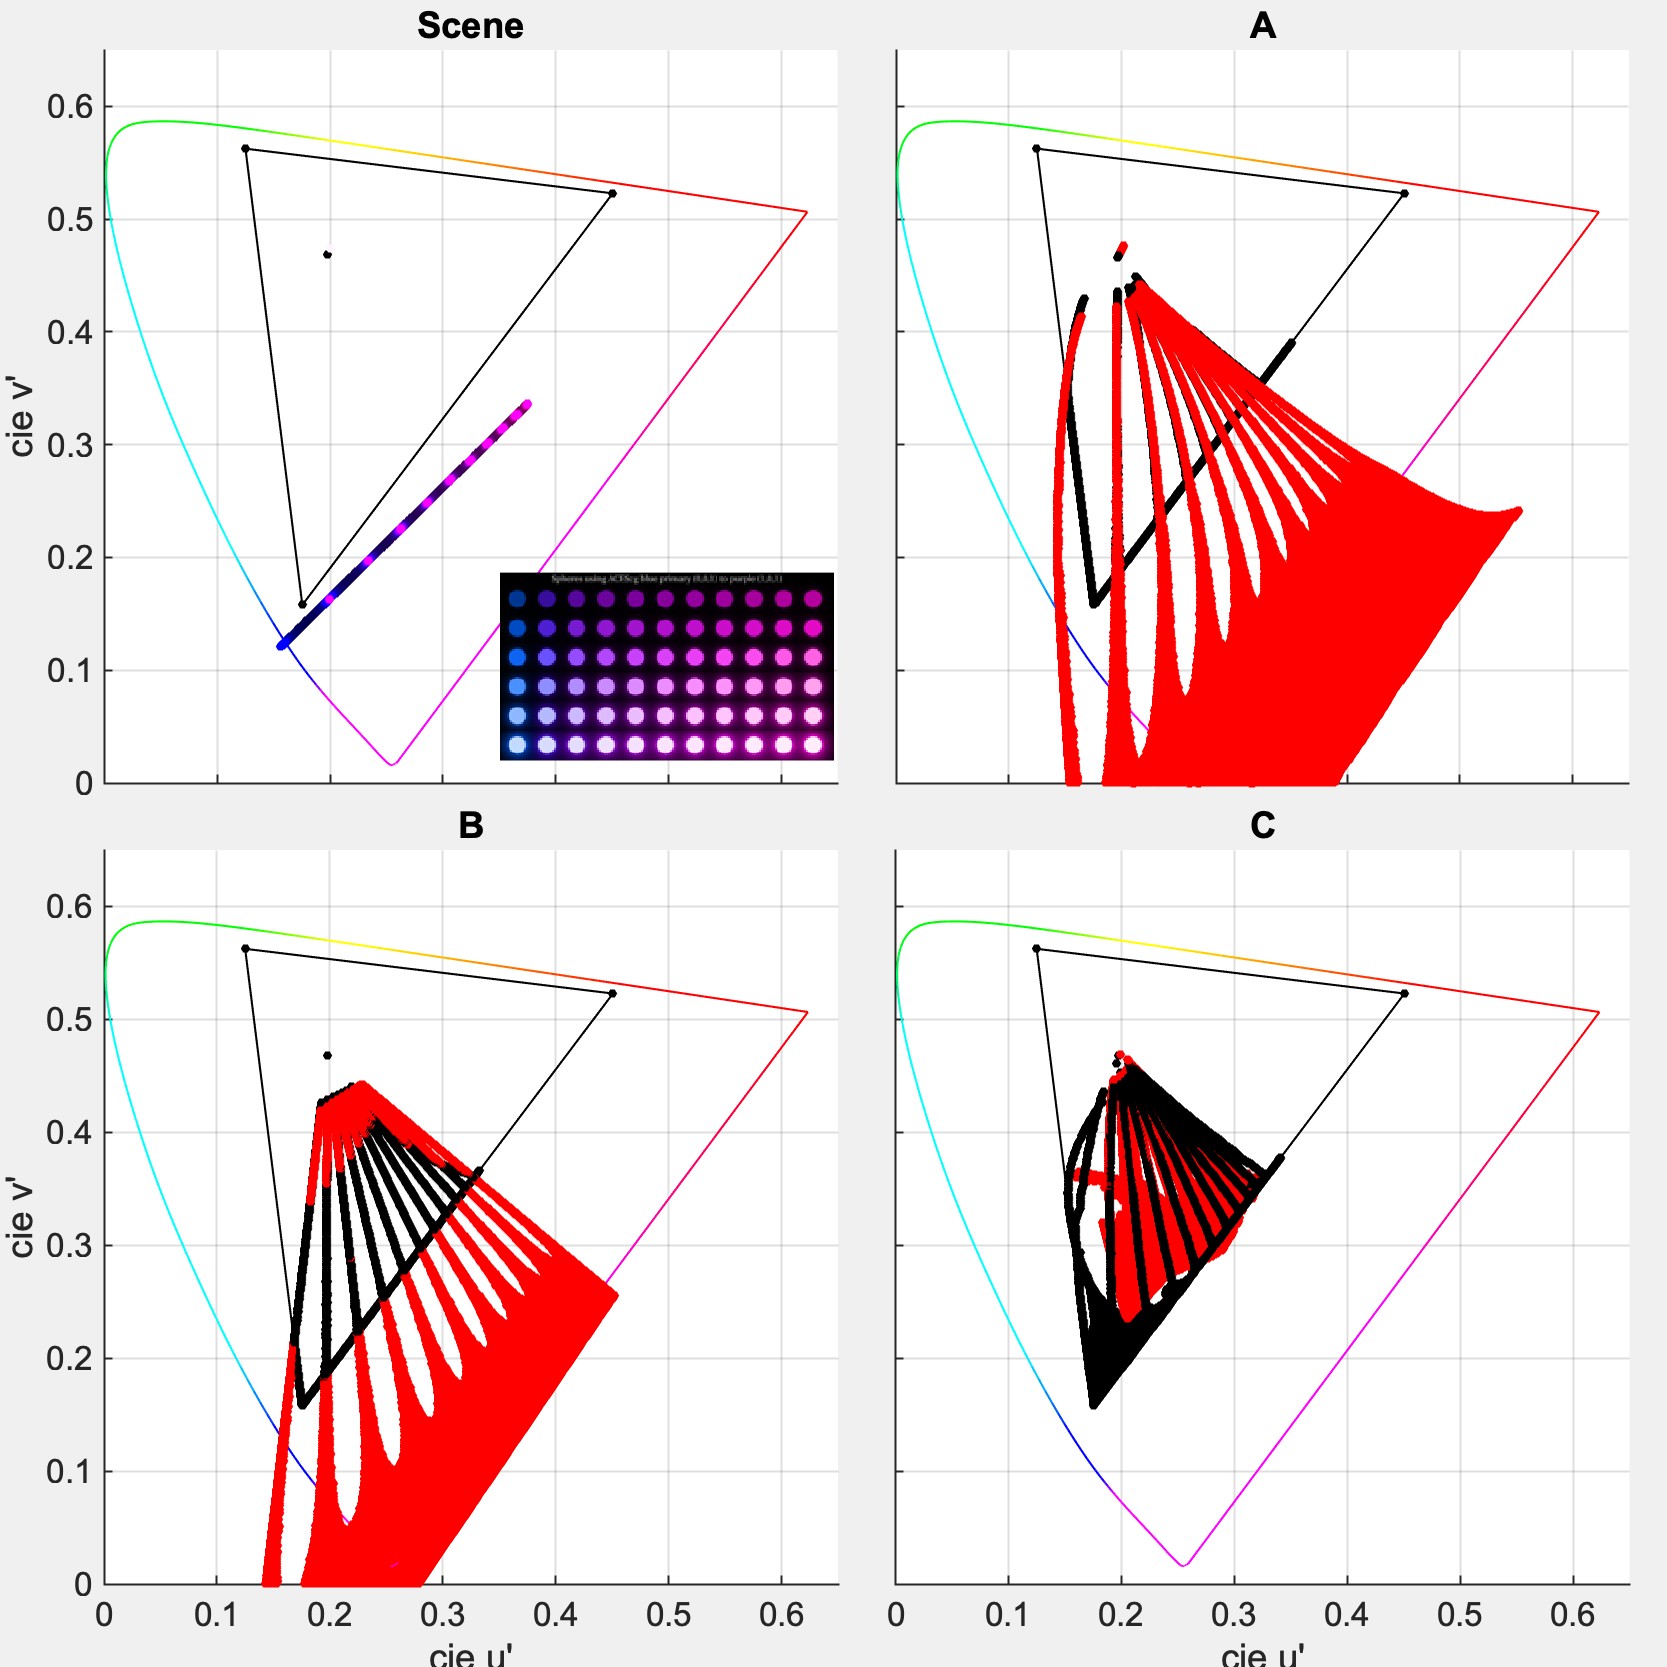
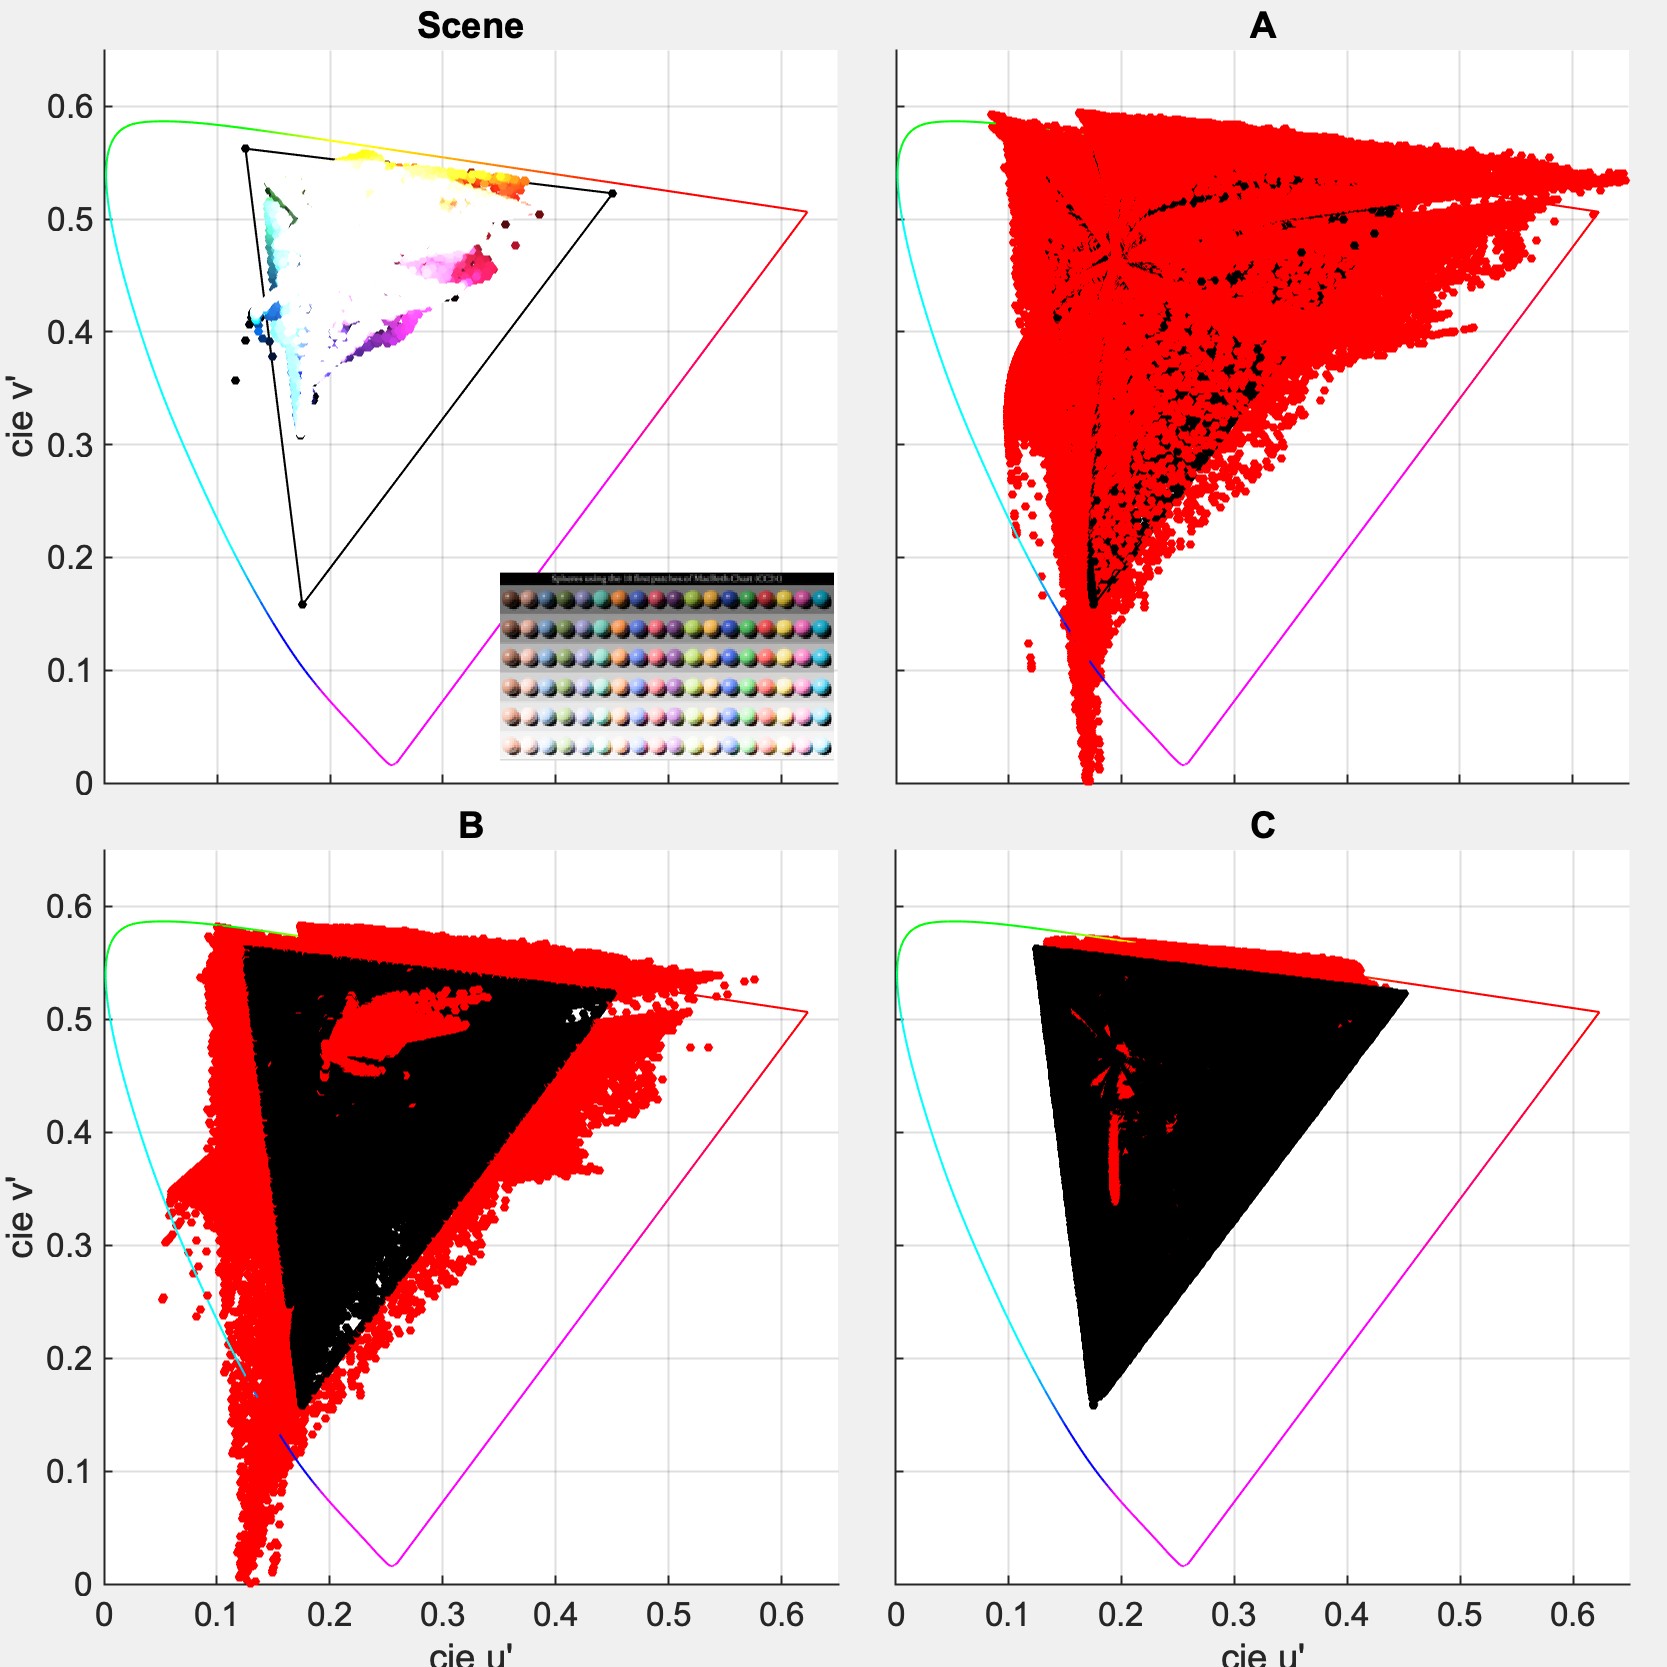
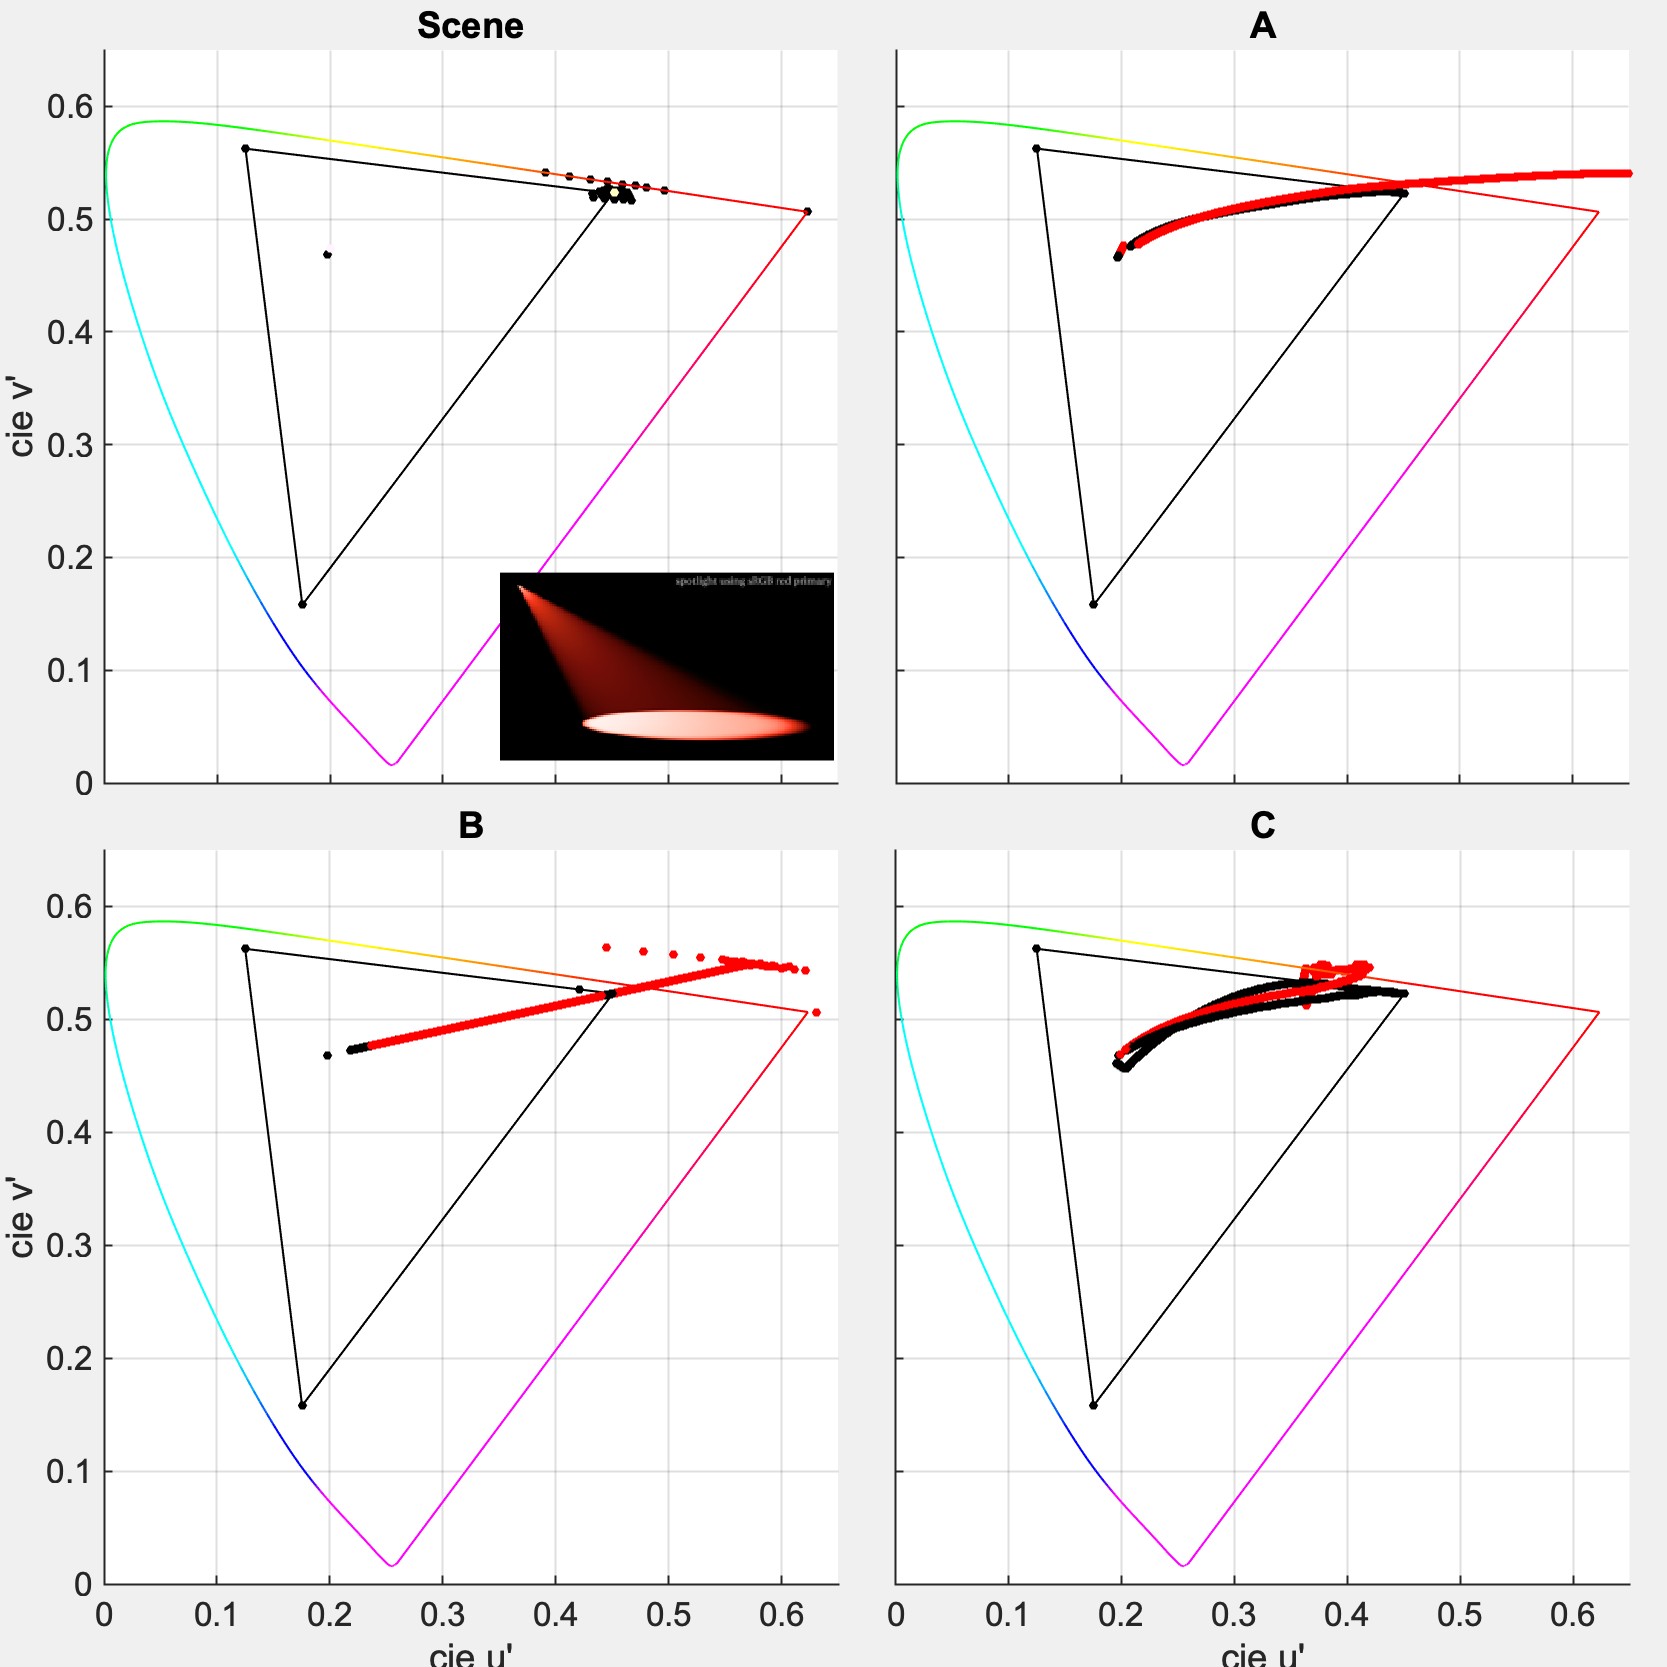
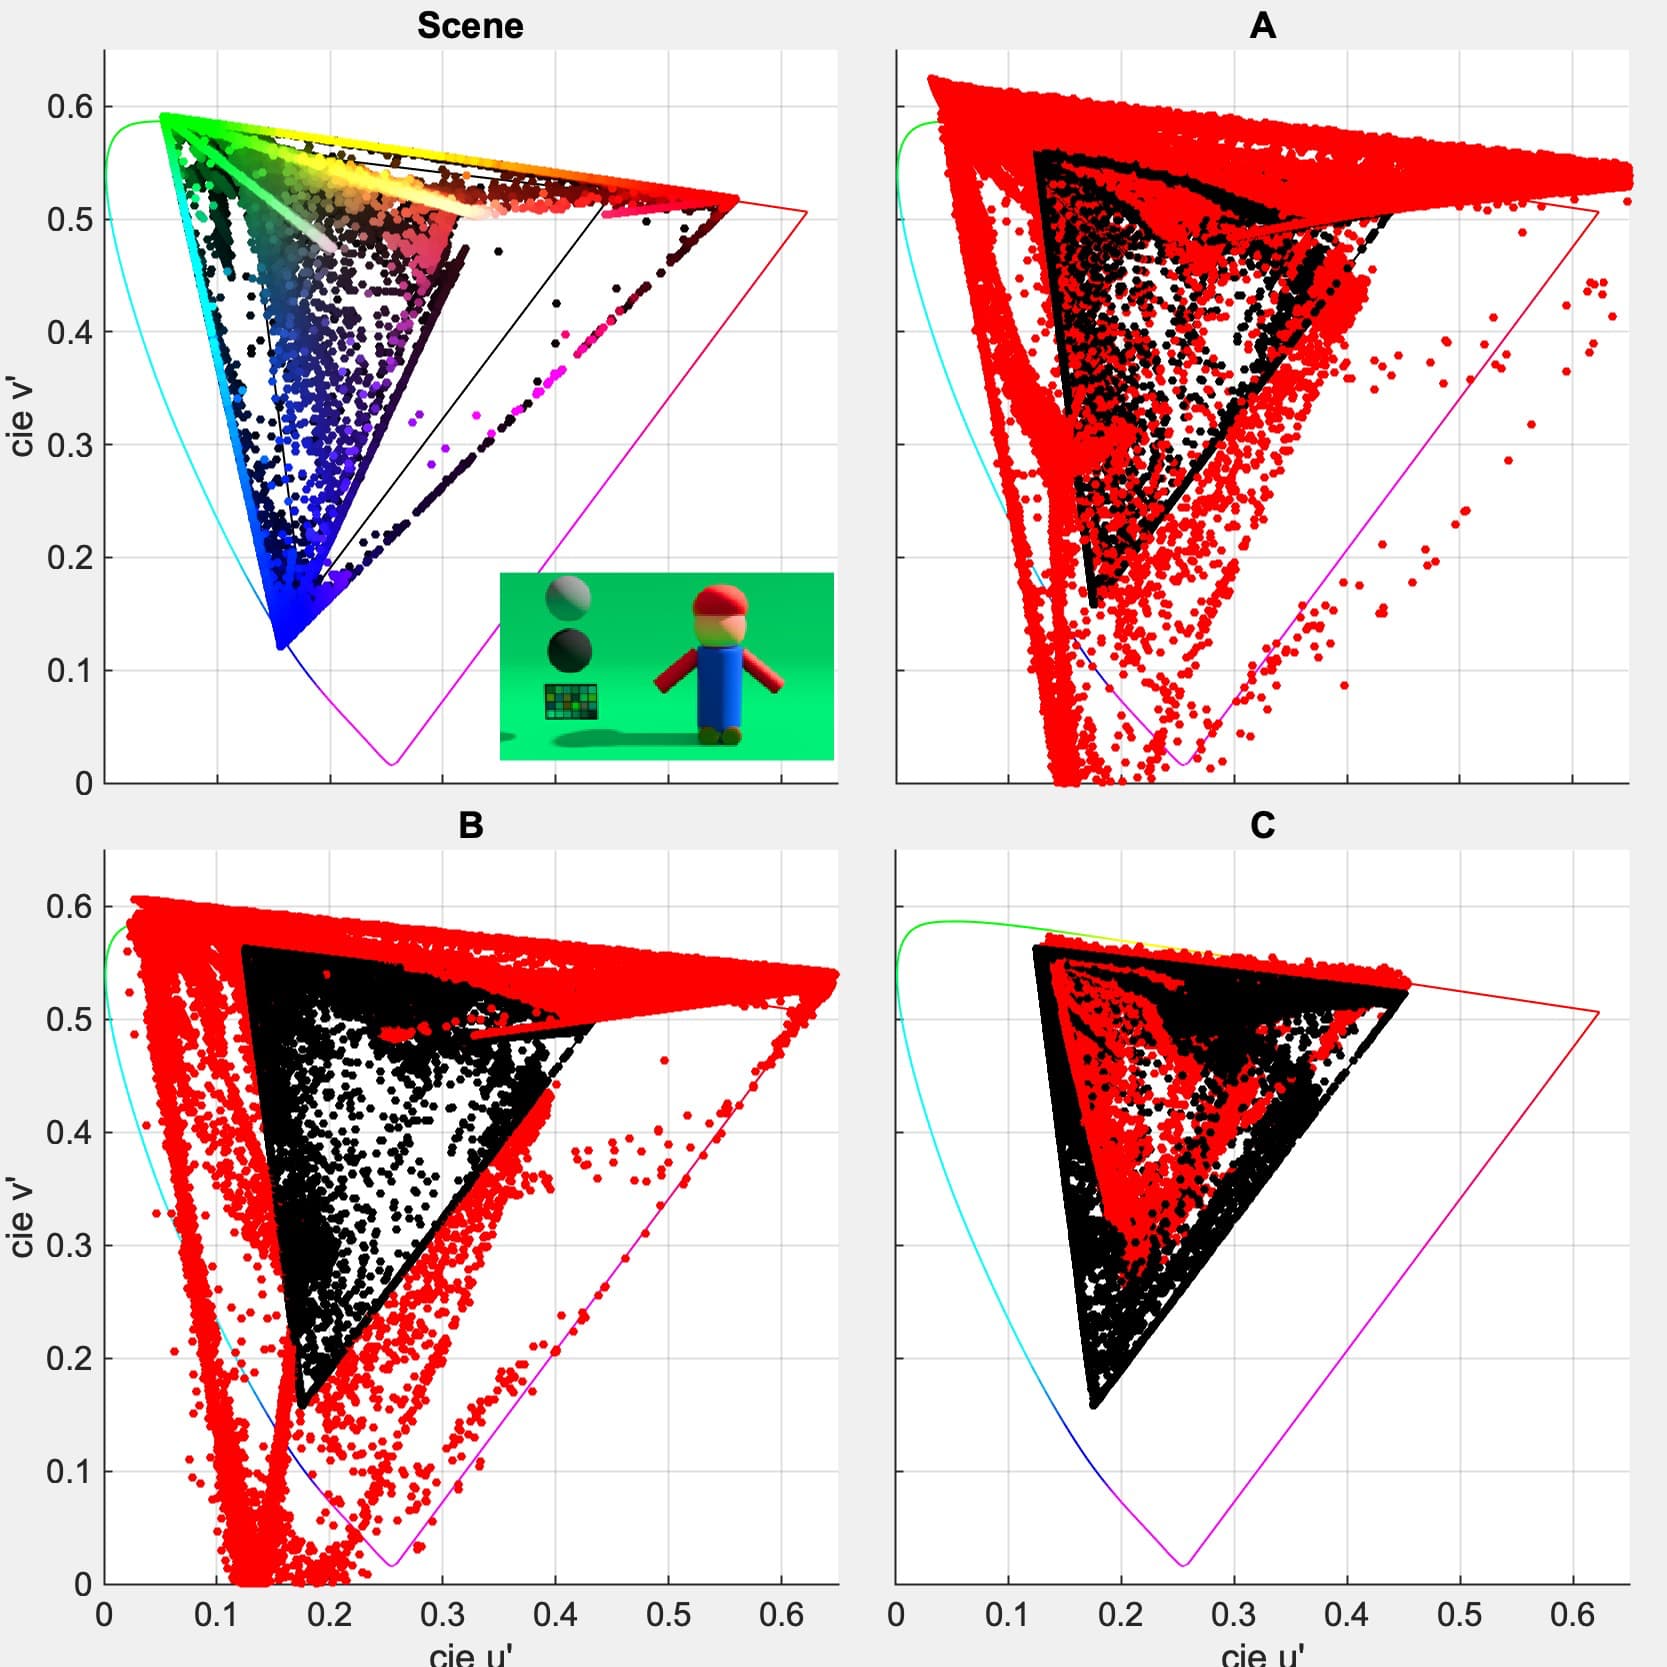
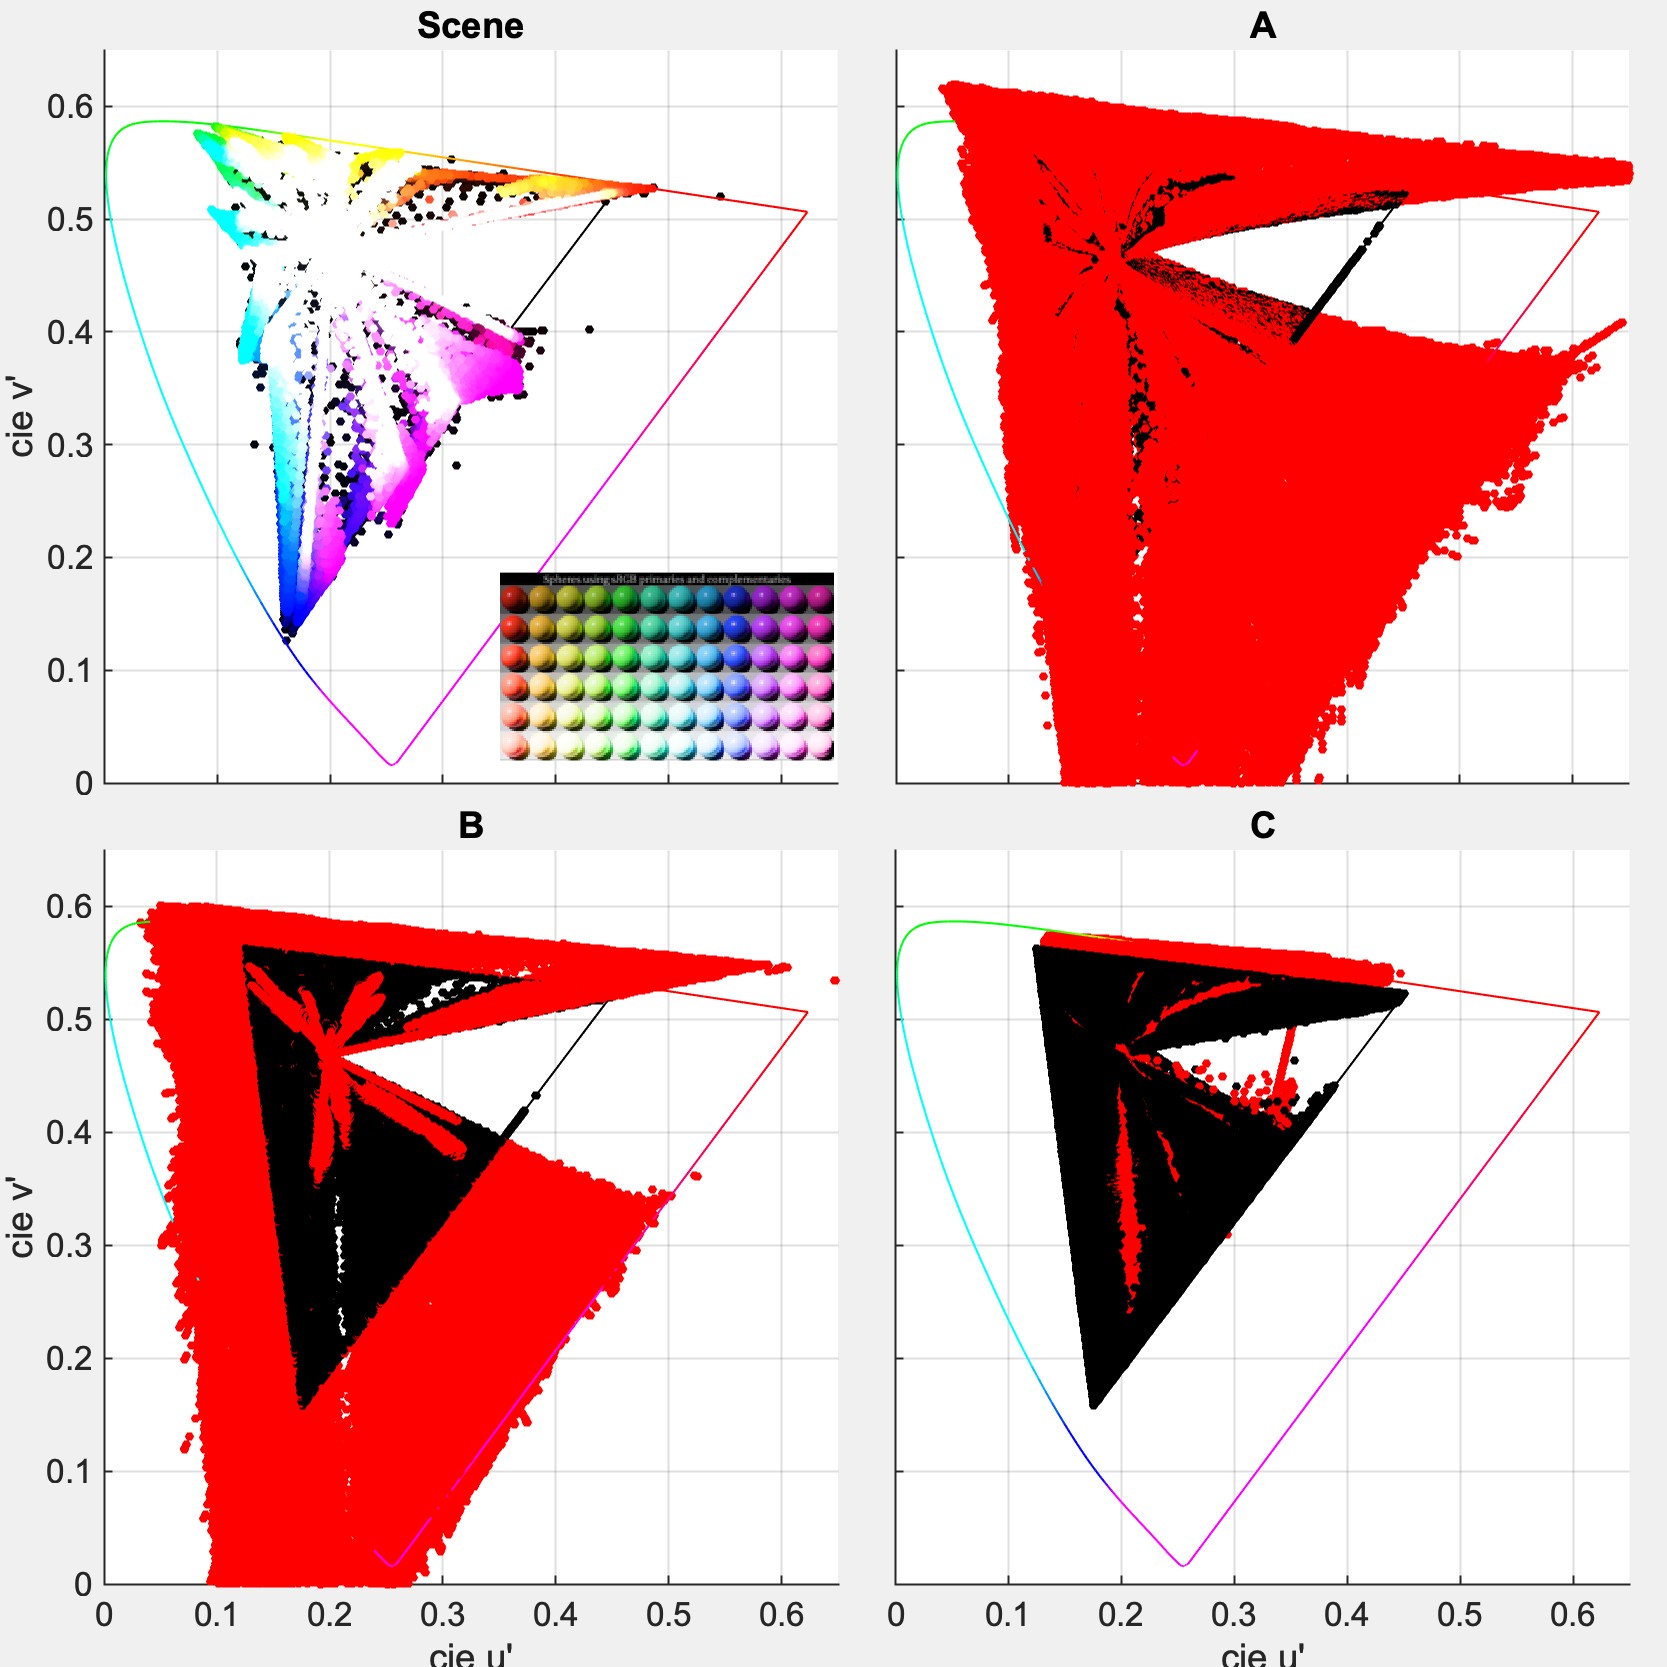
Sorry this took so long, but as promised, here are some comparisons of some of the blues and reds using the three transforms.
These plots show three things:
- “scene” - the starting scene (ACES) colorimetry; the values post-IDT as encoded in the ACES2065-1 file
- This will be shown in top left quadrant. For some images, only a region of interest was plotted to better show what is going on. A thumbnail with the ROI highlighted in embedded in lower right of this quadrant.
- “display linear” - the scene data as mapped to display colorimetry - i.e. where colors end up post-rendering but pre-display mapping
- For A, B, and C, display linear is represented with \color{red}\text{red} dots.
- “display” - the display linear as it is limited to the output display gamut; this includes any gamut-mapping or lack thereof (i.e. clipping).
- For A, B, and C, display is represented with \color{black}\text{black} dots.
Note: Candidate A and B are being processed through CTL code. Candidate C, for practical reasons, is being processed using LUTs.
Candidate B is shown without the “smart-clip”. I will do a comparison of w/ & w/o smart-clip in a followup post.
I will also add plots for ramps of pure primary/secondaries of AP0, AP1, P3, and sRGB.
Plots
Some of these might need further refinement to better show what is going on.