This is using the recently released Colour 0.3.12 (in which the names of some functions have changed for clarity):
>>> from colour.plotting import plot_RGB_chromaticities_in_chromaticity_diagram_CIE1931
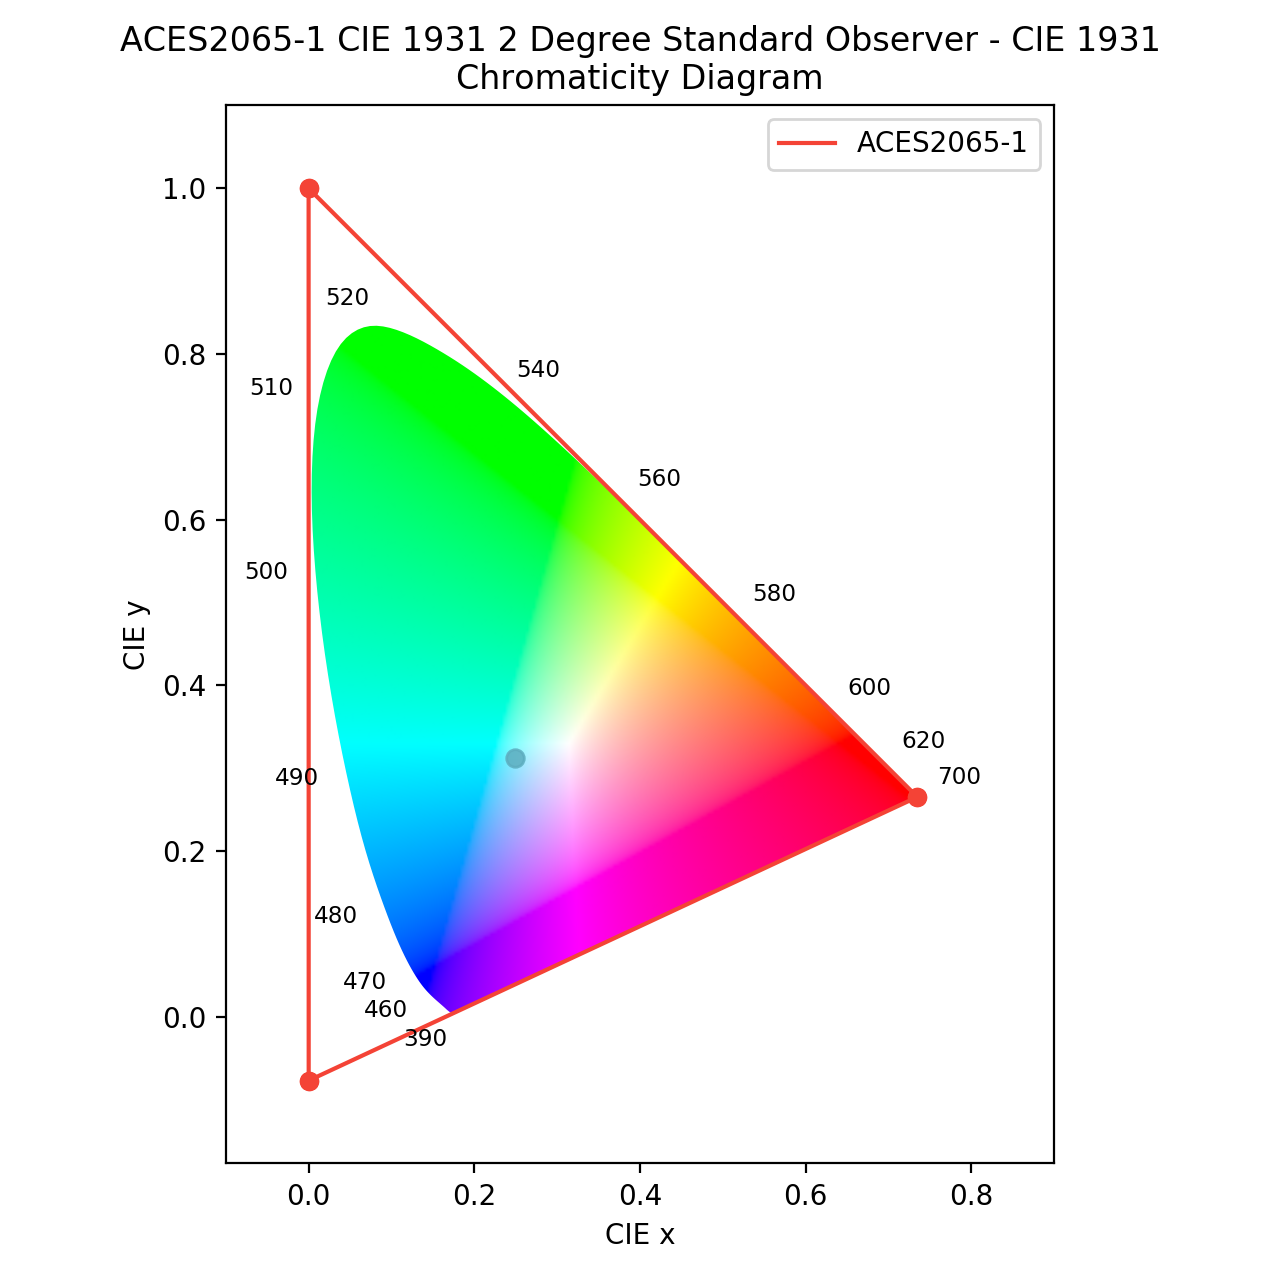
>>> RGB = [0.3, 0.4, 0.5]
>>> plot_RGB_chromaticities_in_chromaticity_diagram_CIE1931(RGB, colourspace='ACES2065-1', show_spectral_locus=False, show_whitepoints=False)
RGB could by a NumPy array of RGB values.
For more info look at:
https://colour.readthedocs.io/en/v0.3.12/generated/colour.plotting.plot_RGB_chromaticities_in_chromaticity_diagram_CIE1931.html