All use the same Michaelis-Menten Spring Dual-Contrast (MMSDC) curve as used in OpenDRT v0.1.2.
All are encoded with sRGB primaries, and the piecewise sRGB EOTF.
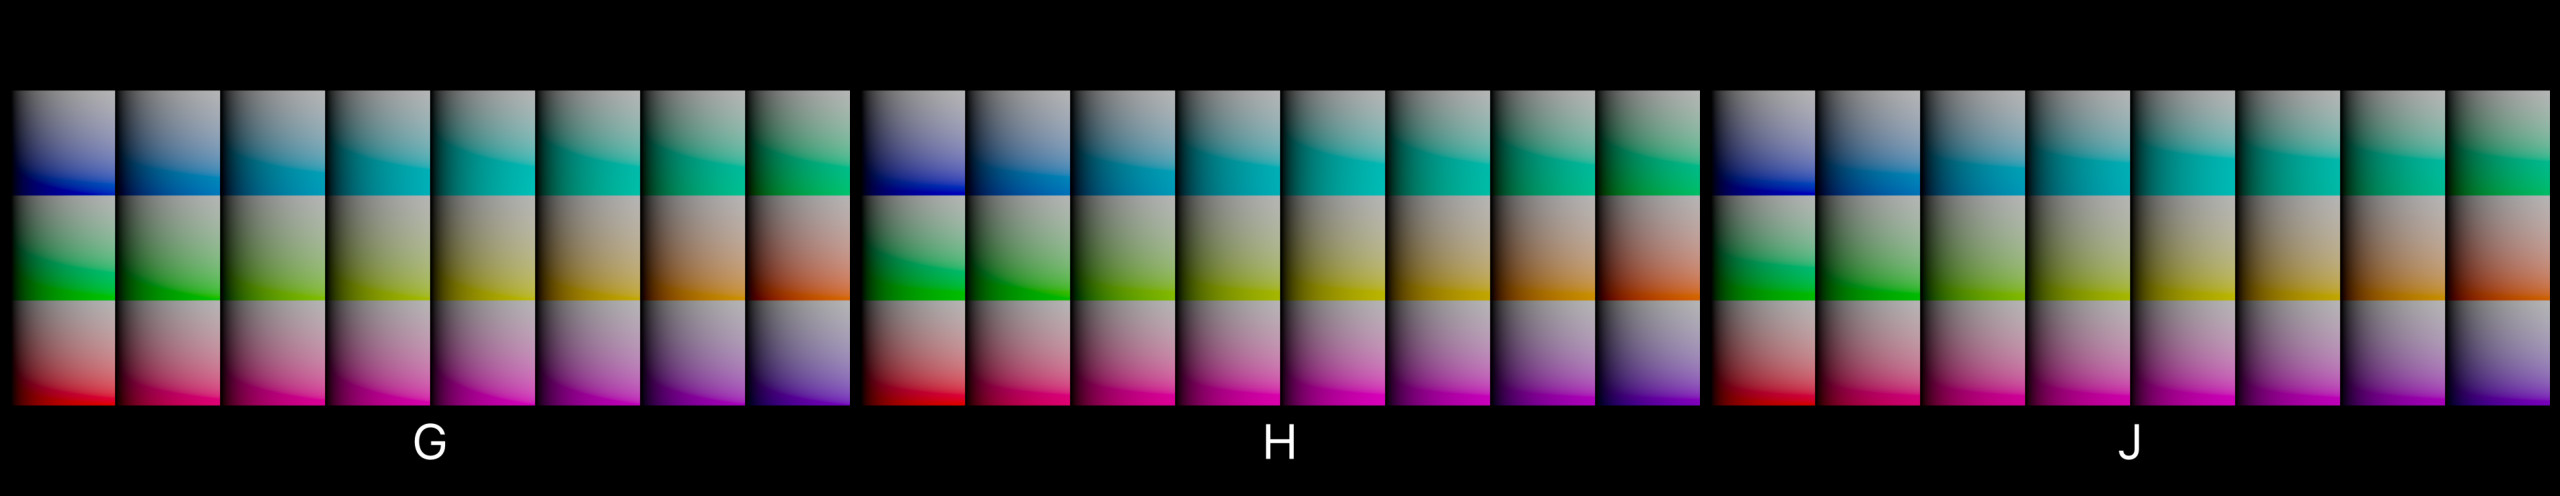
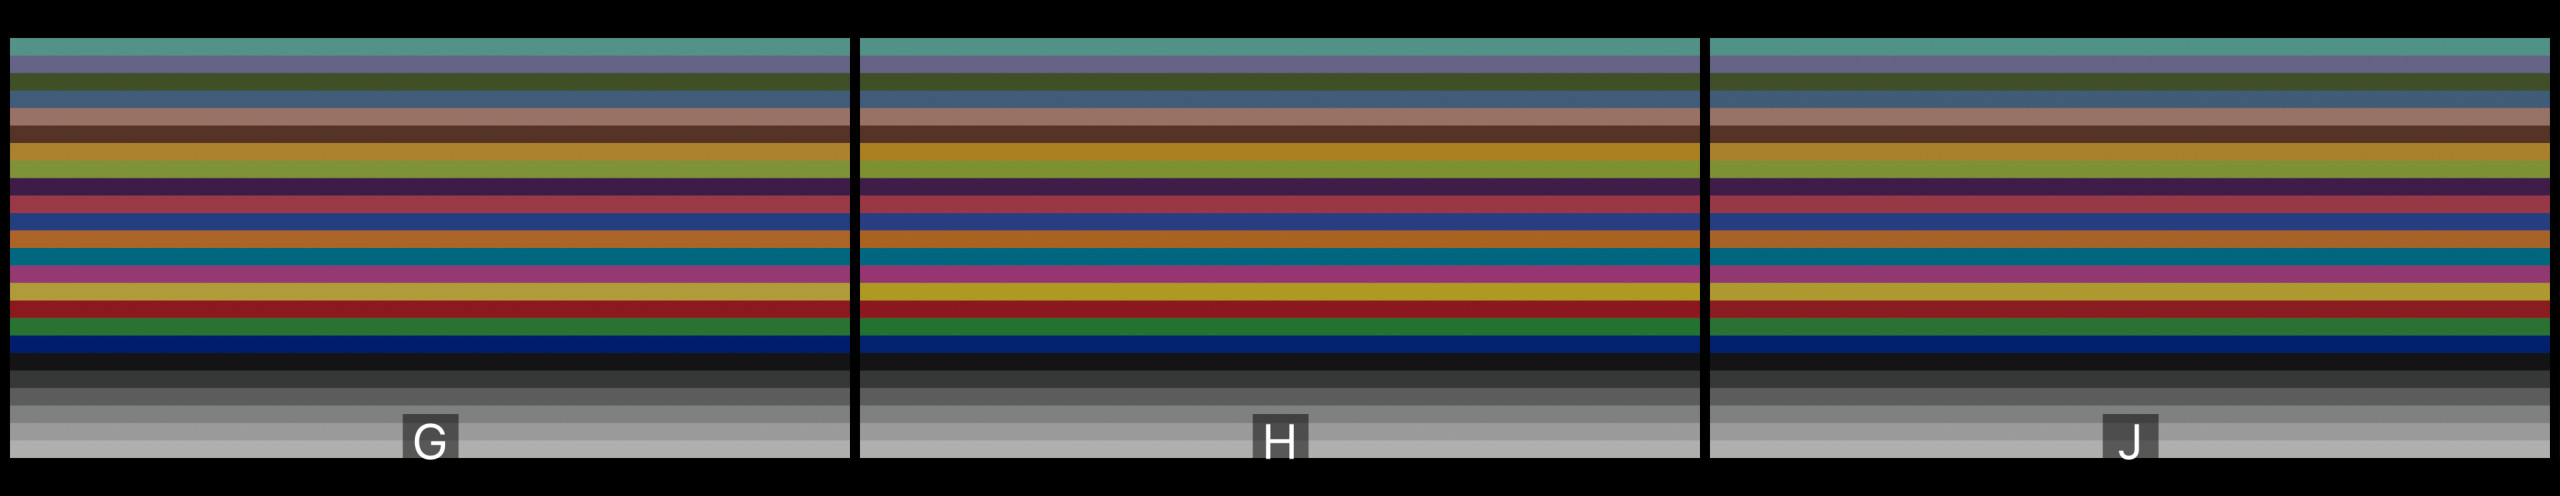
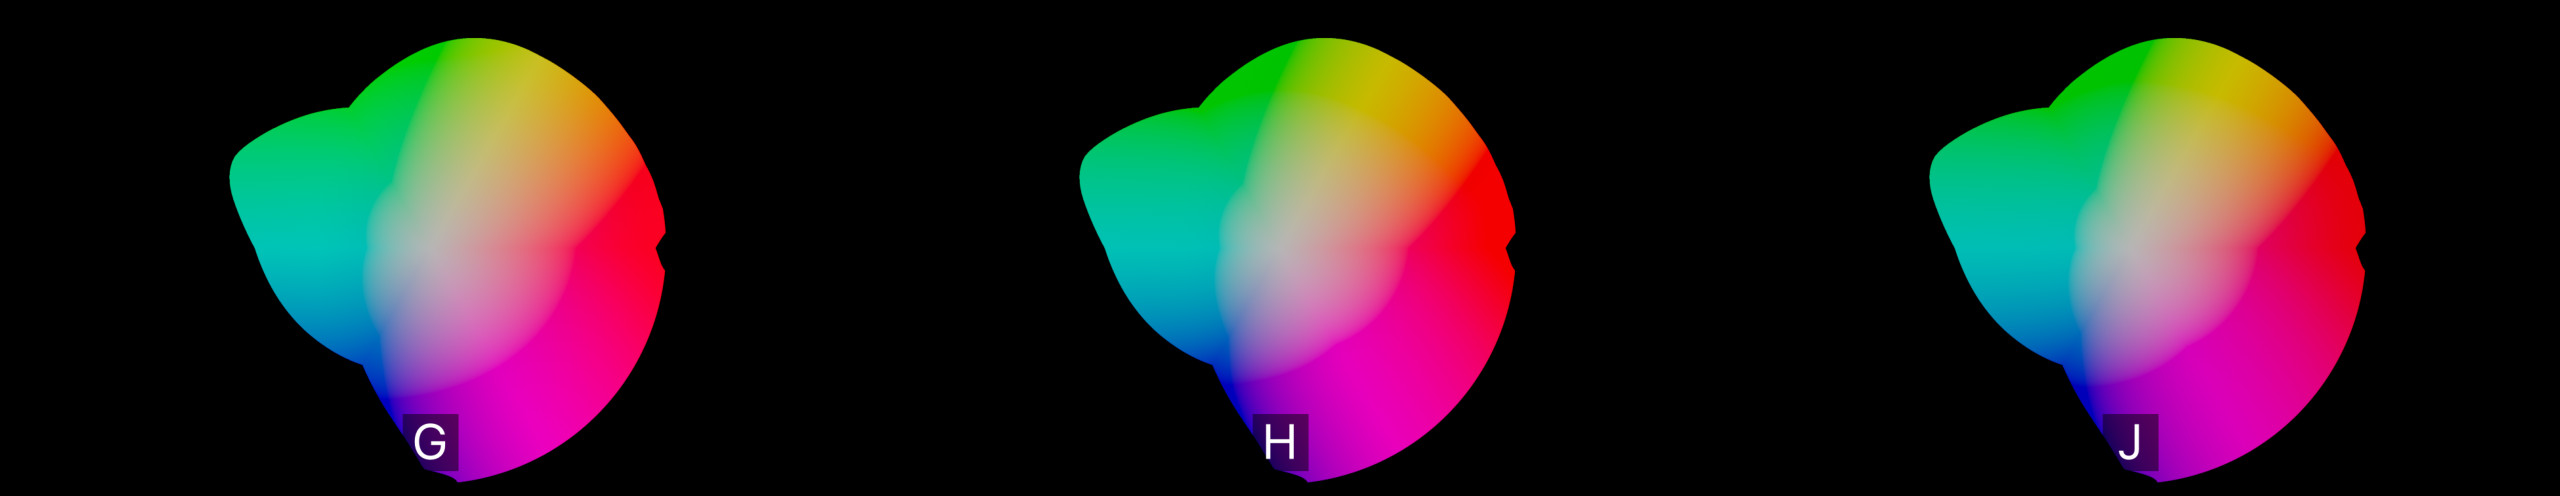
There is some variation in the surrounding nodes, but they’re all fundamentally very similar.
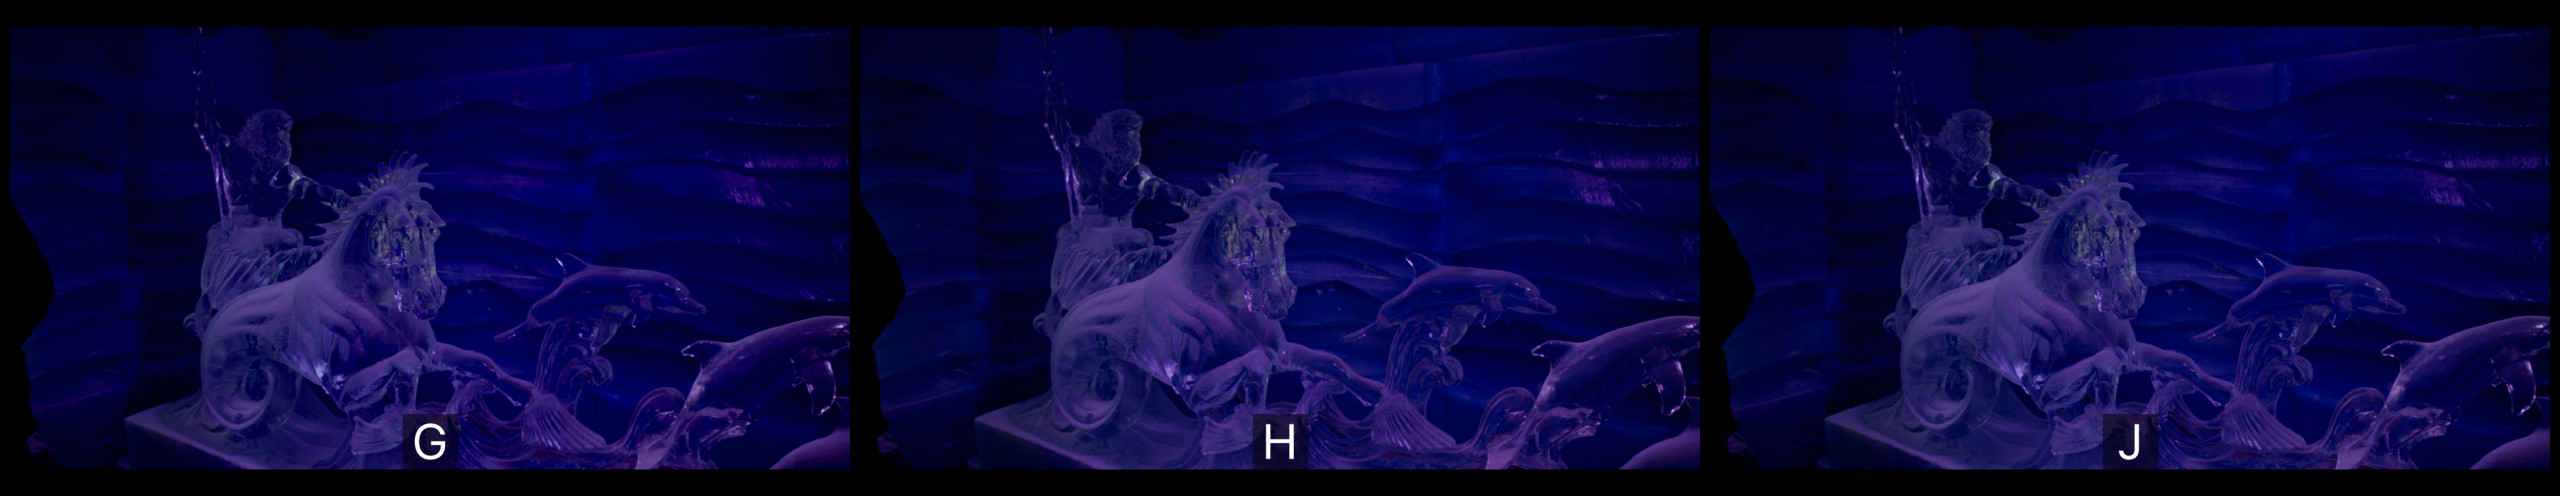
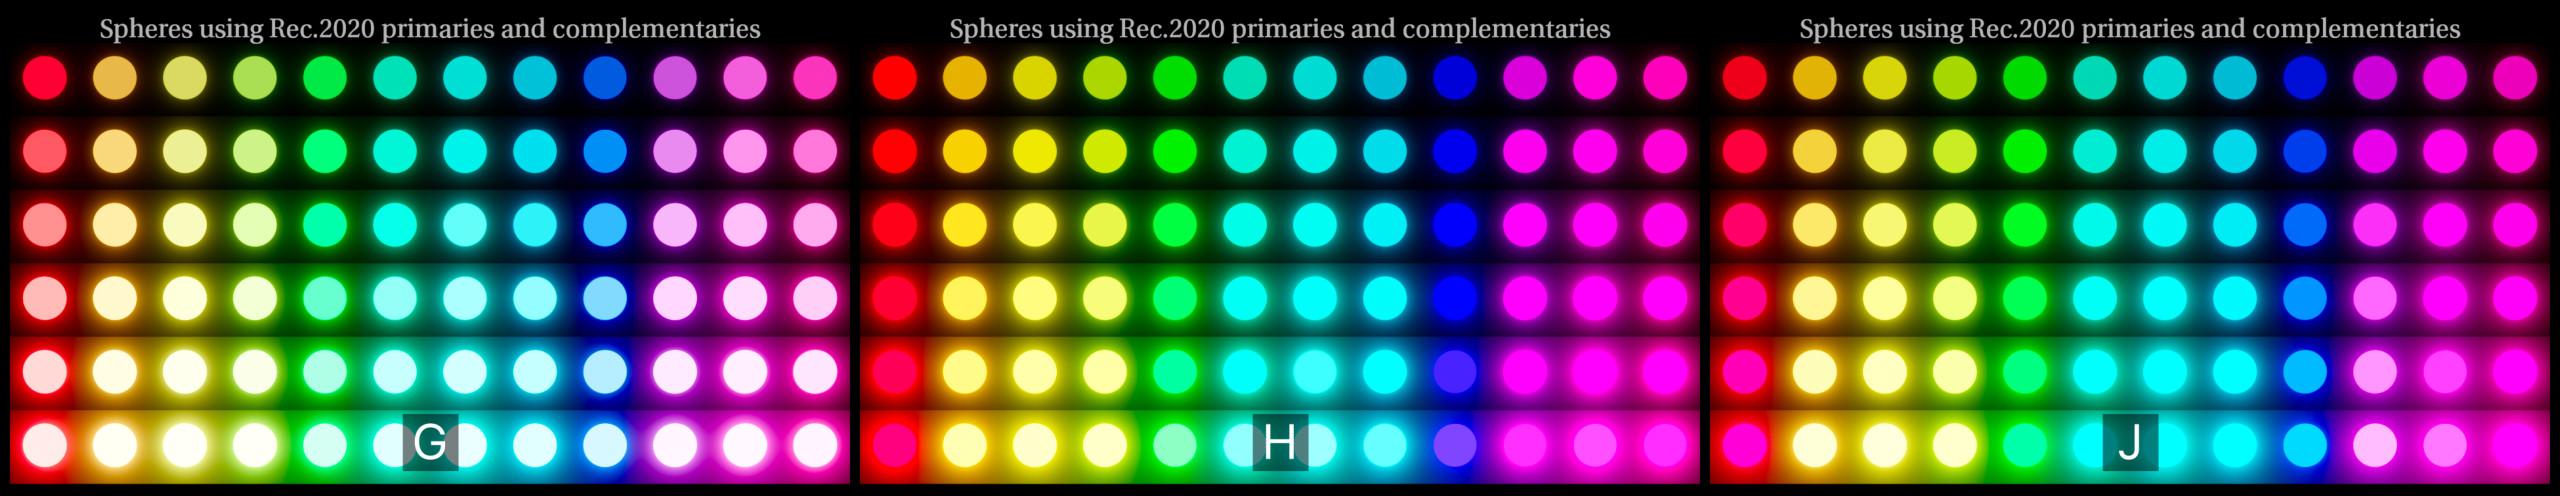
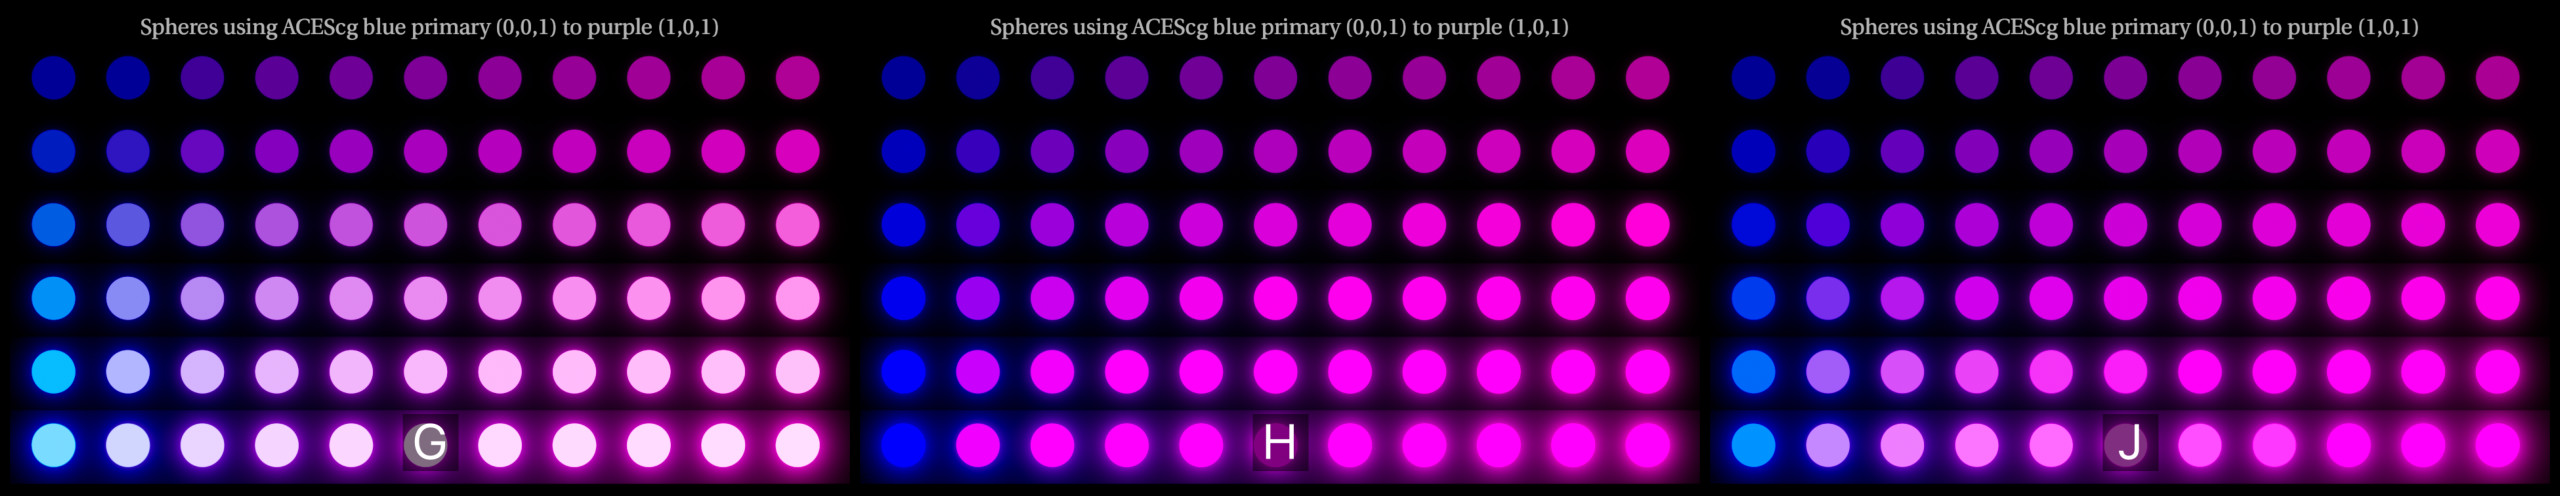
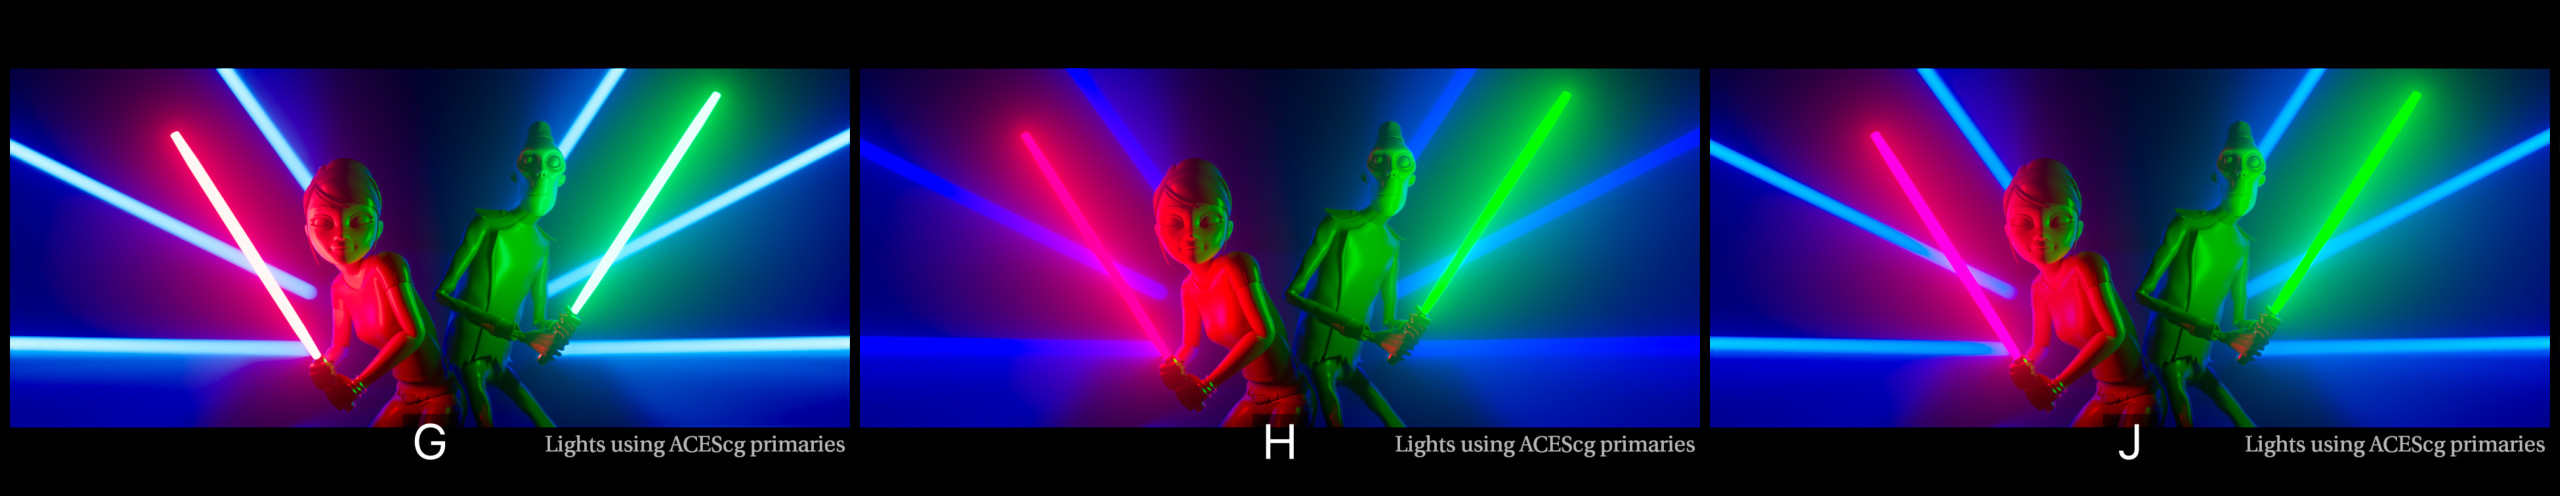
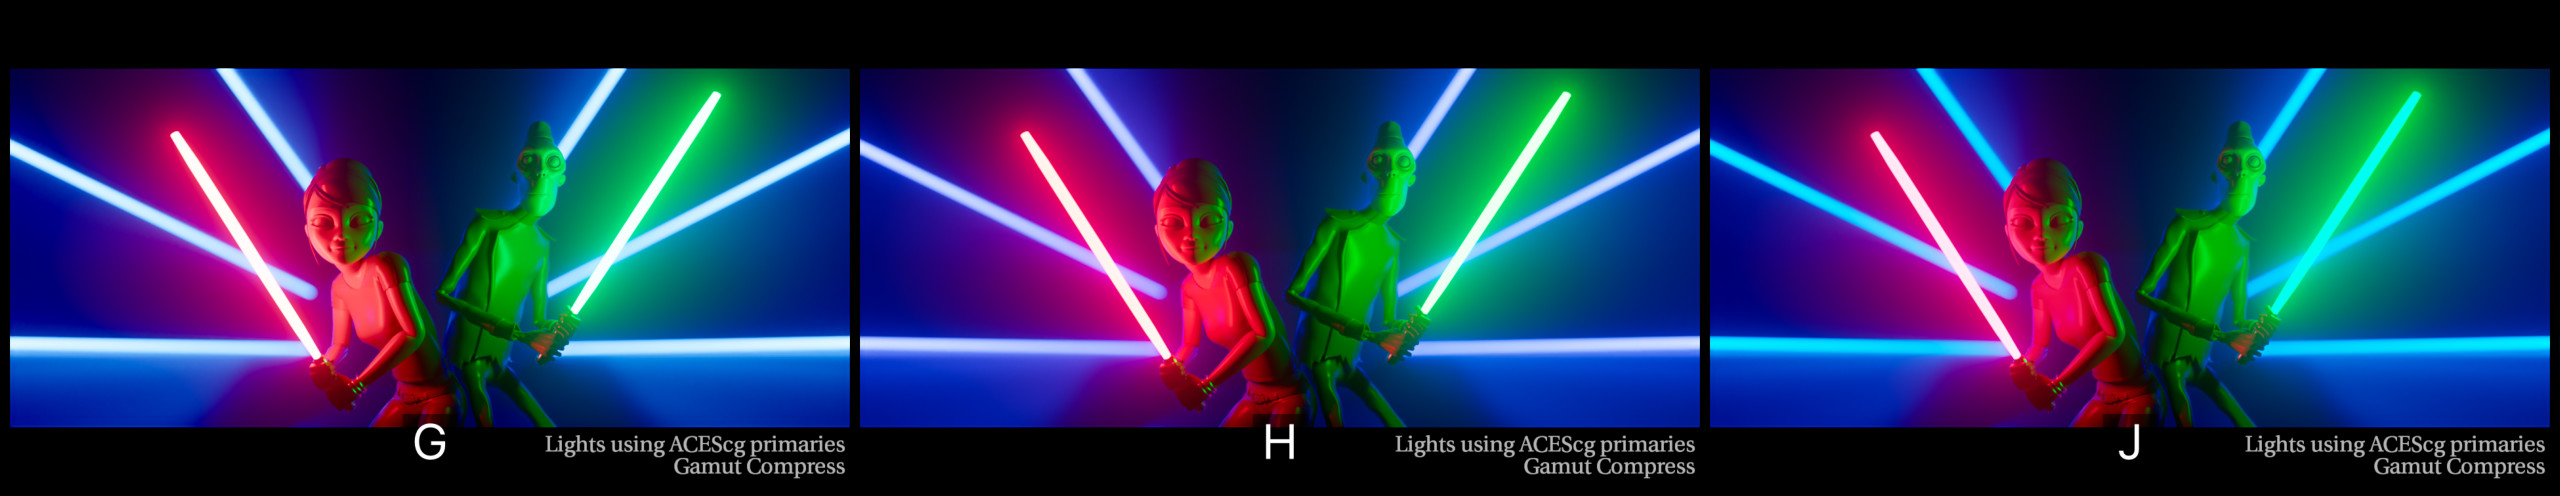
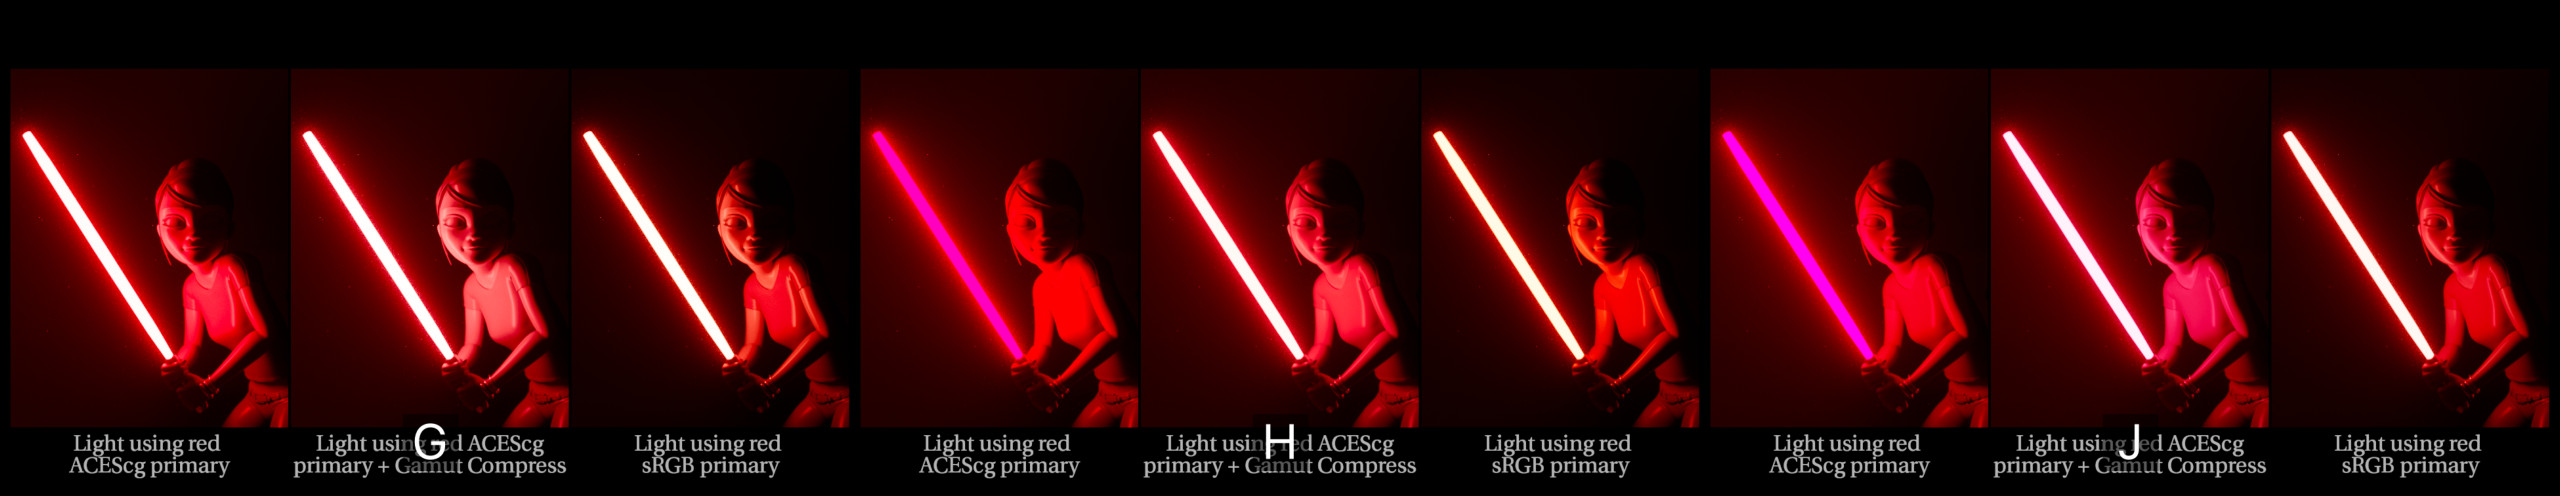
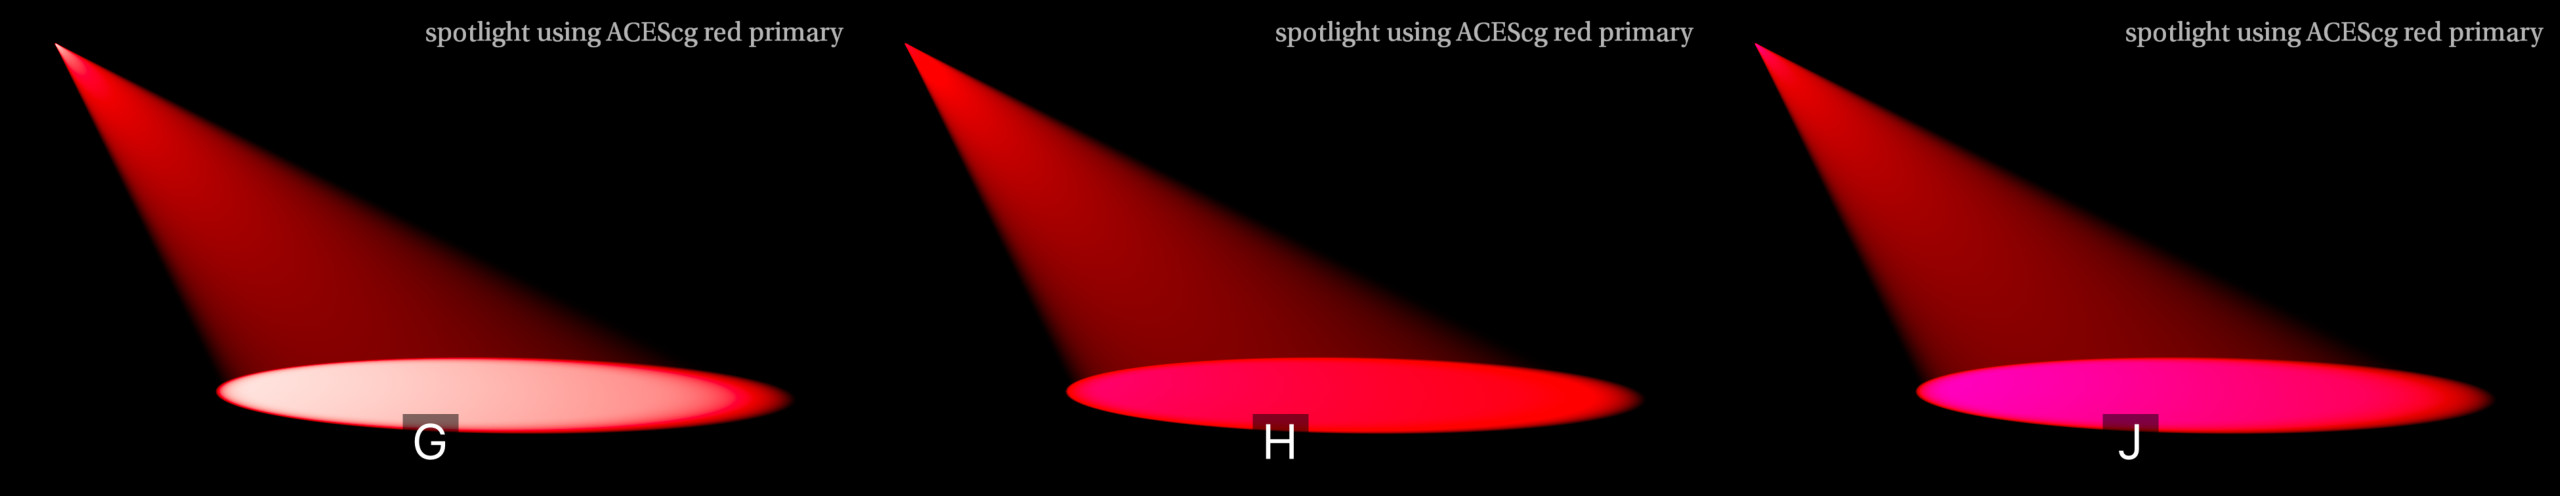
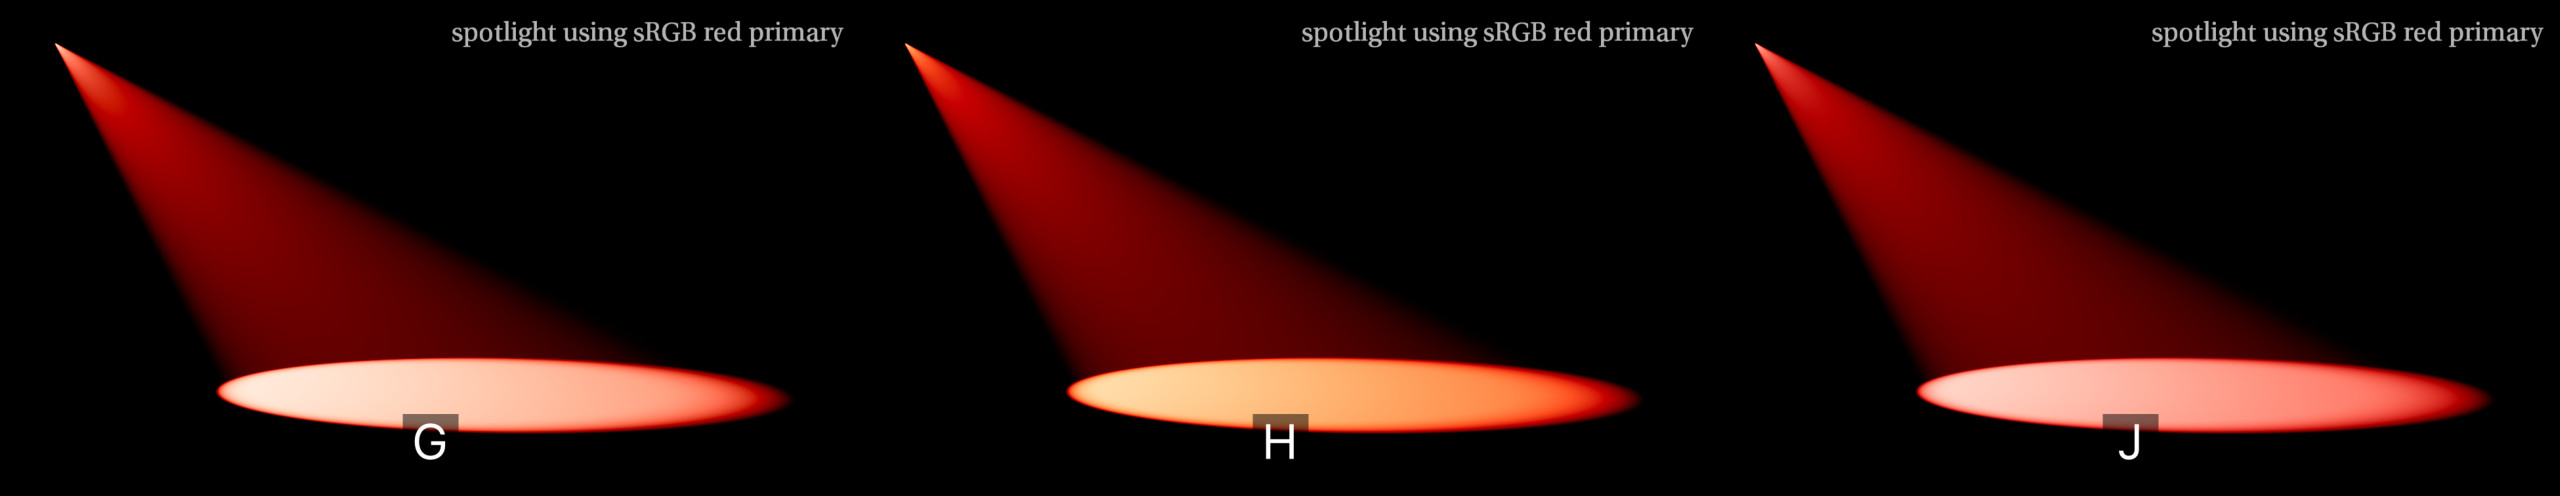
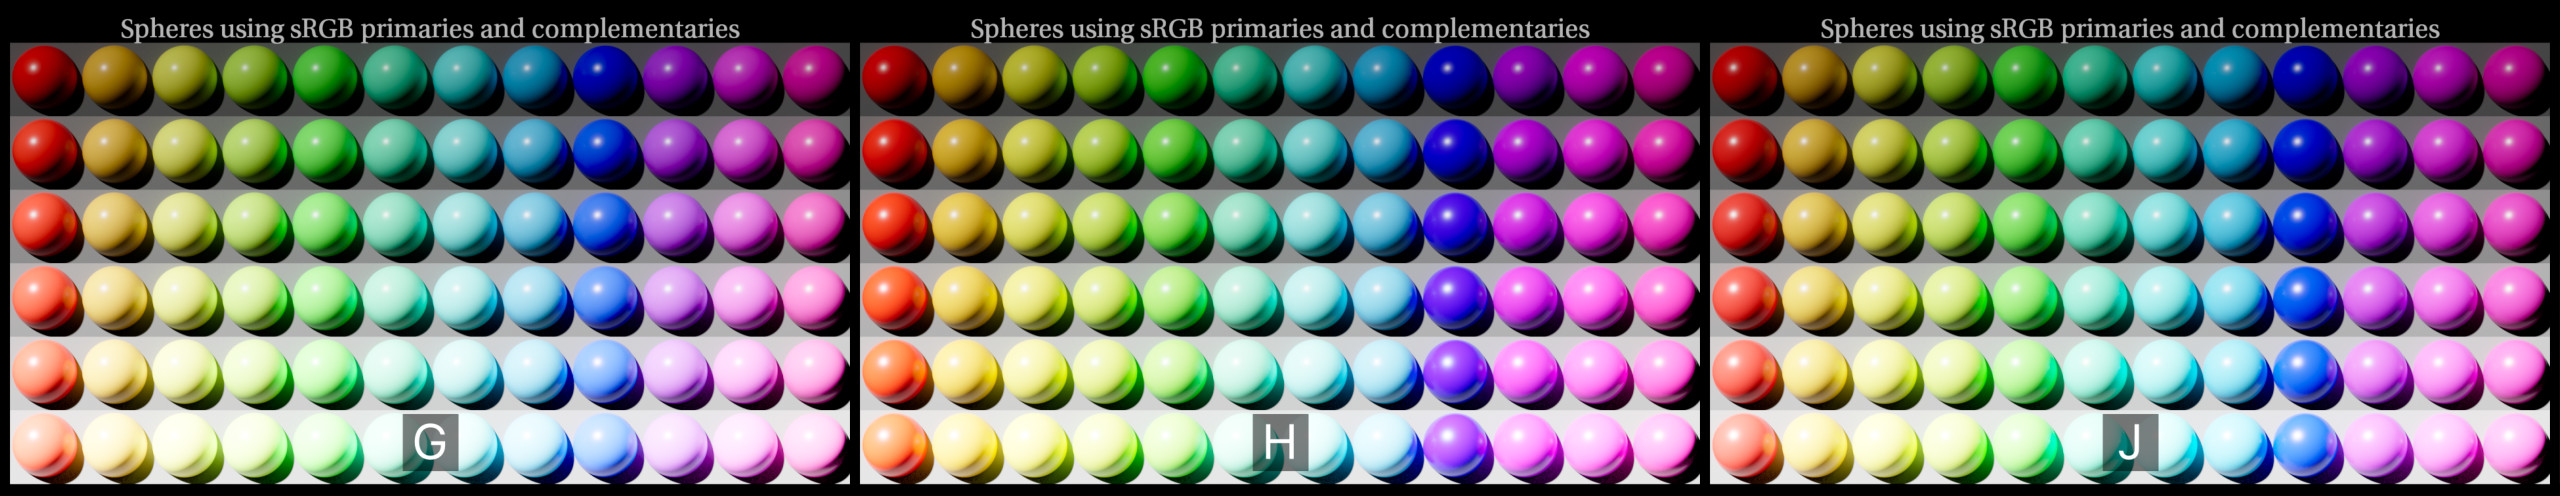
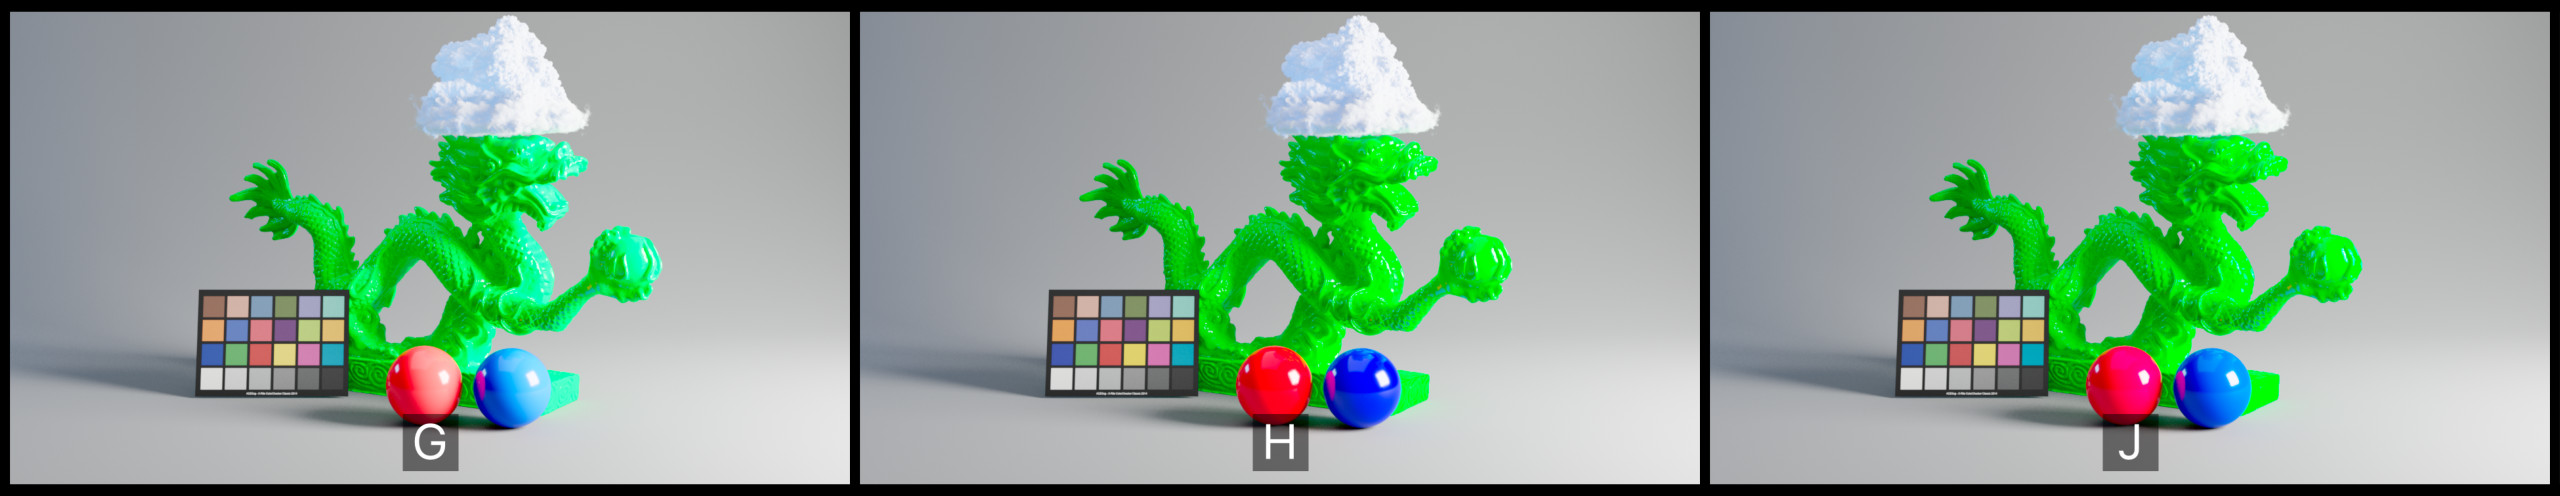
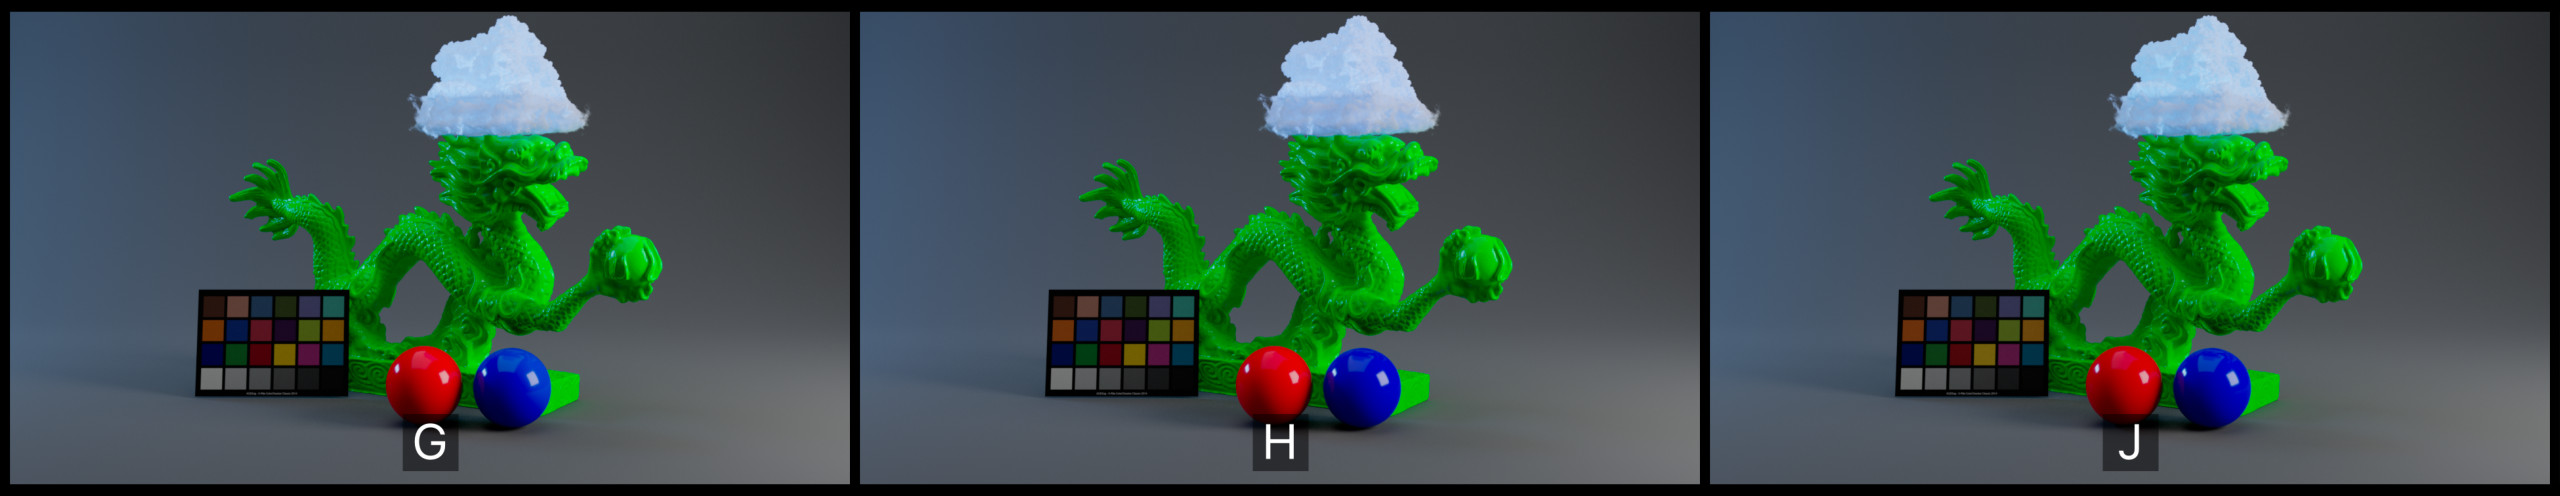
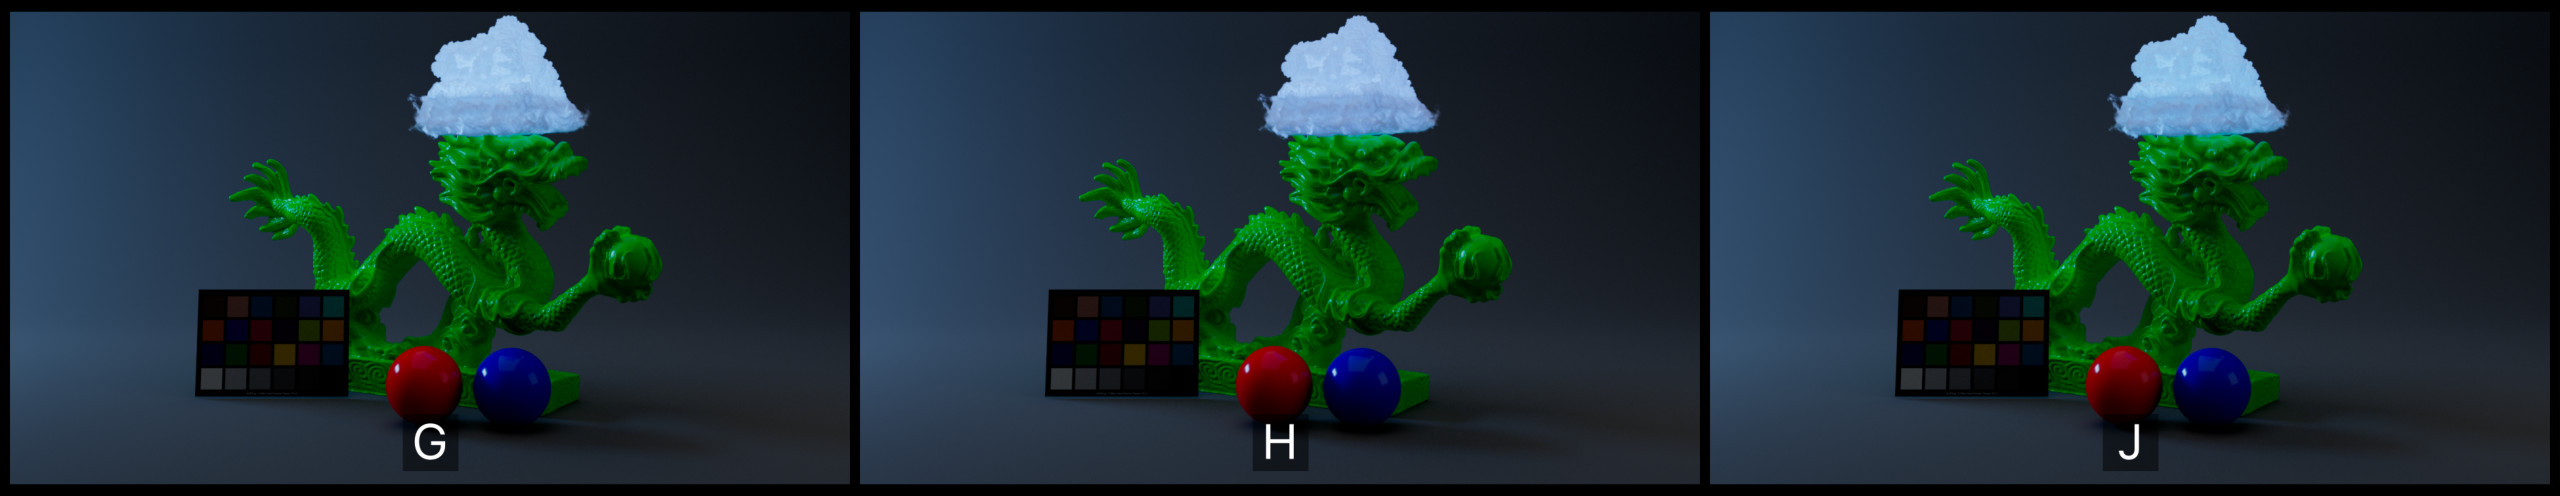
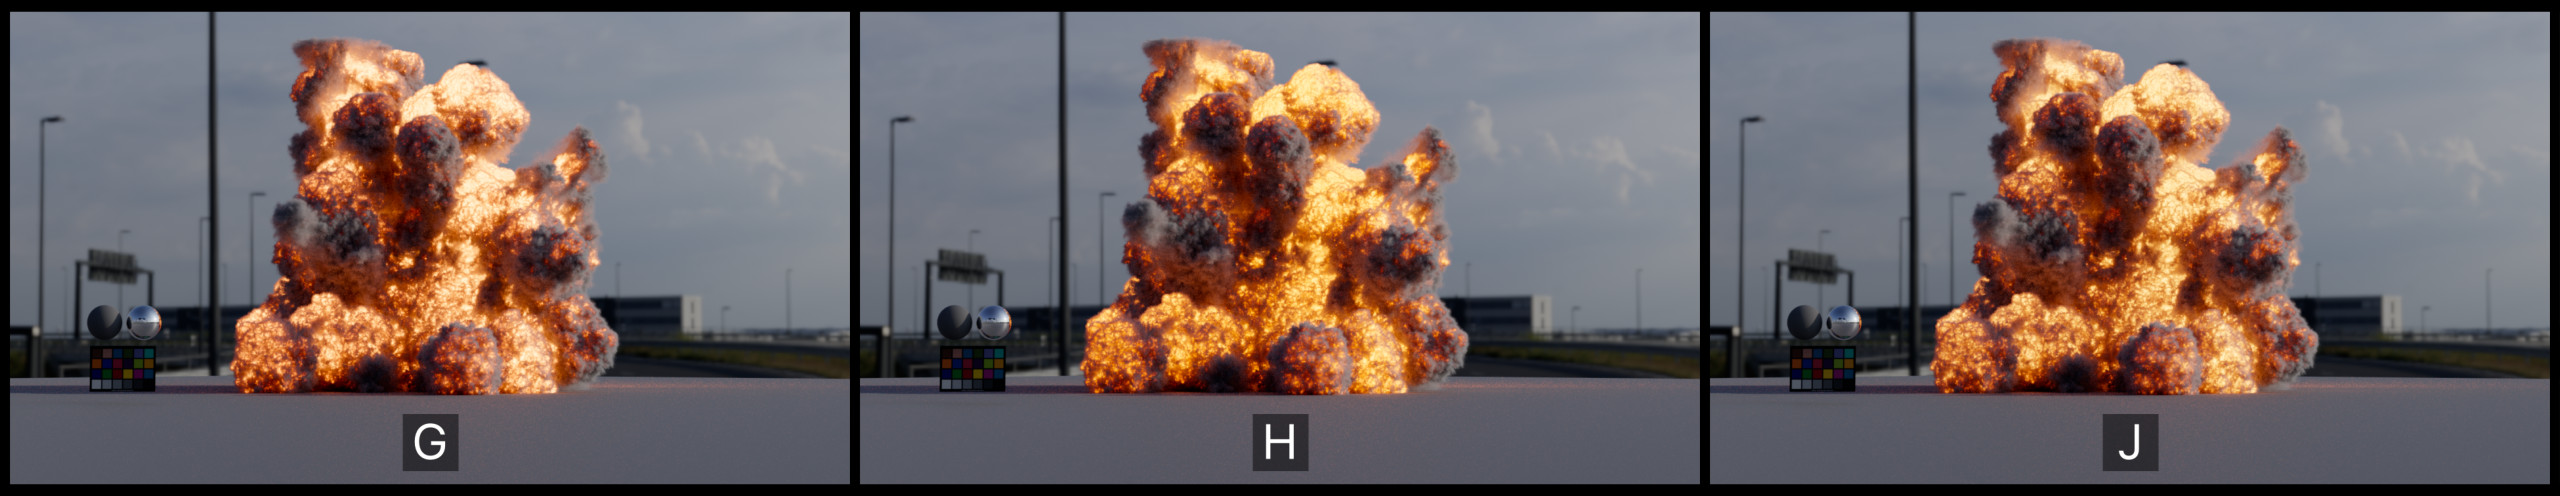
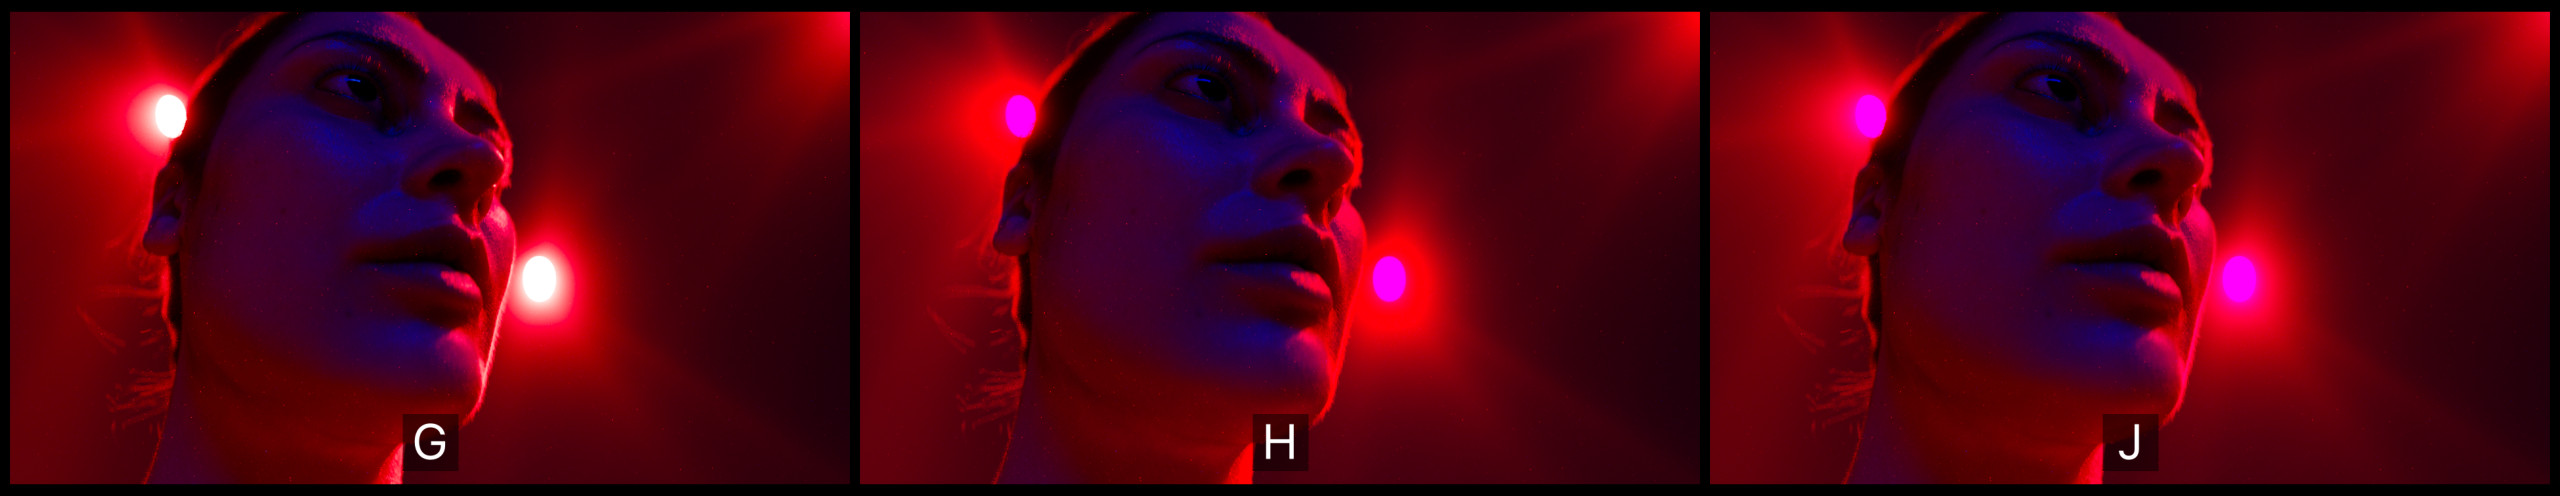
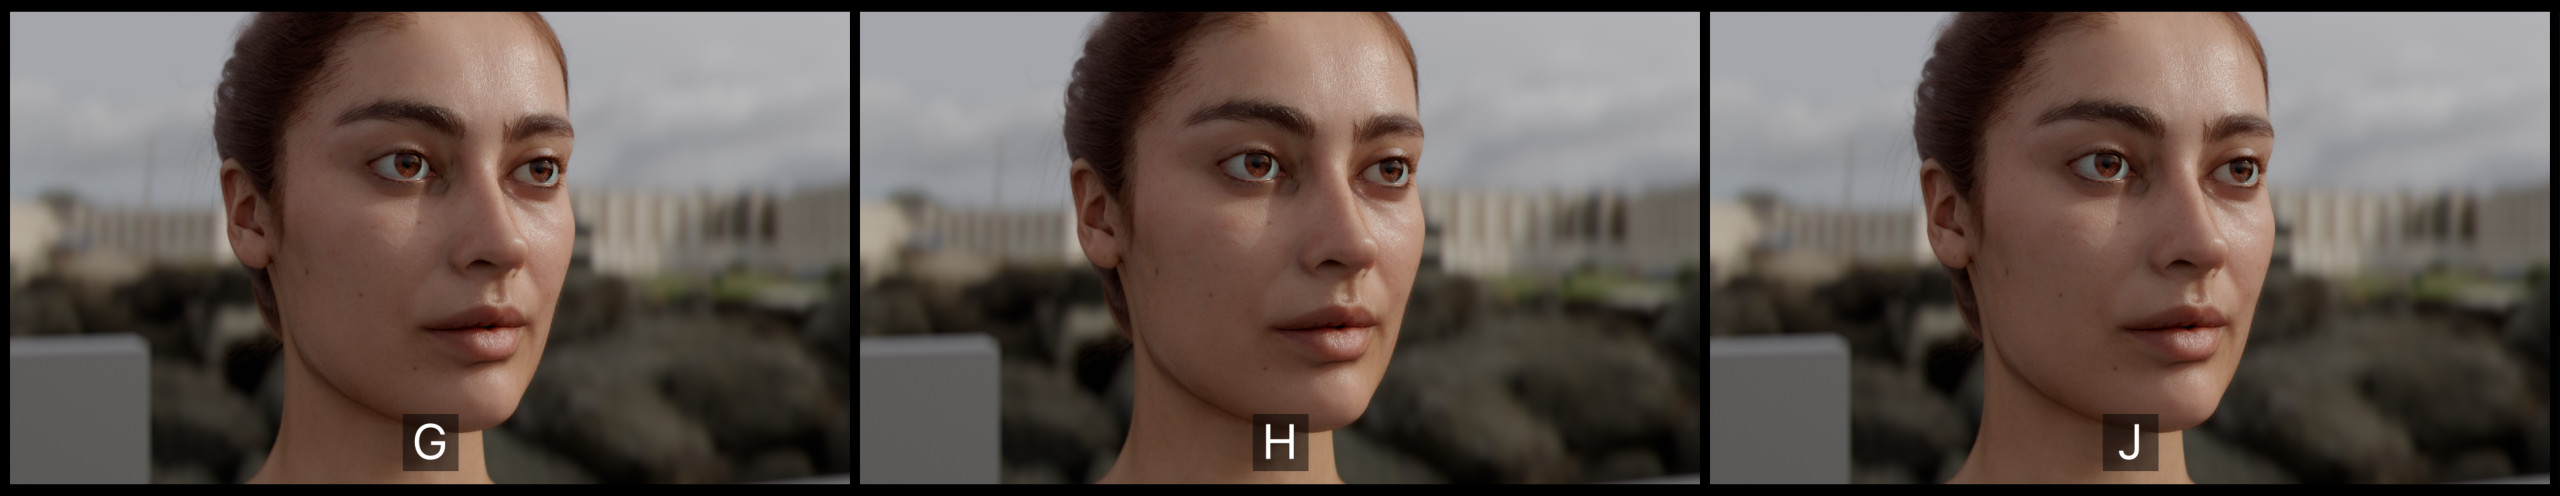
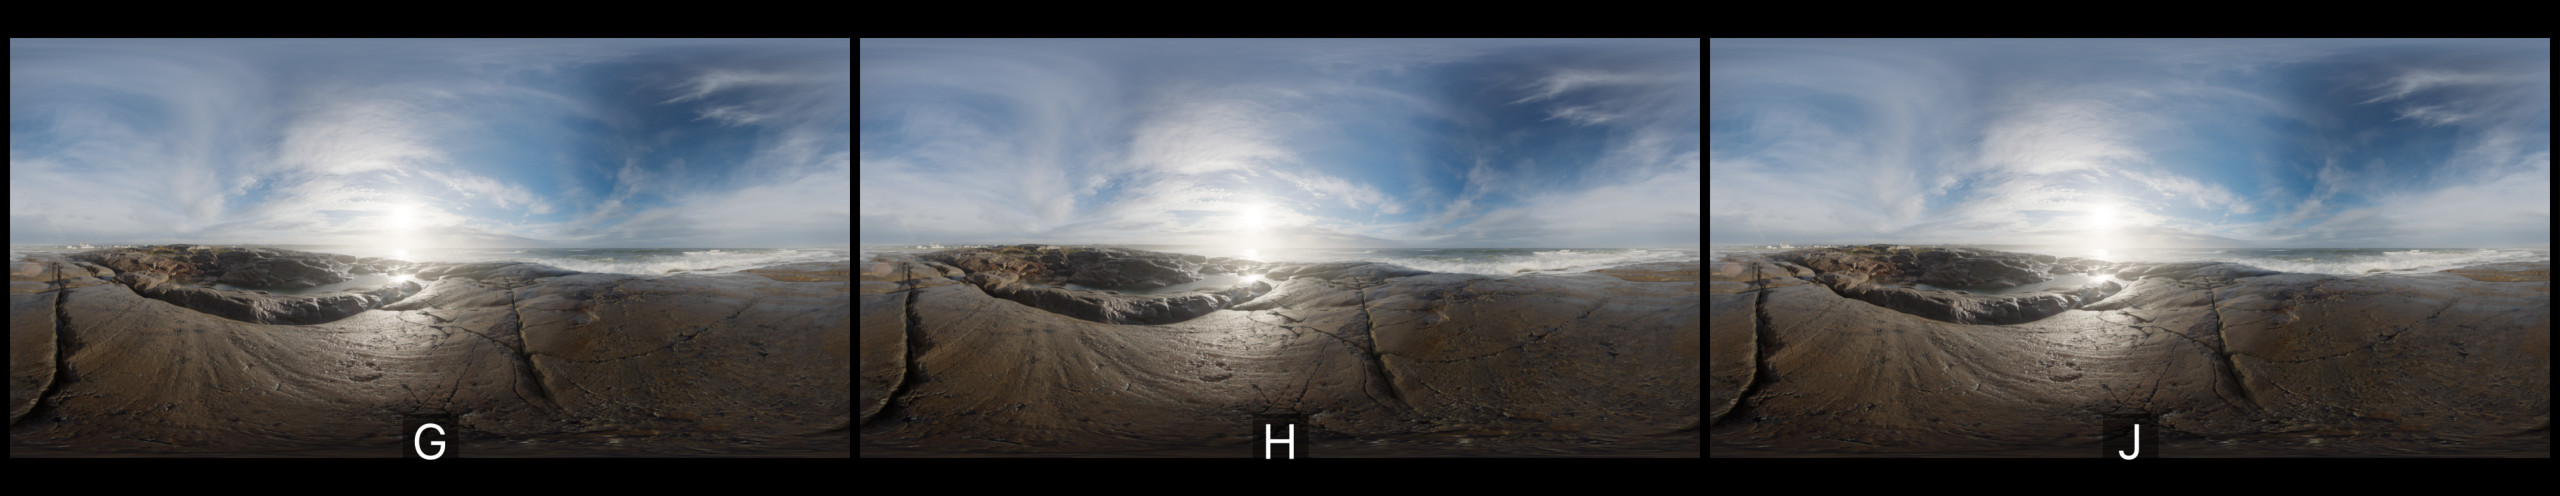
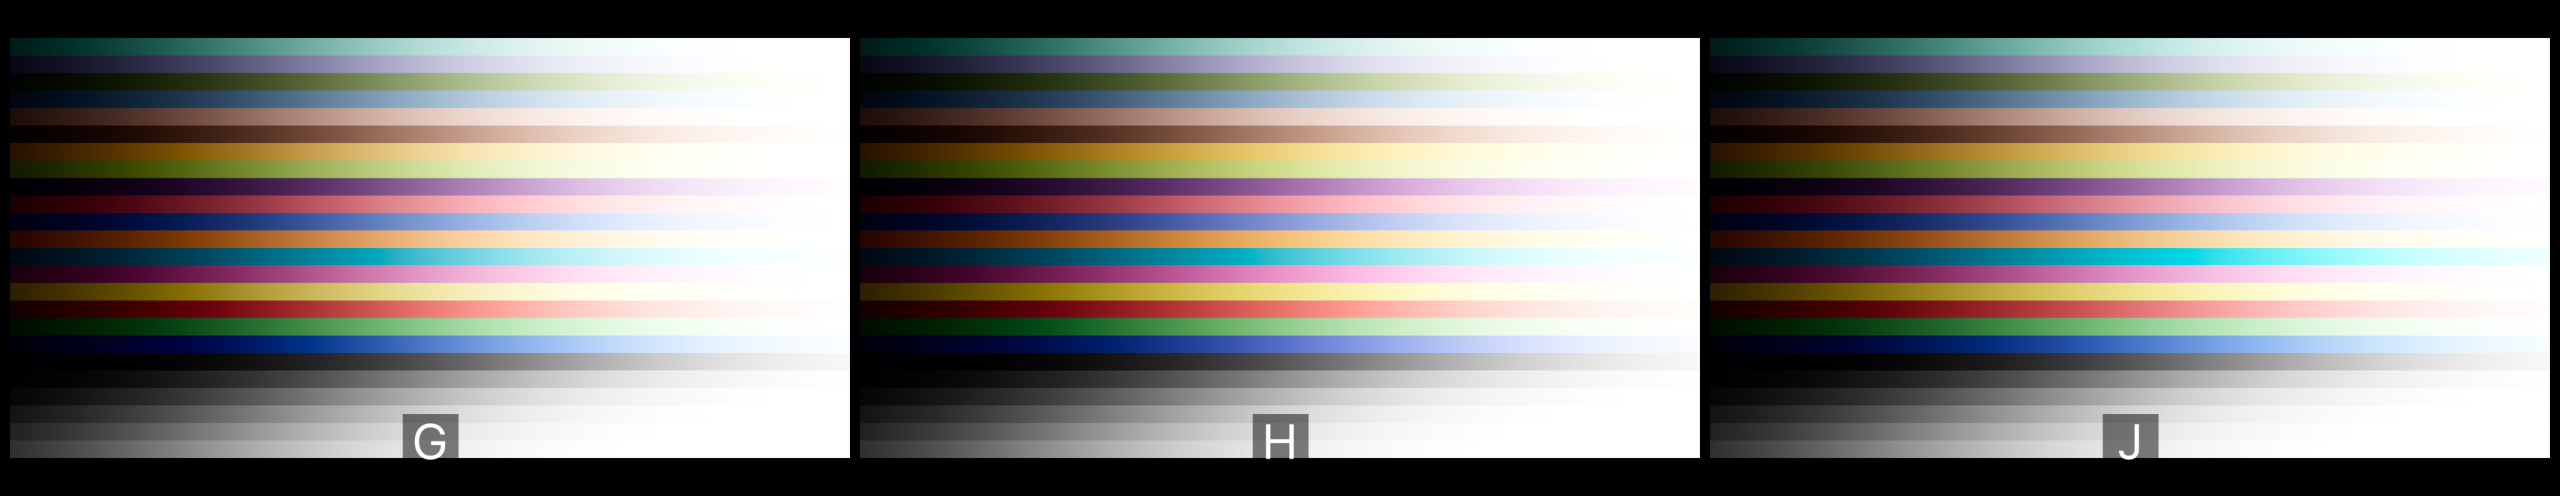
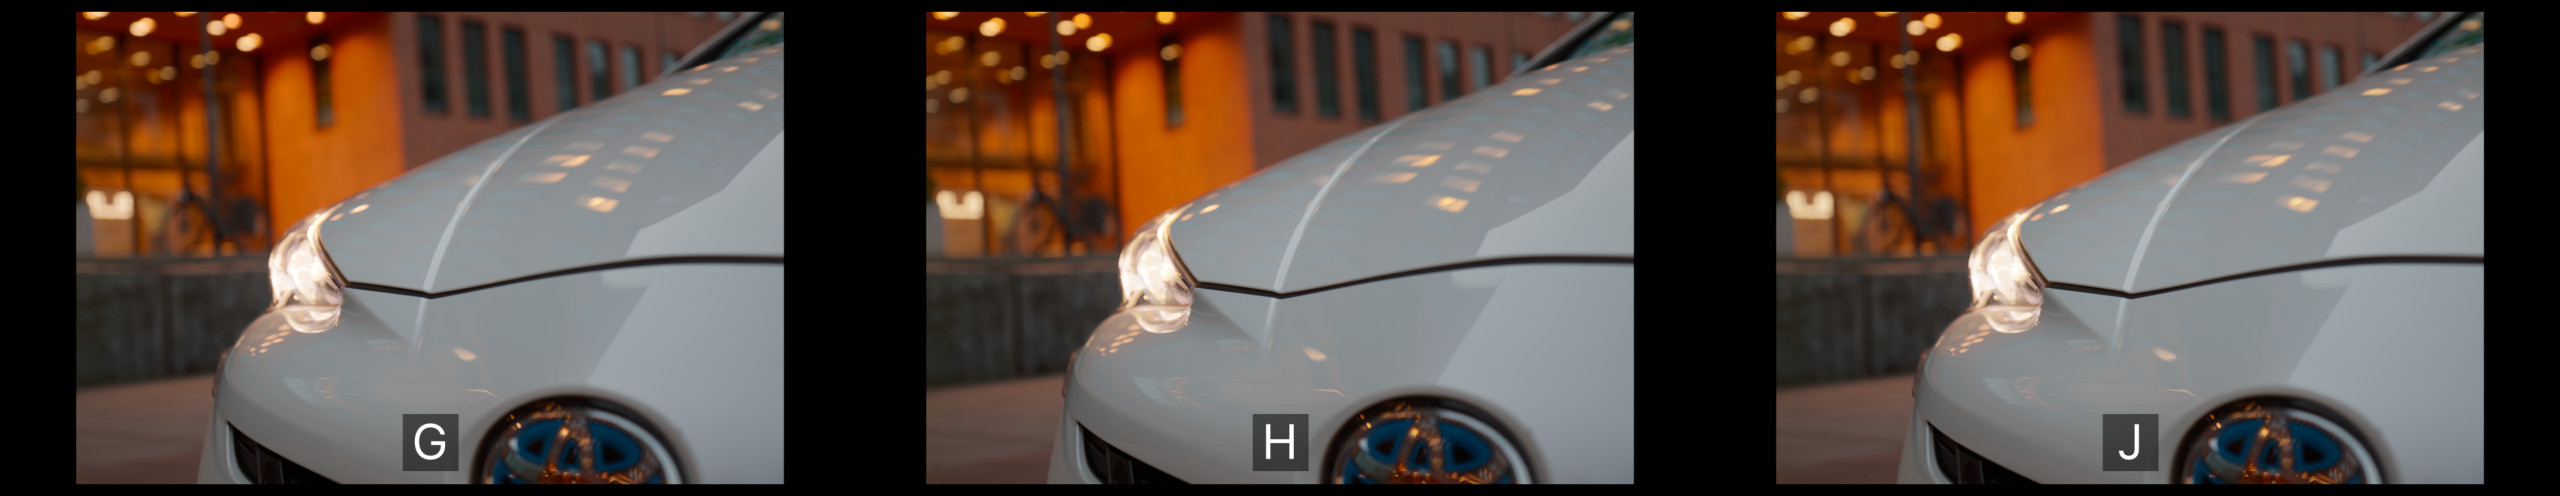
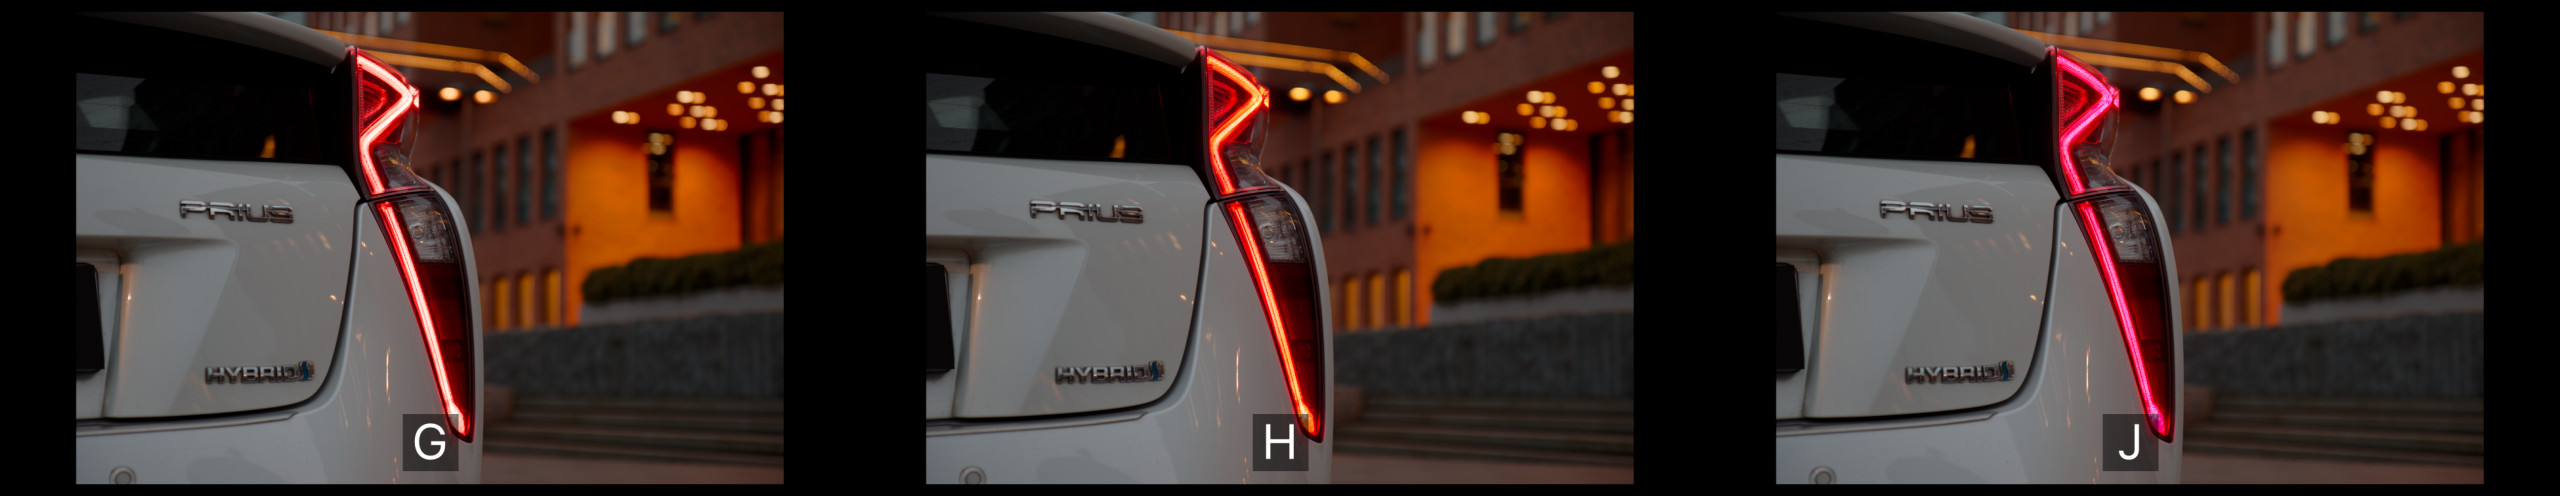
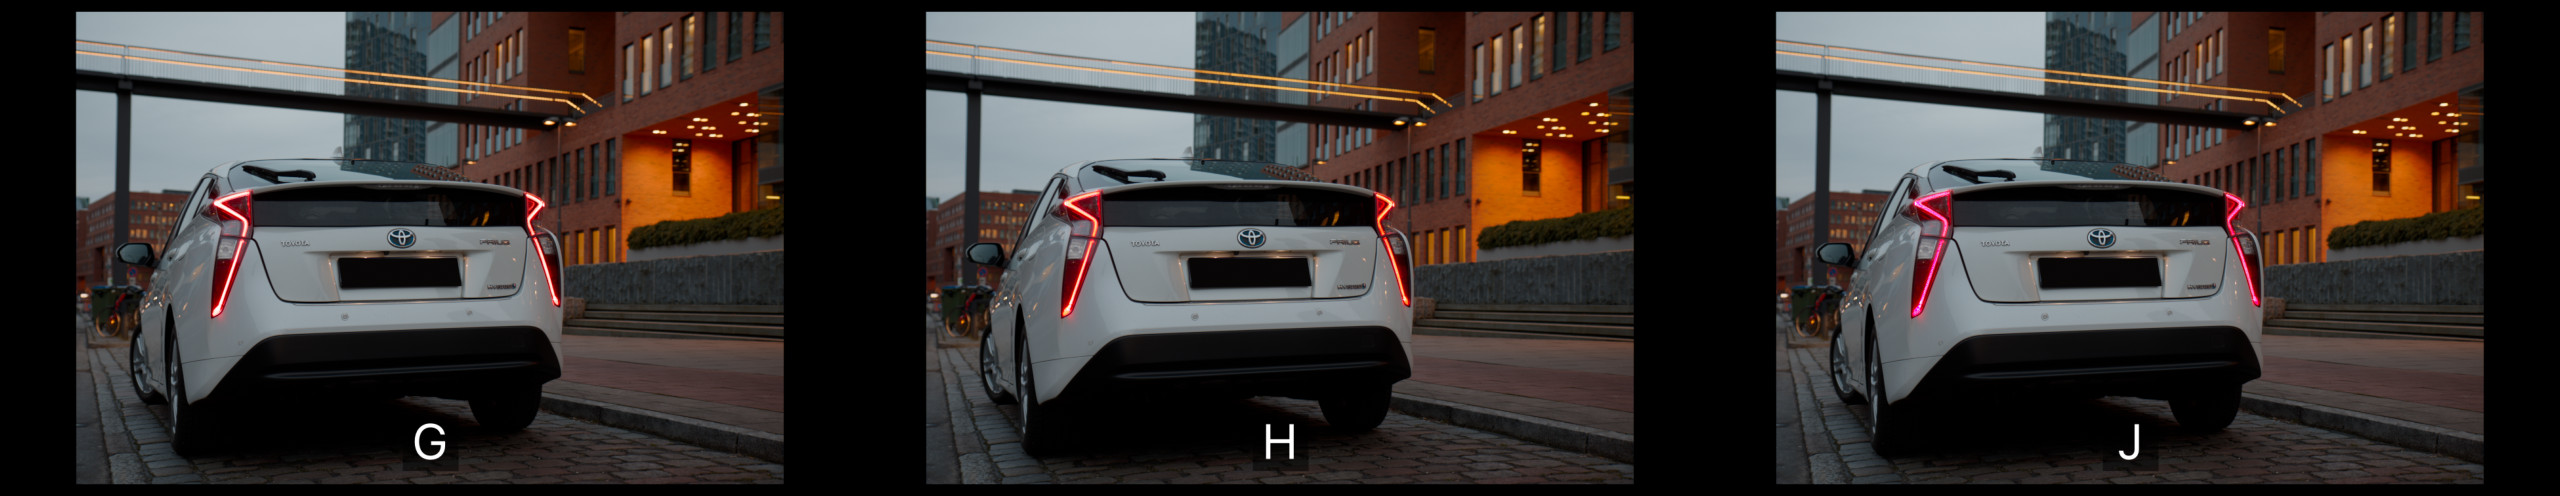
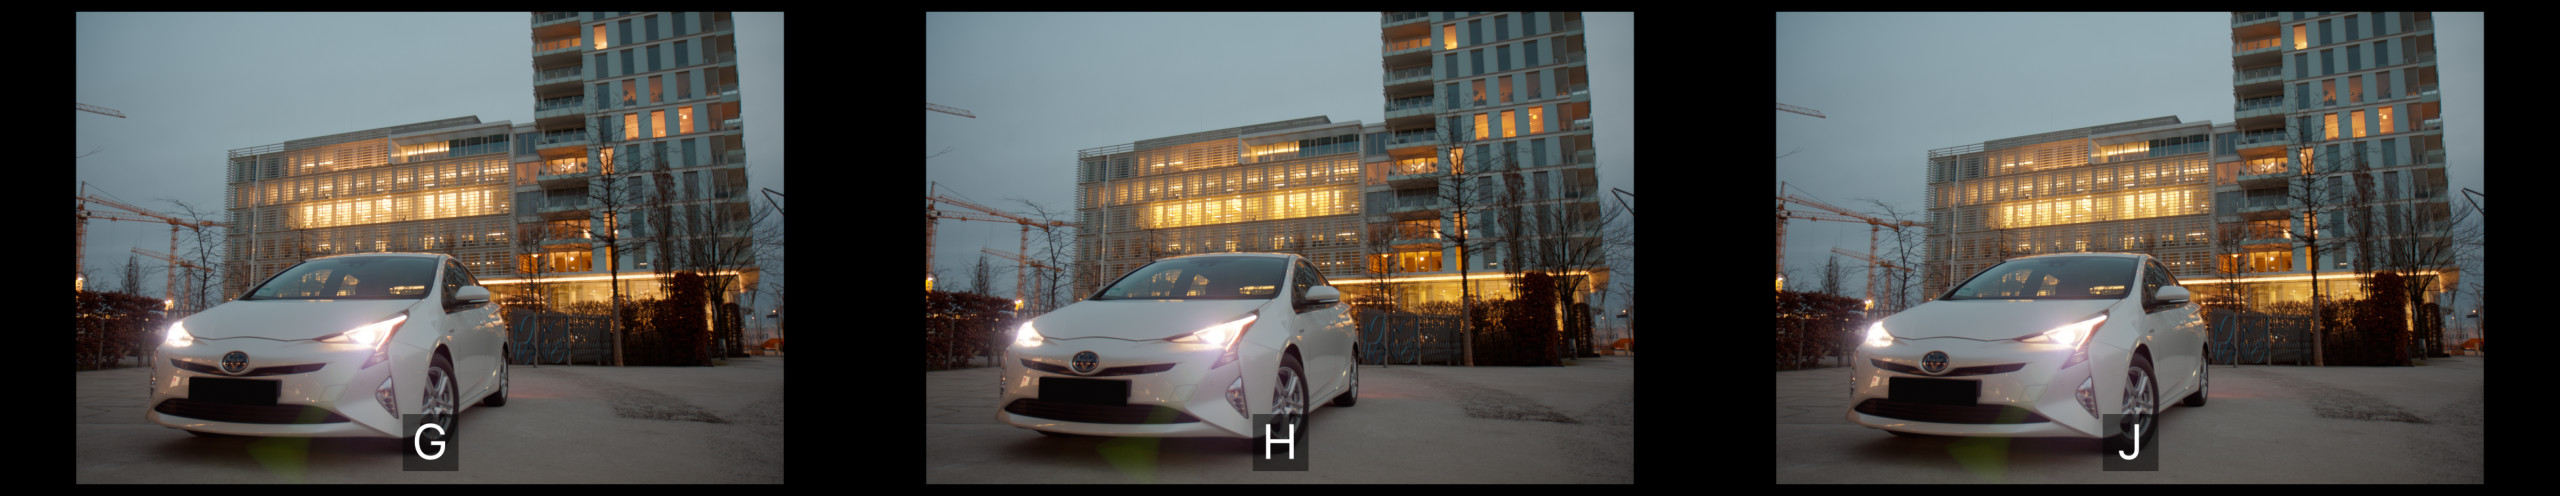
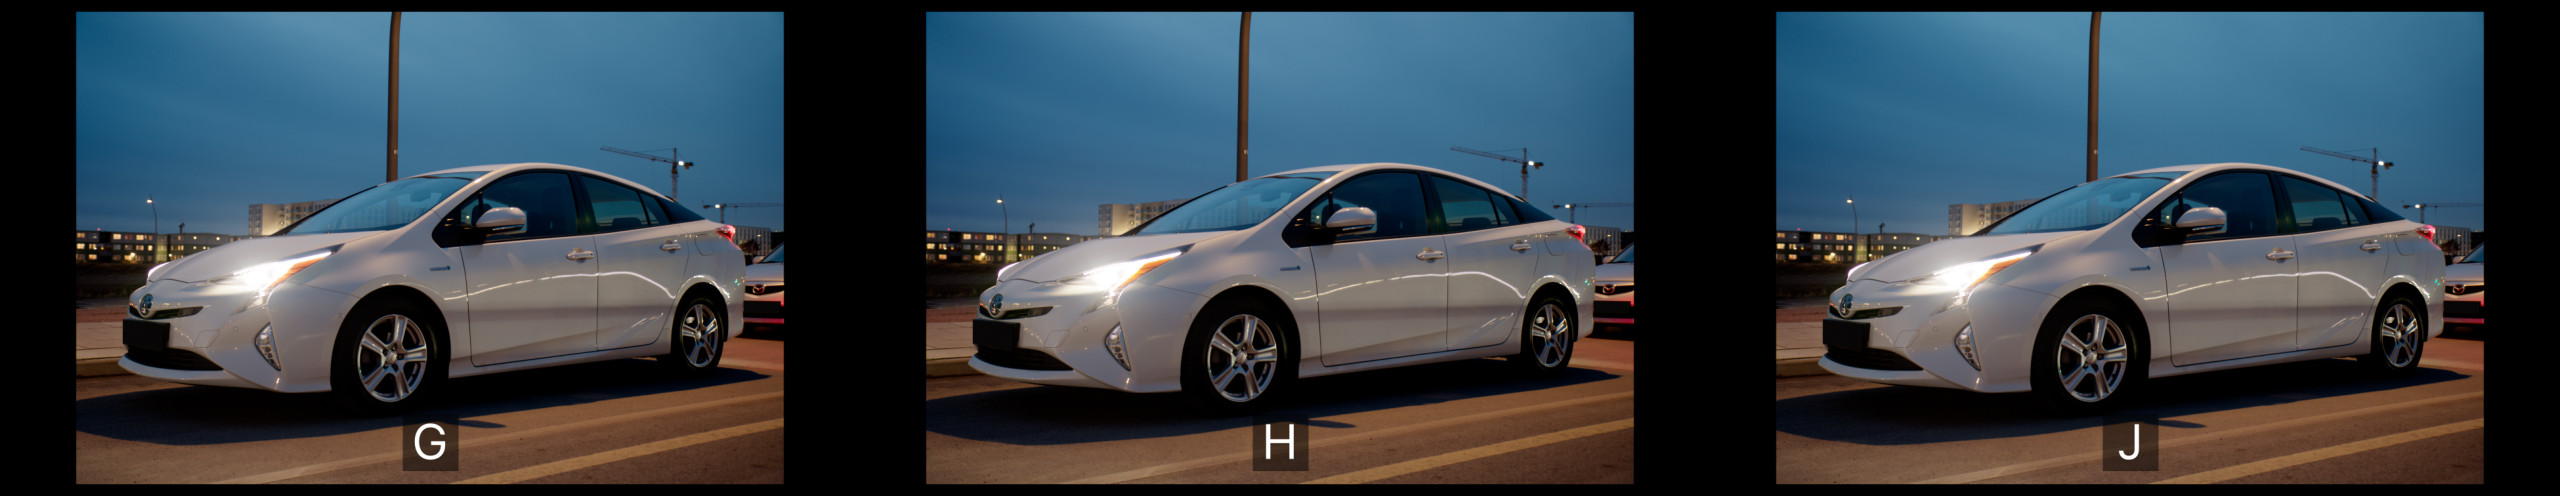
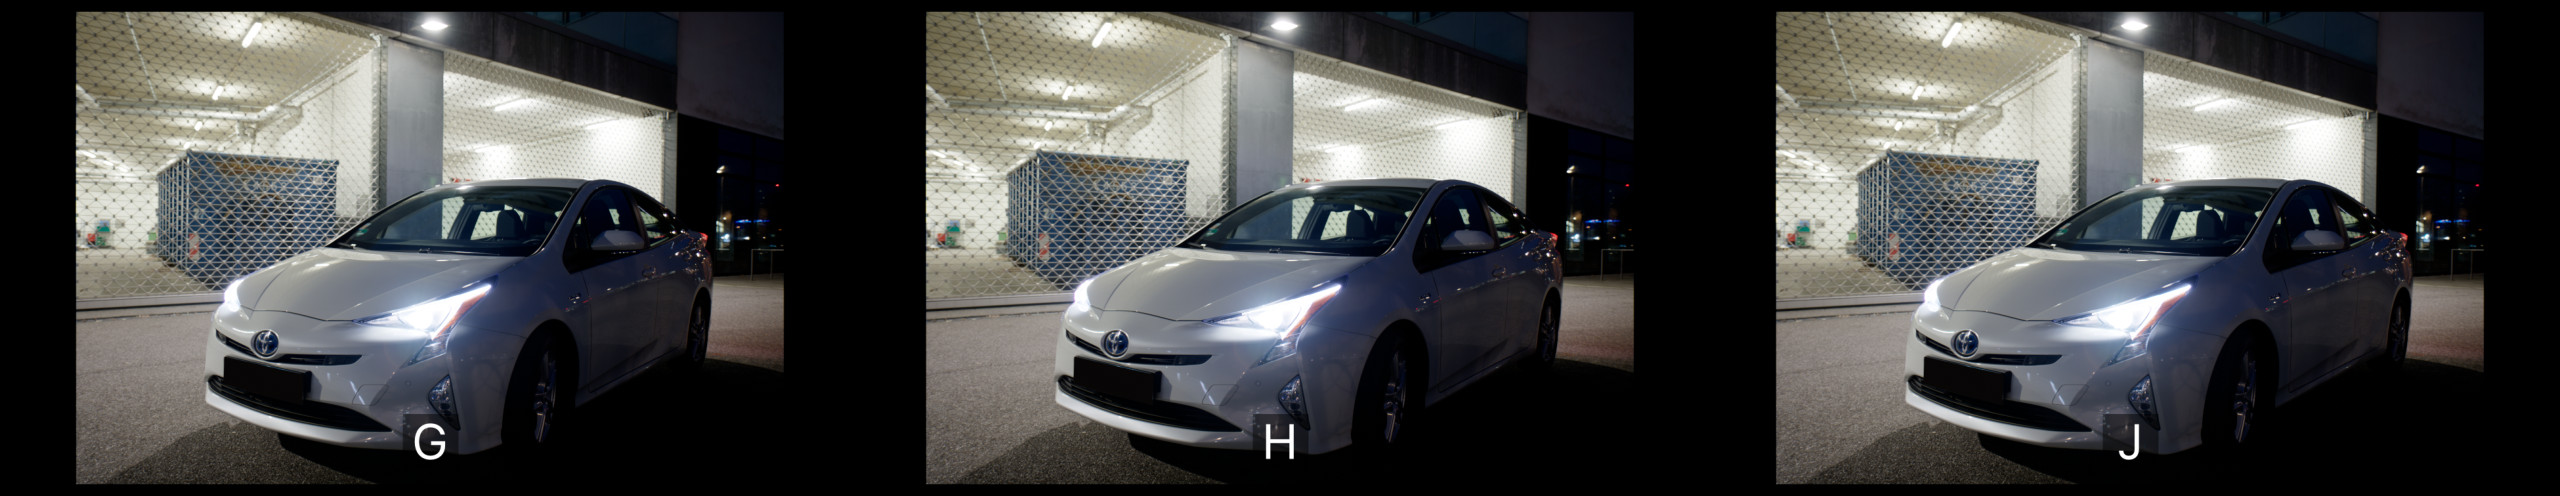
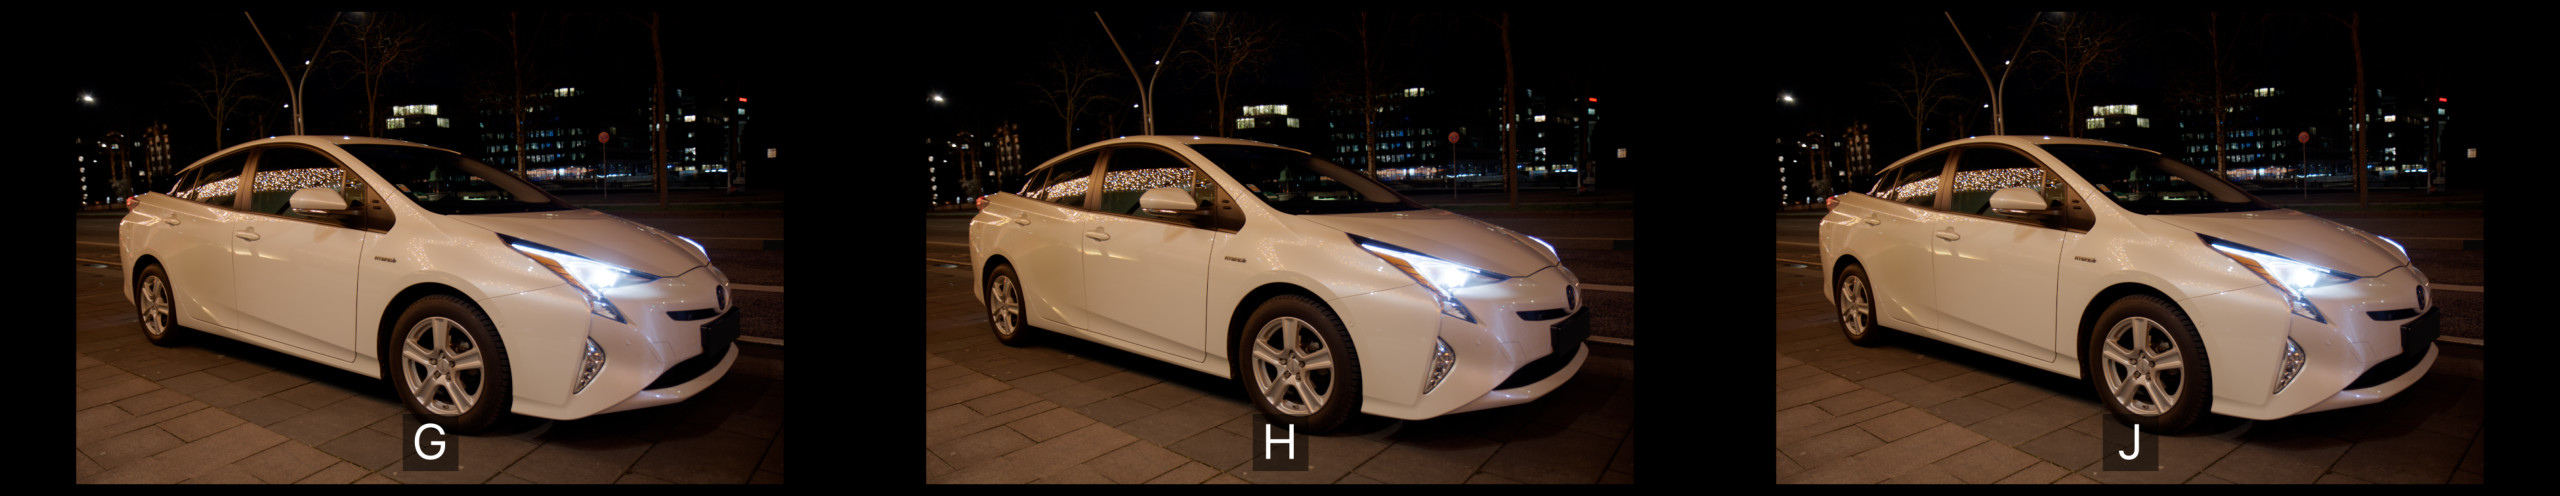
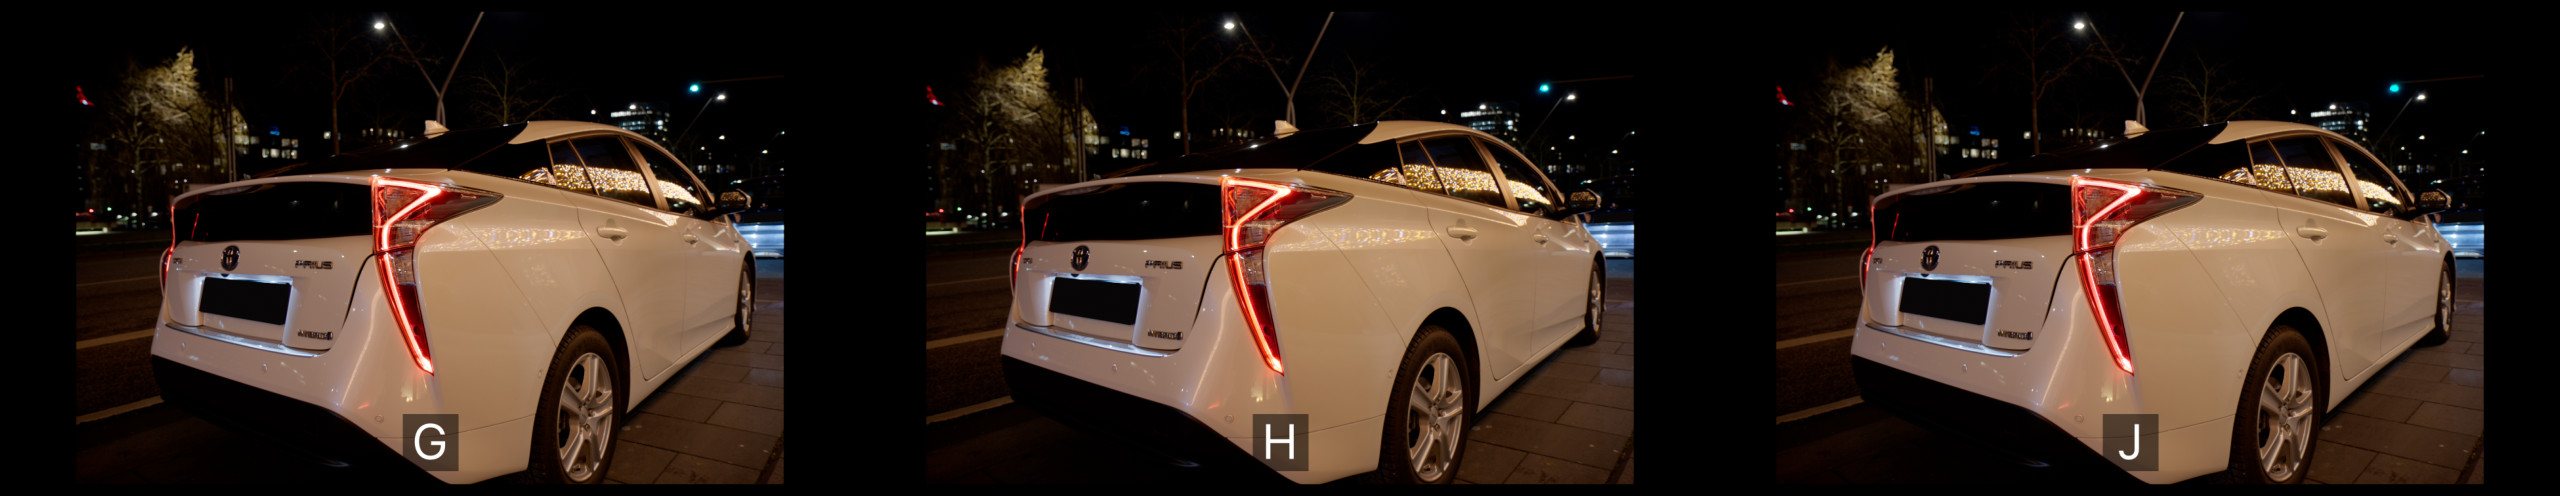
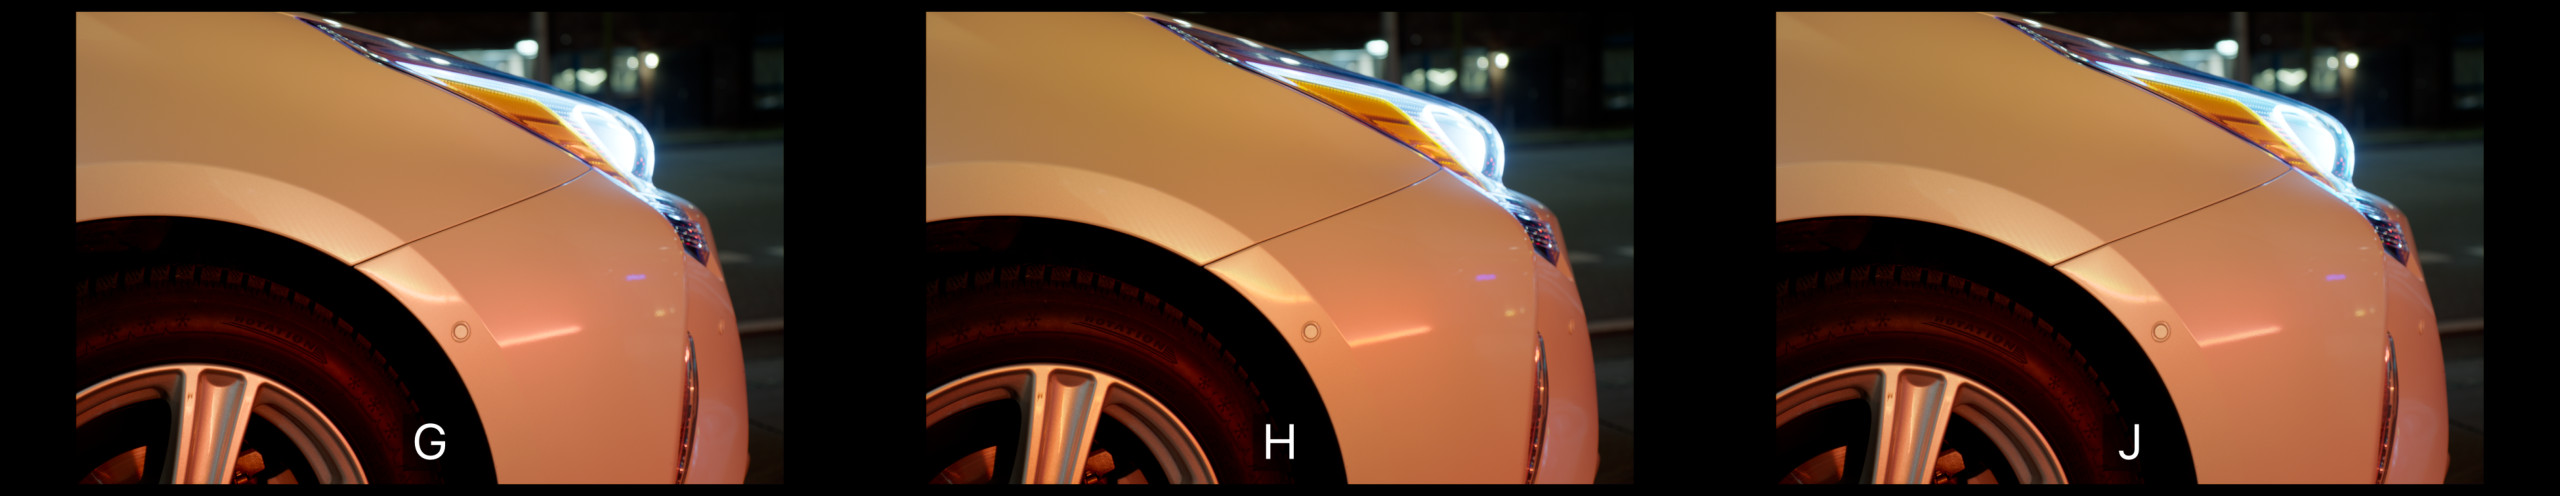
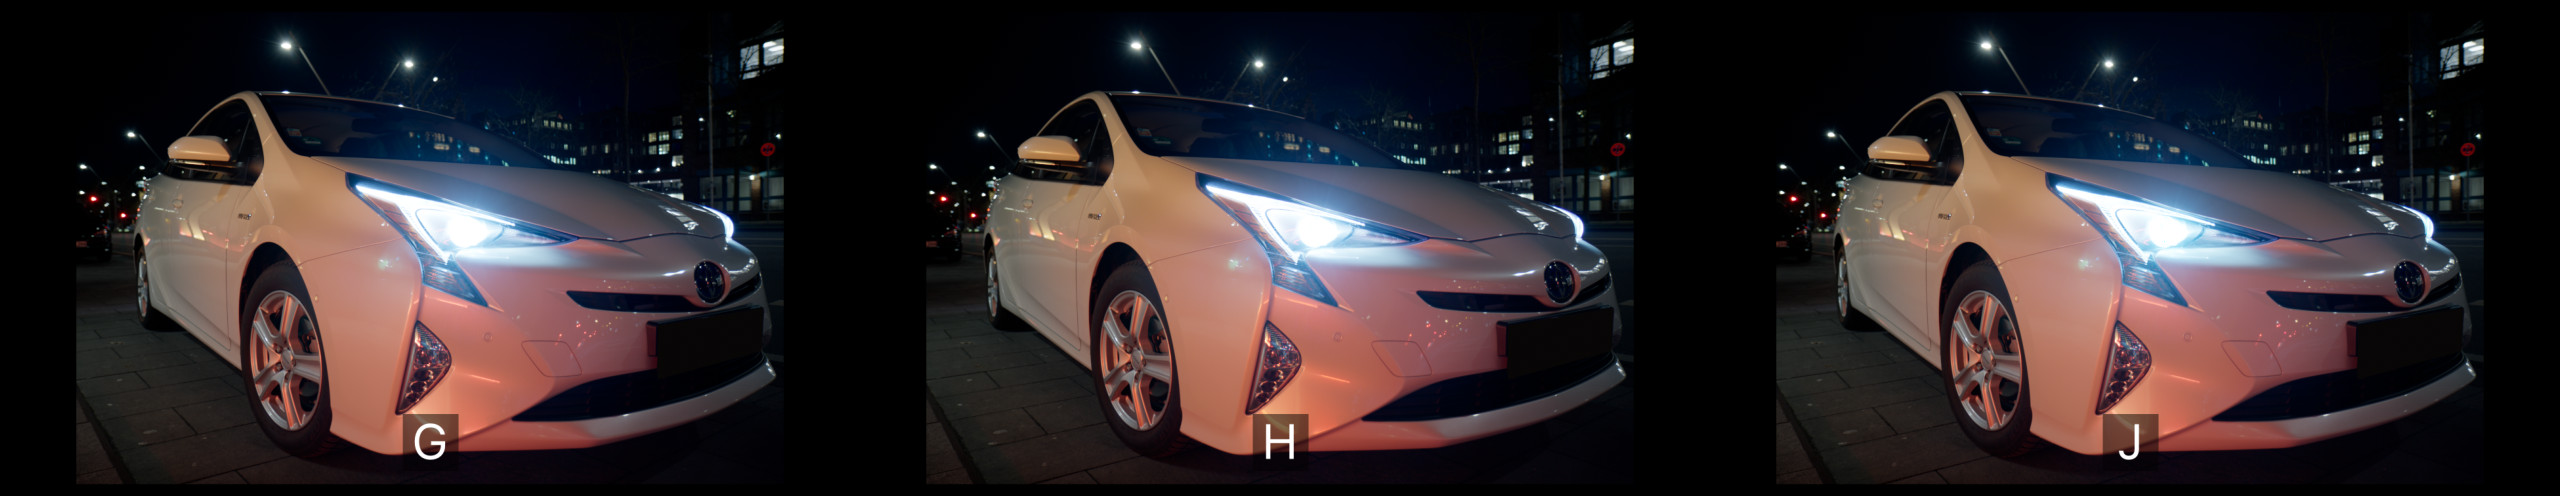
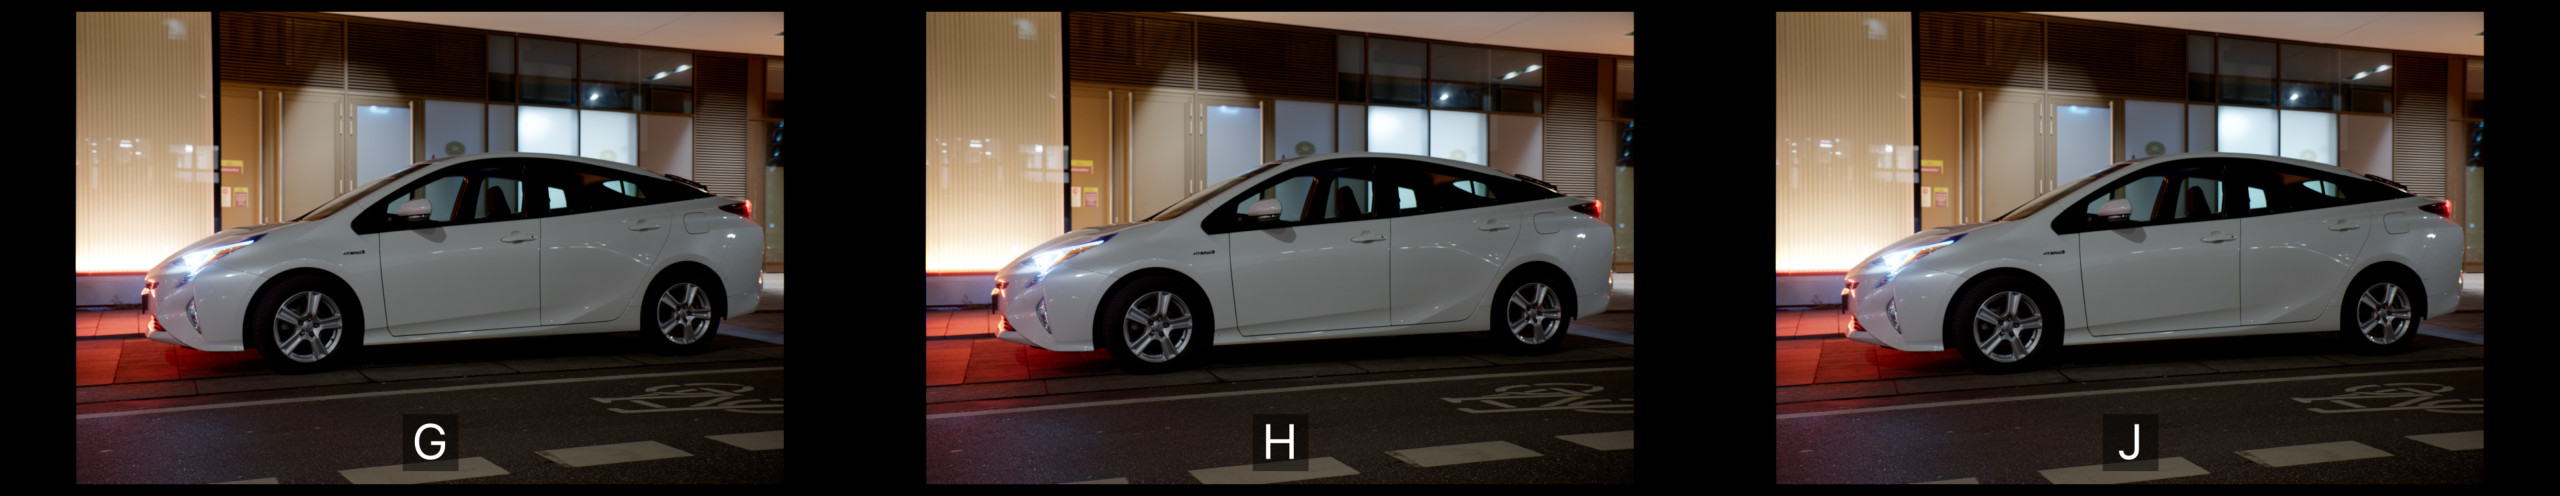
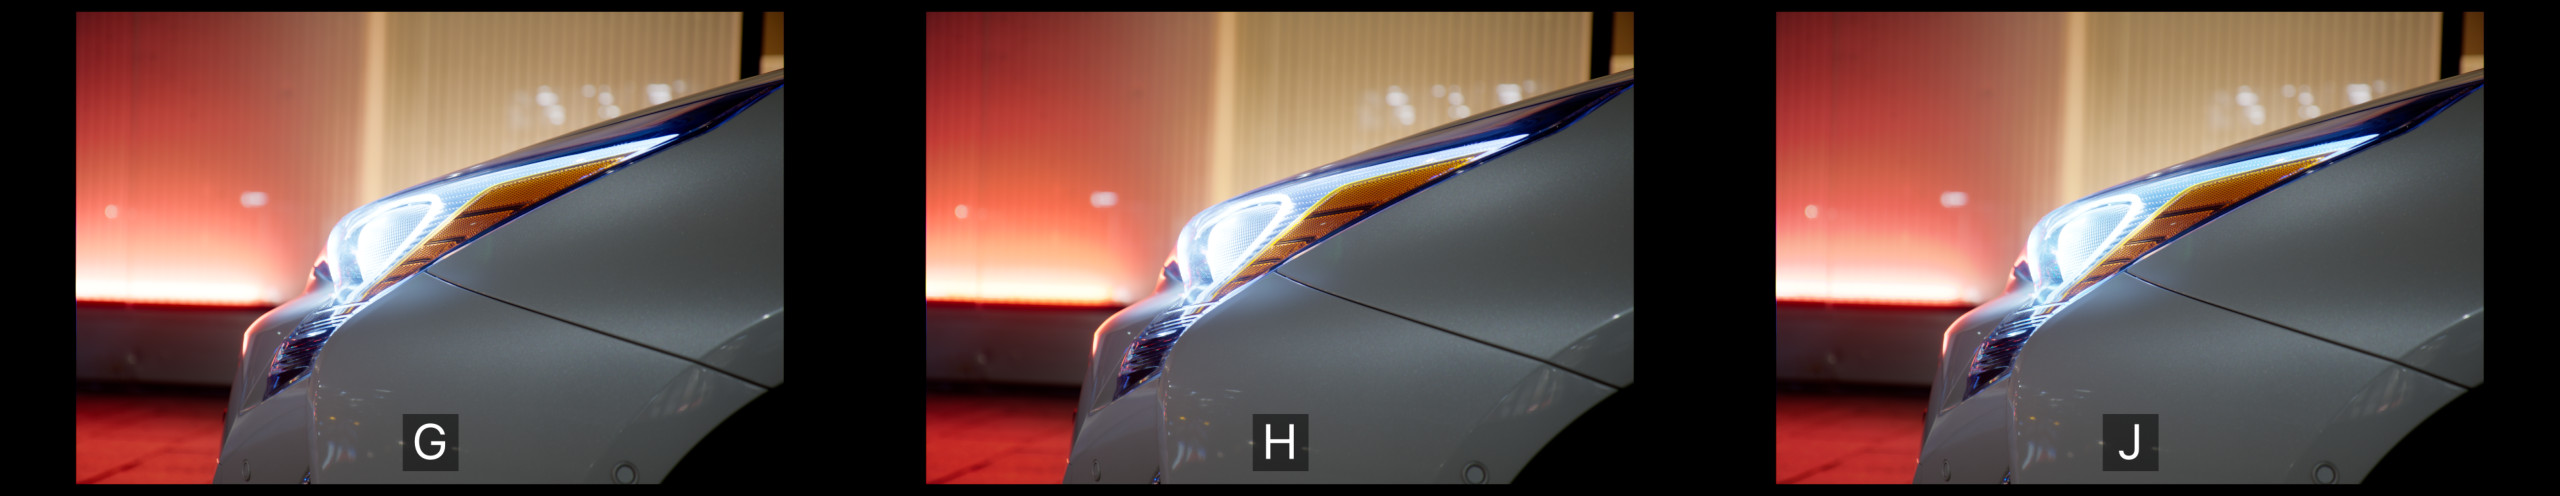
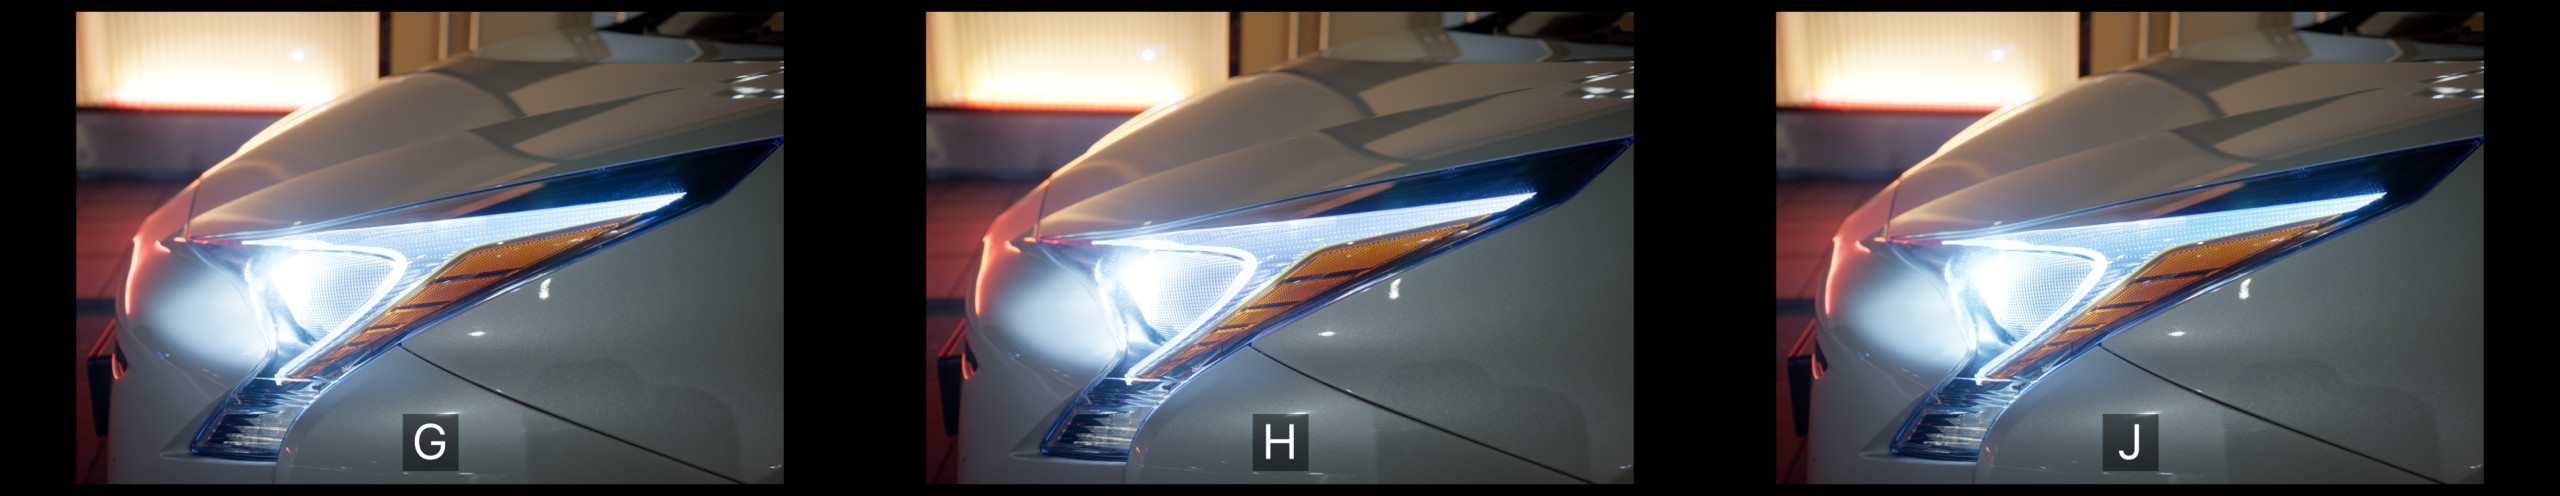
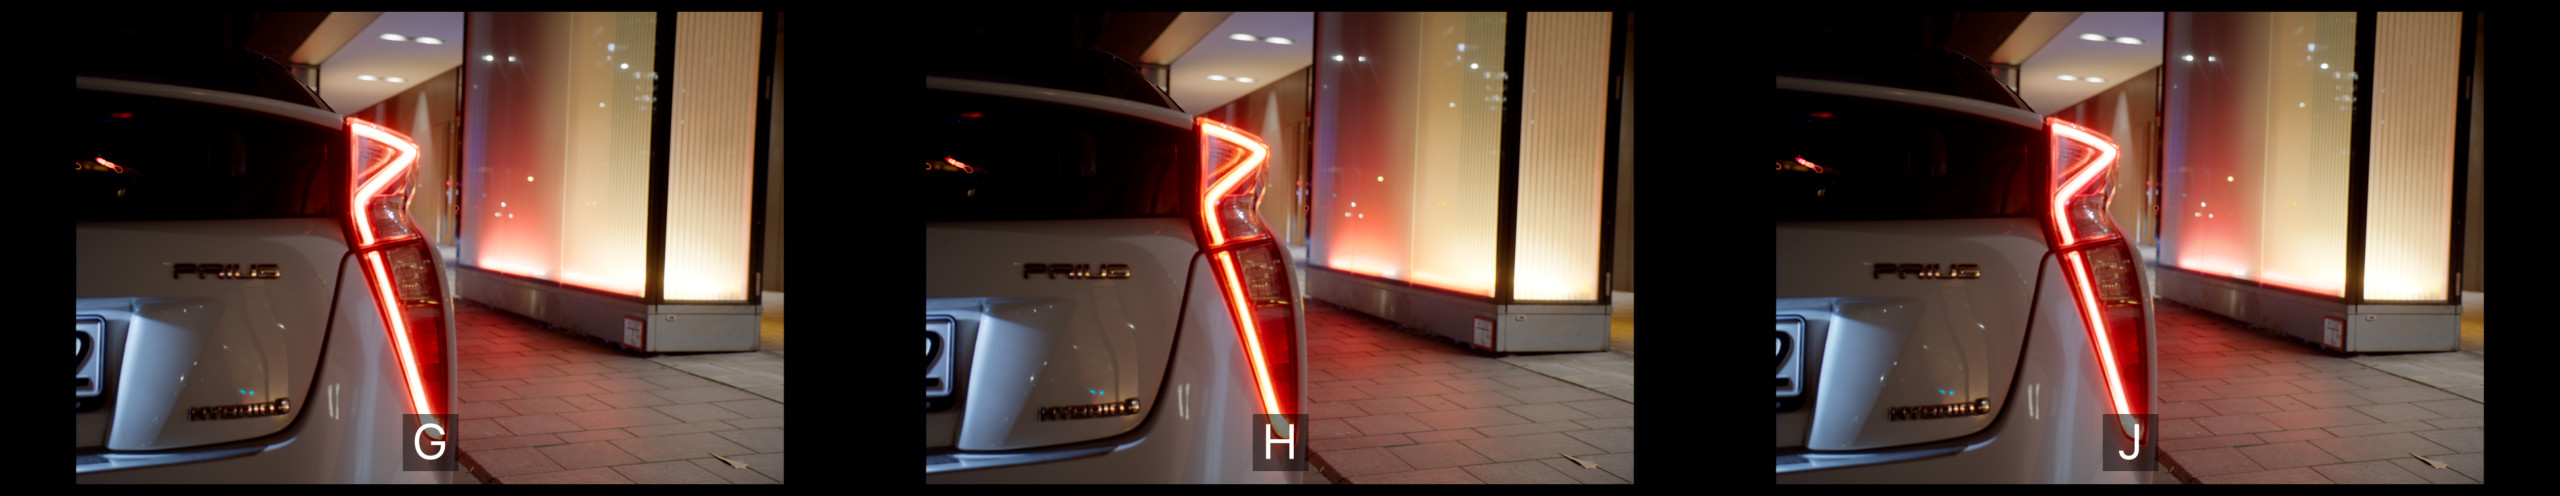
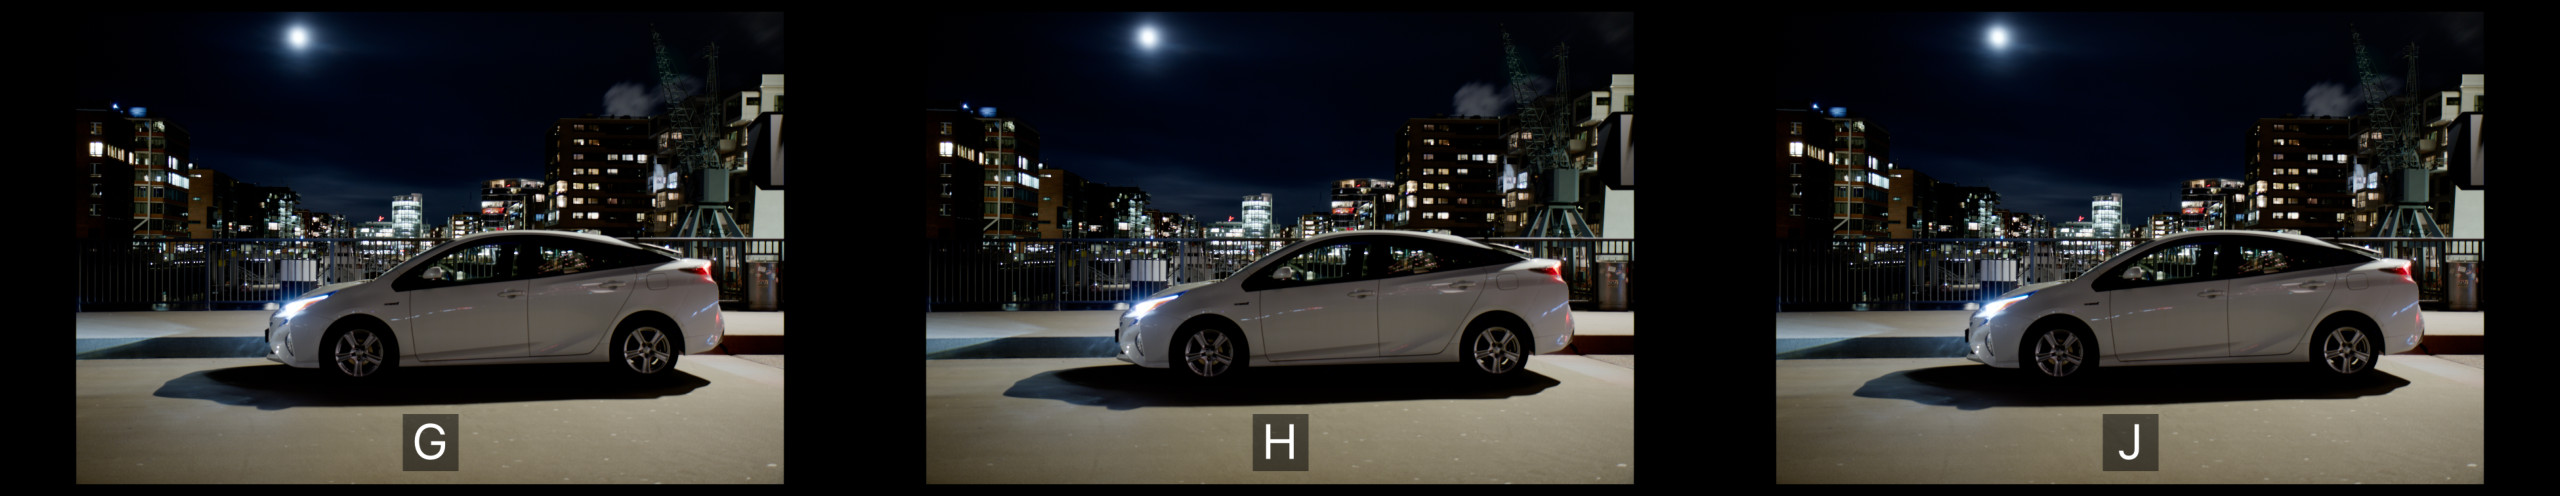
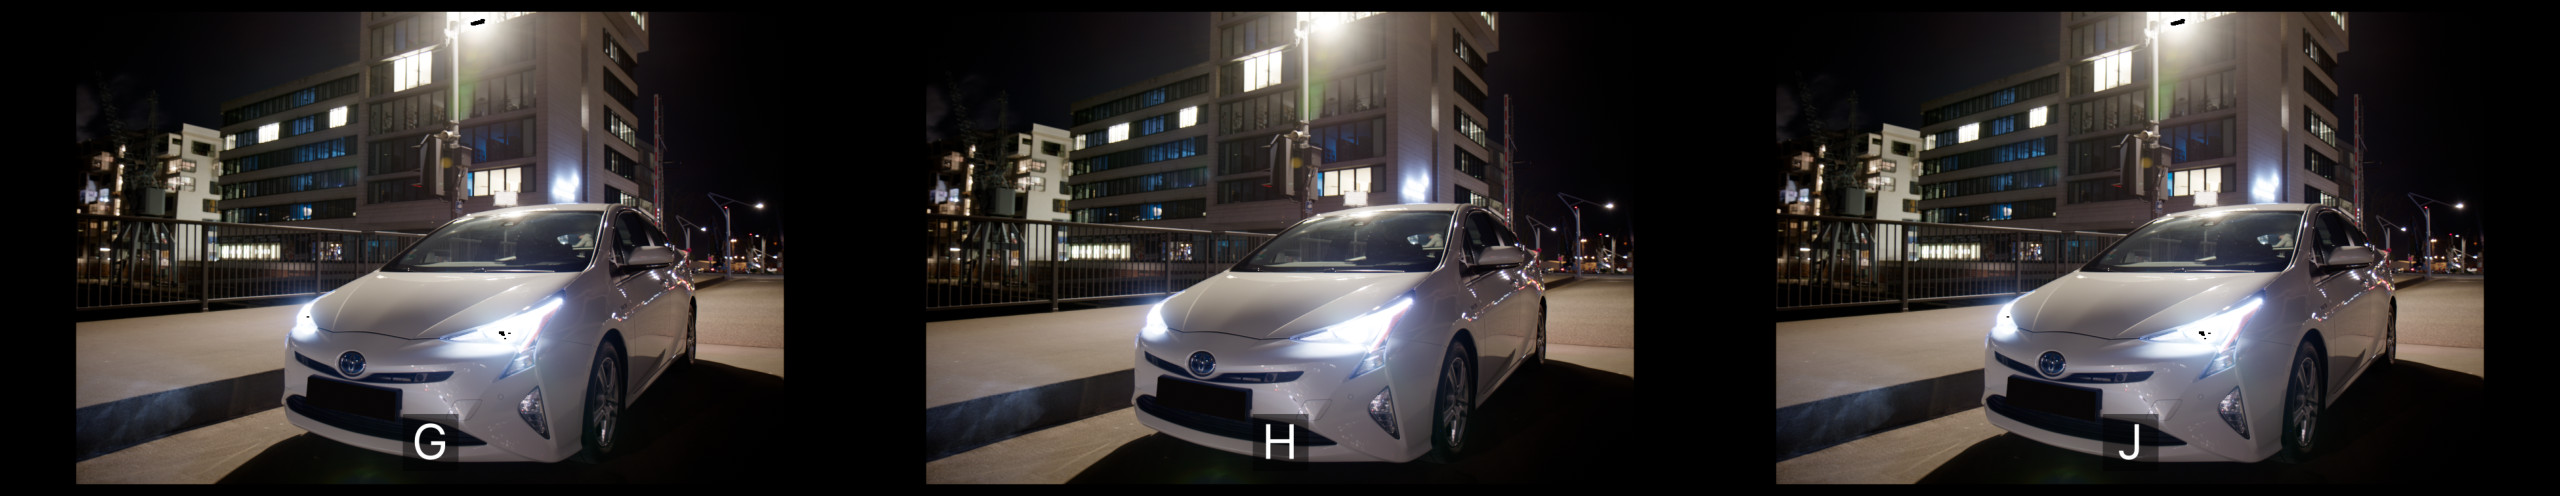
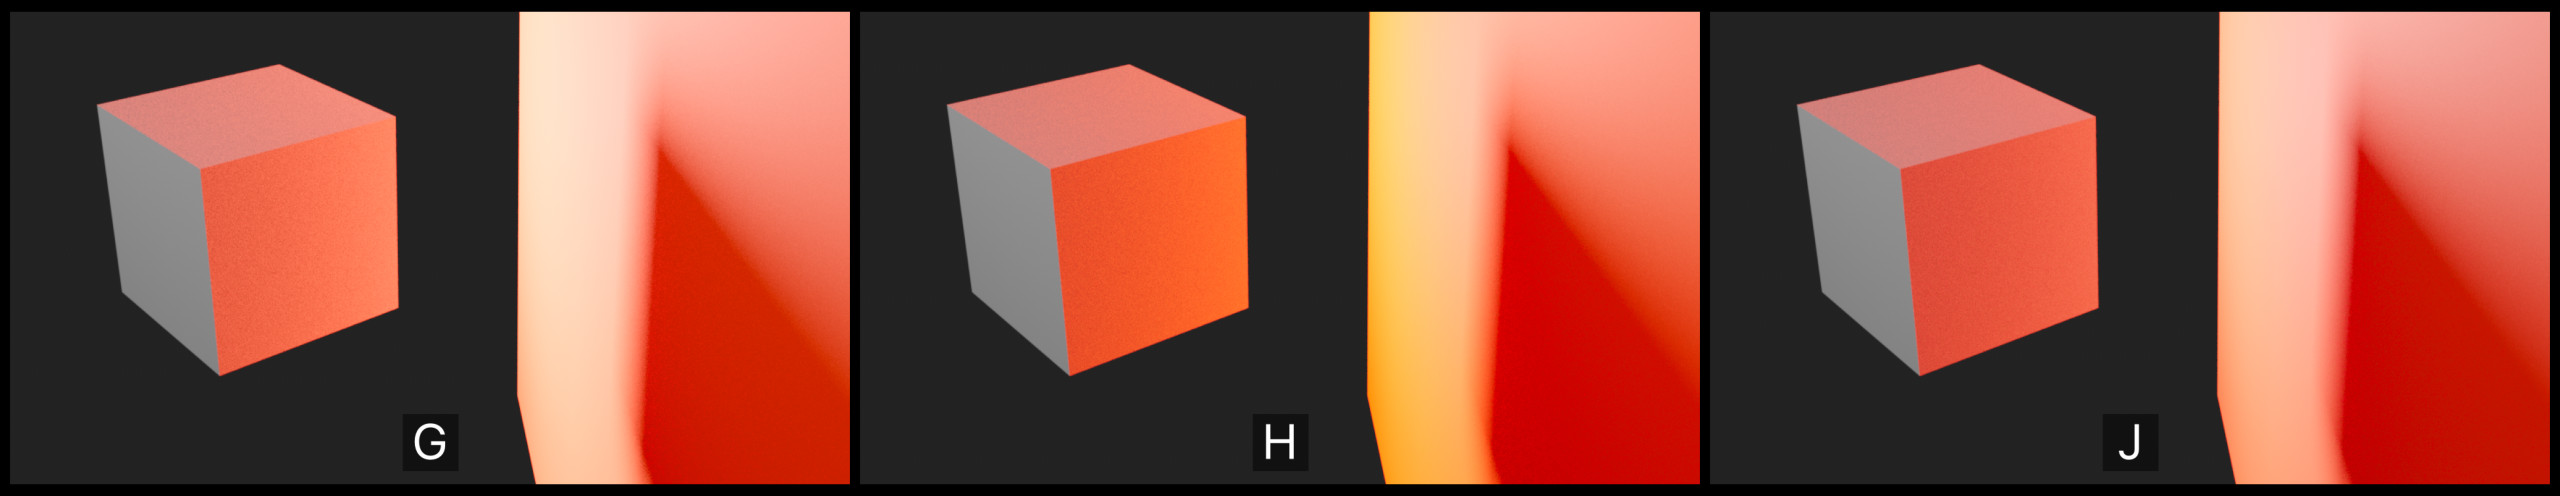
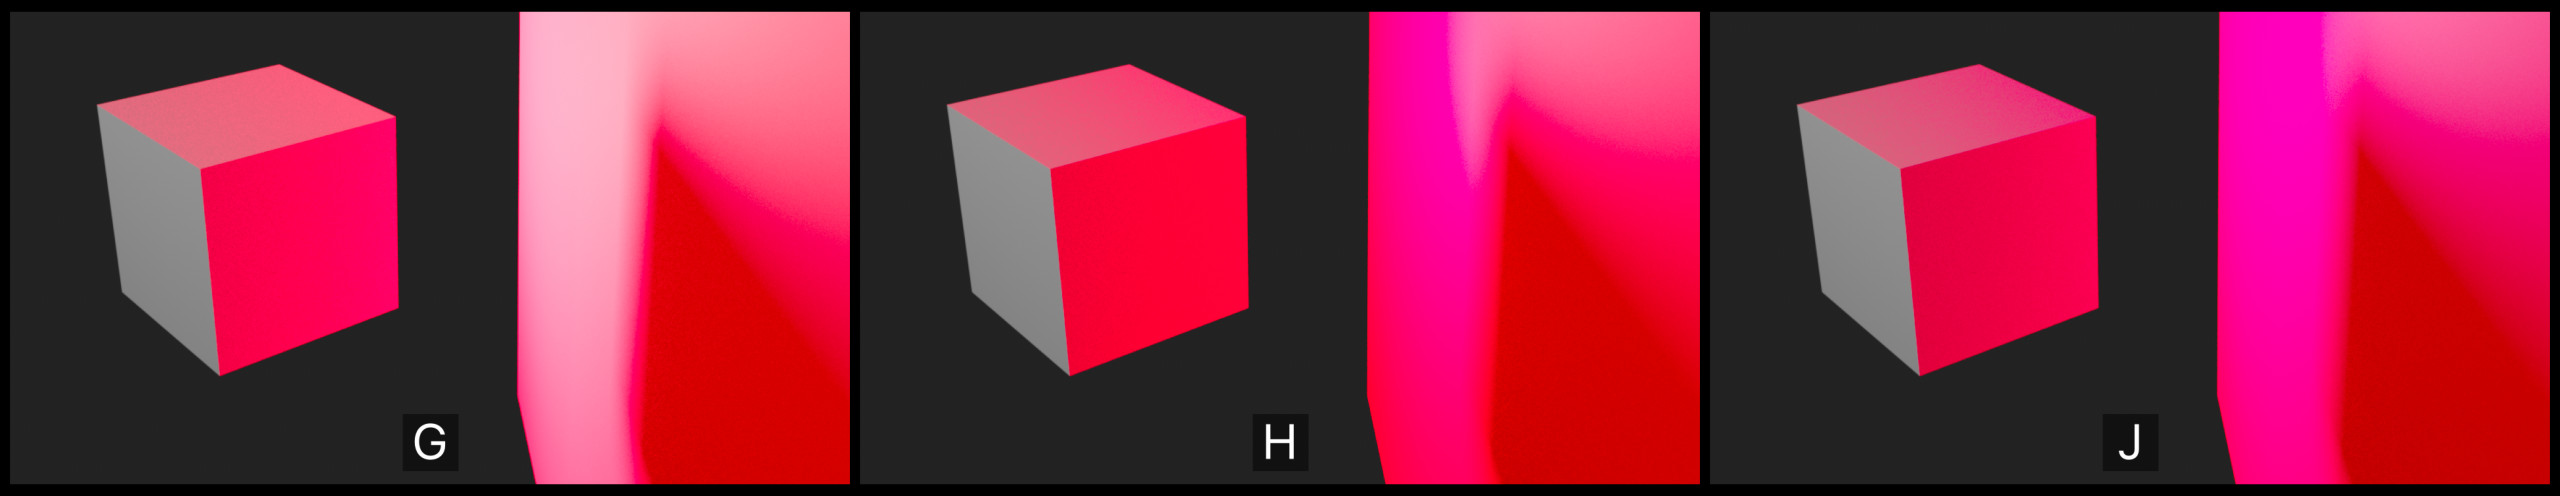
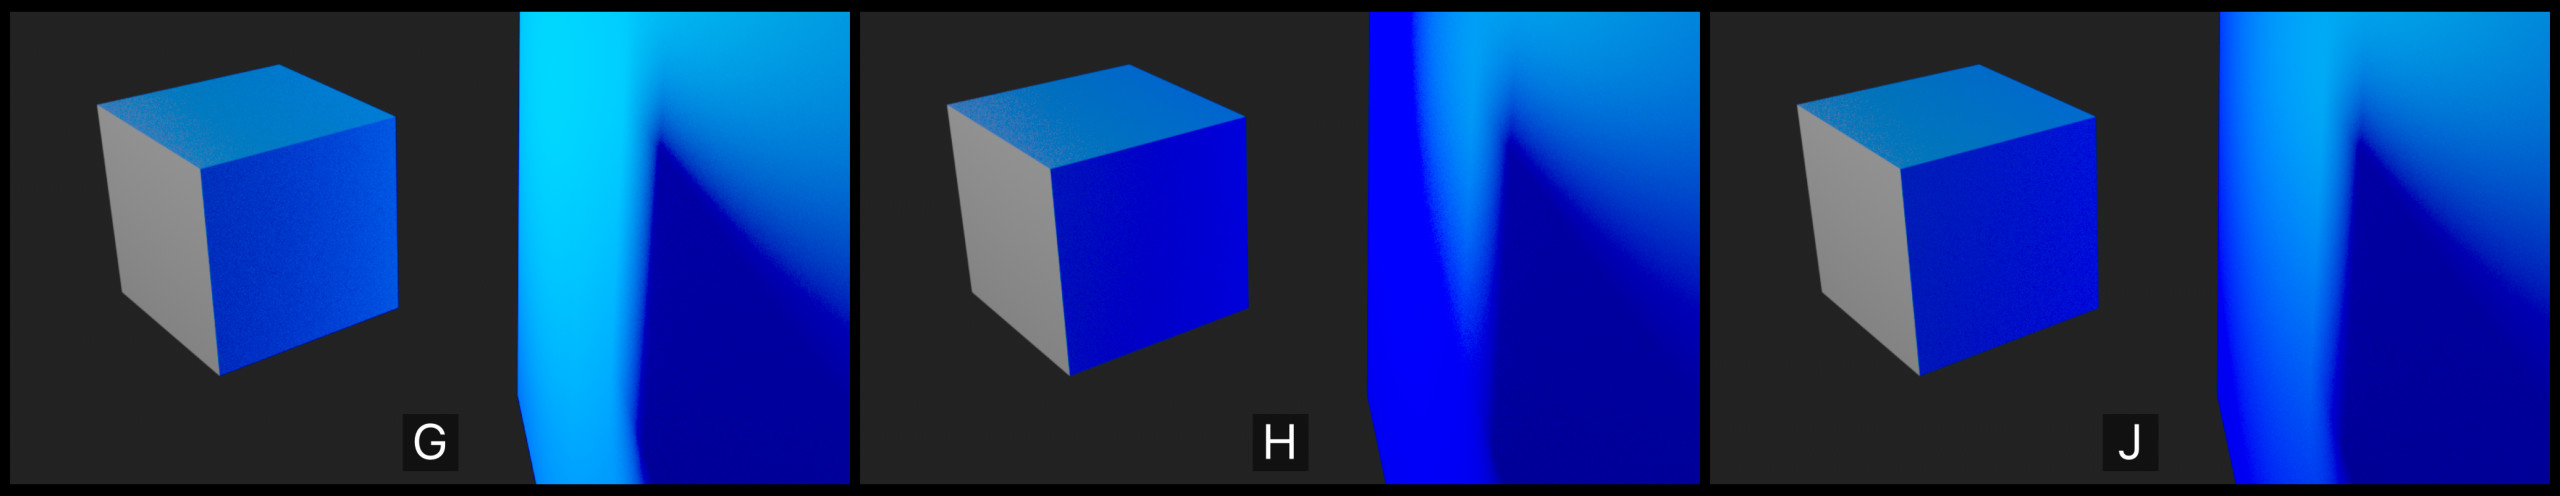
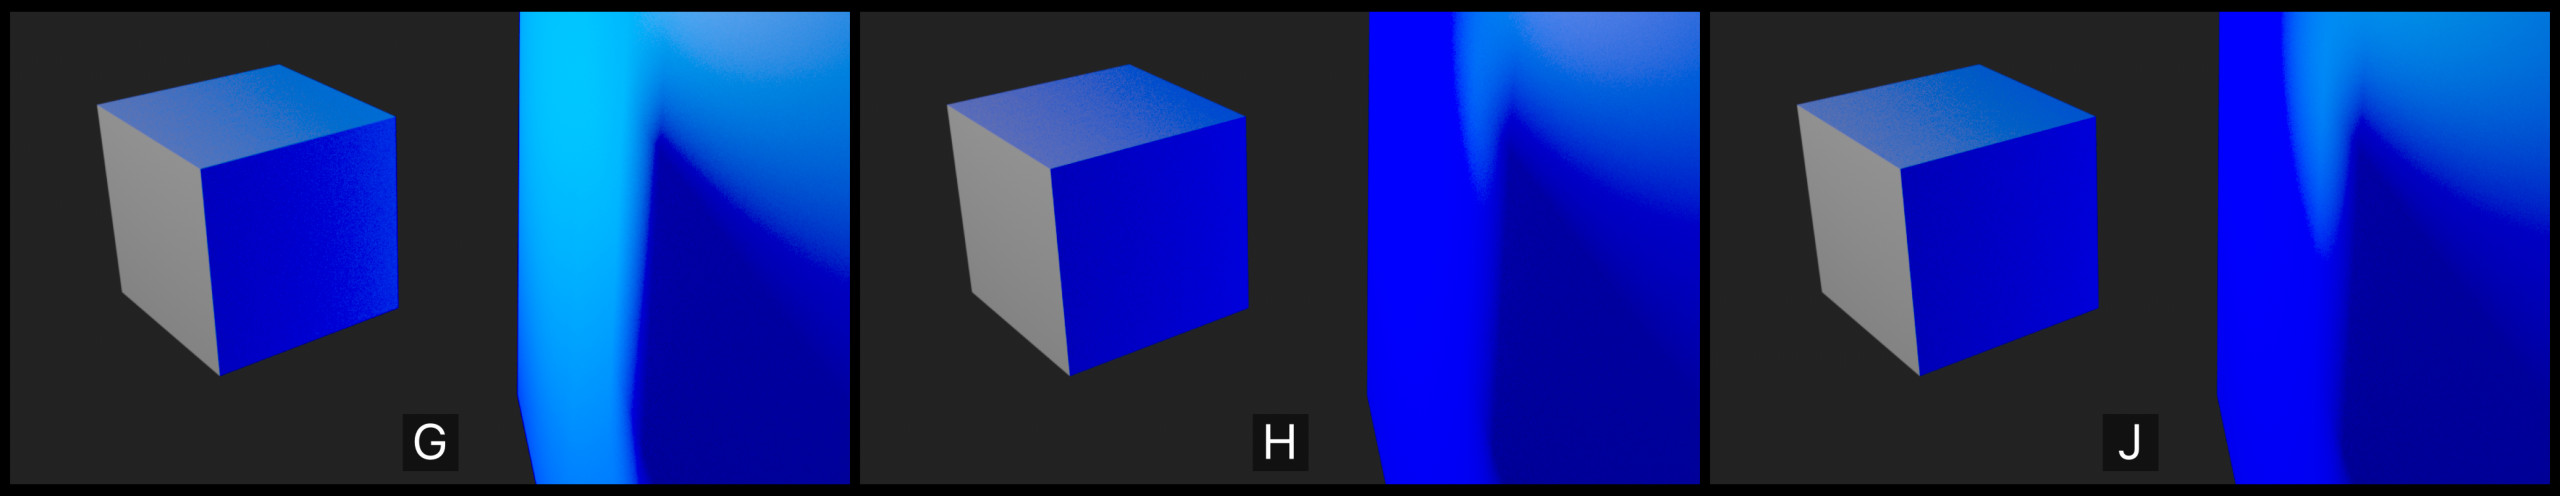
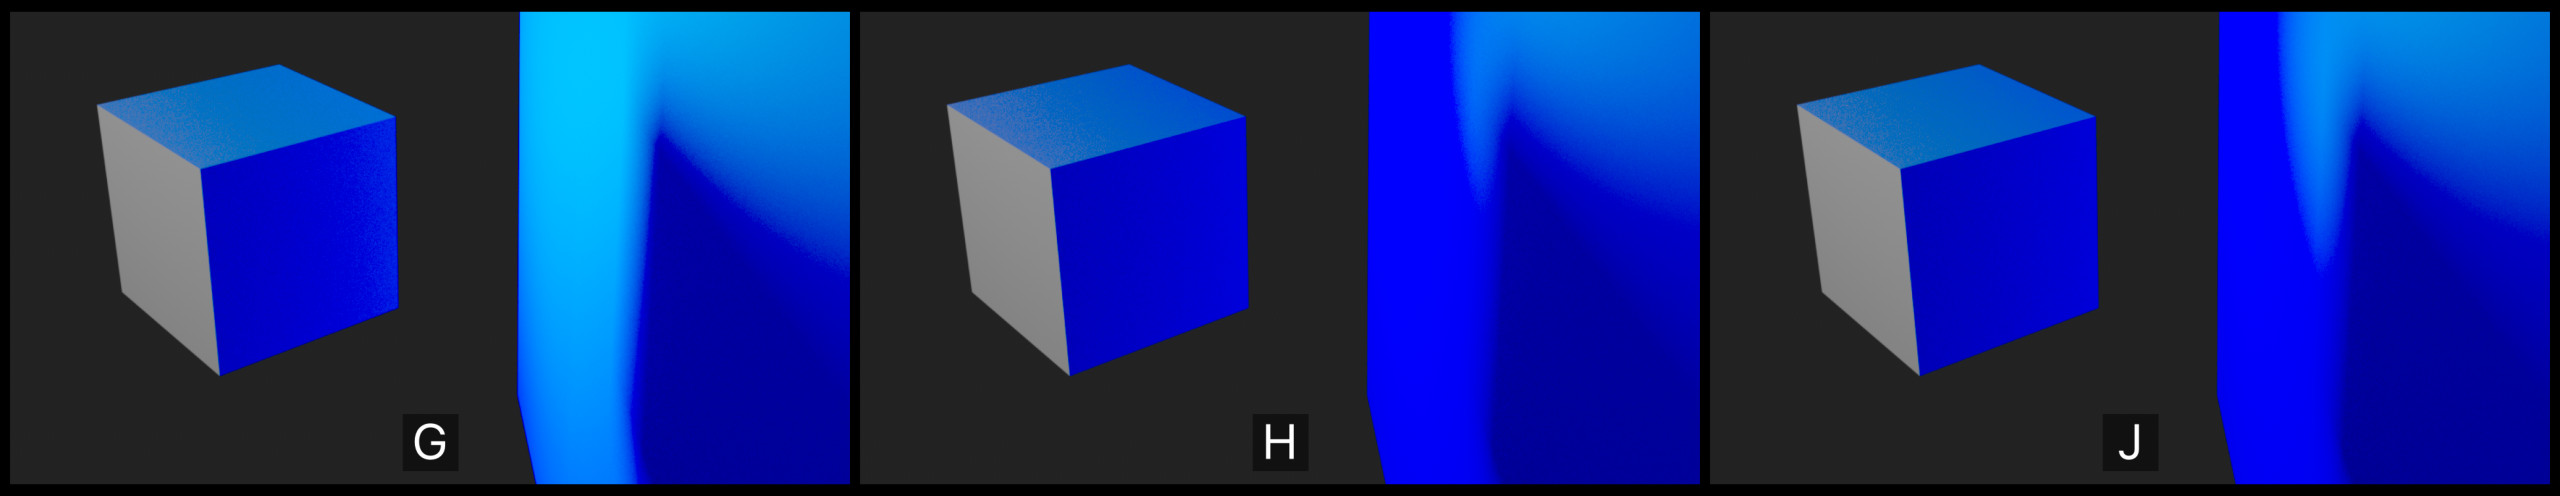
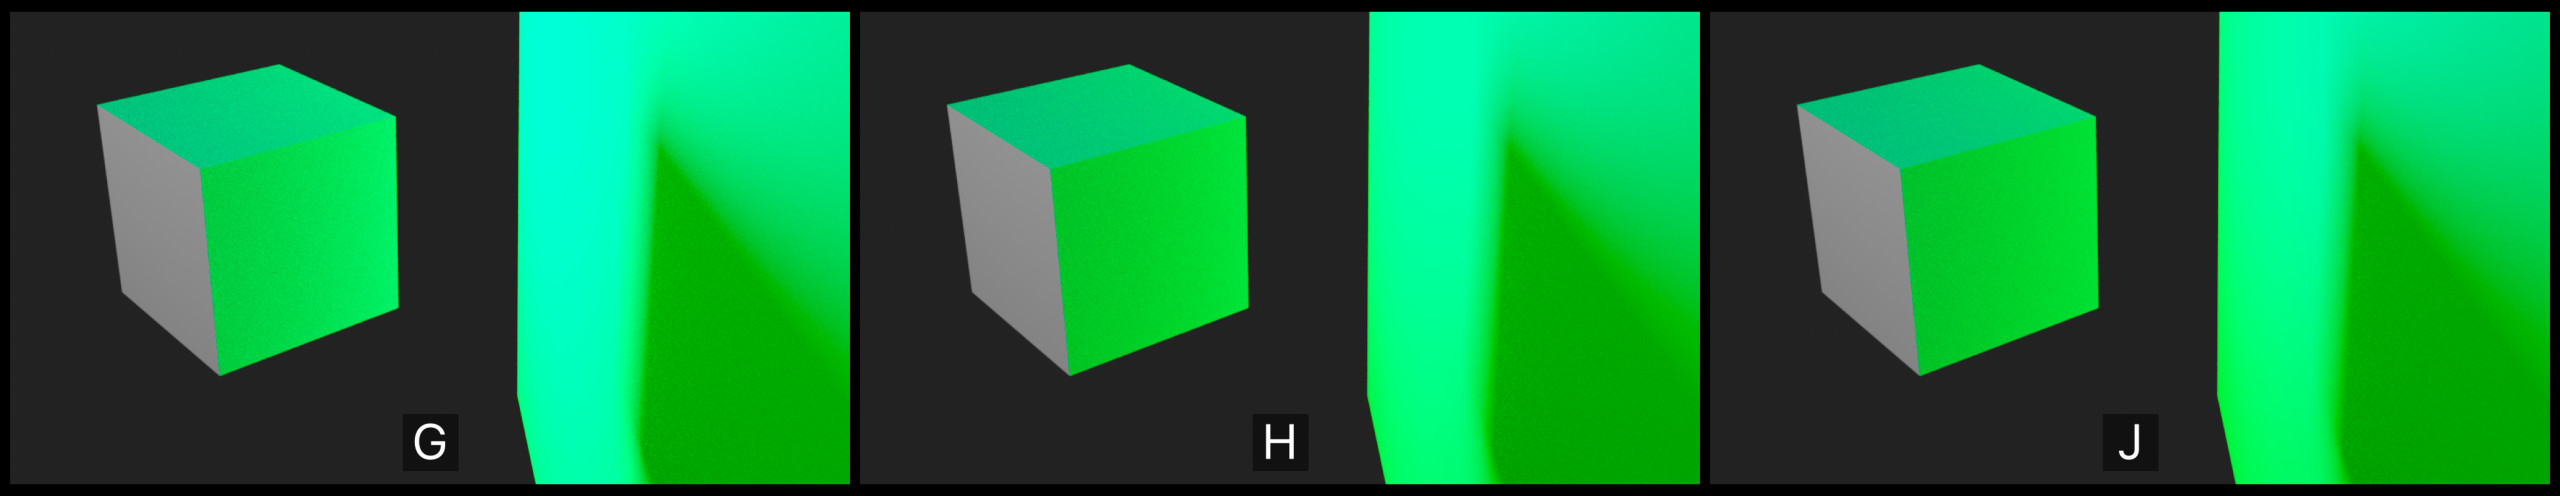
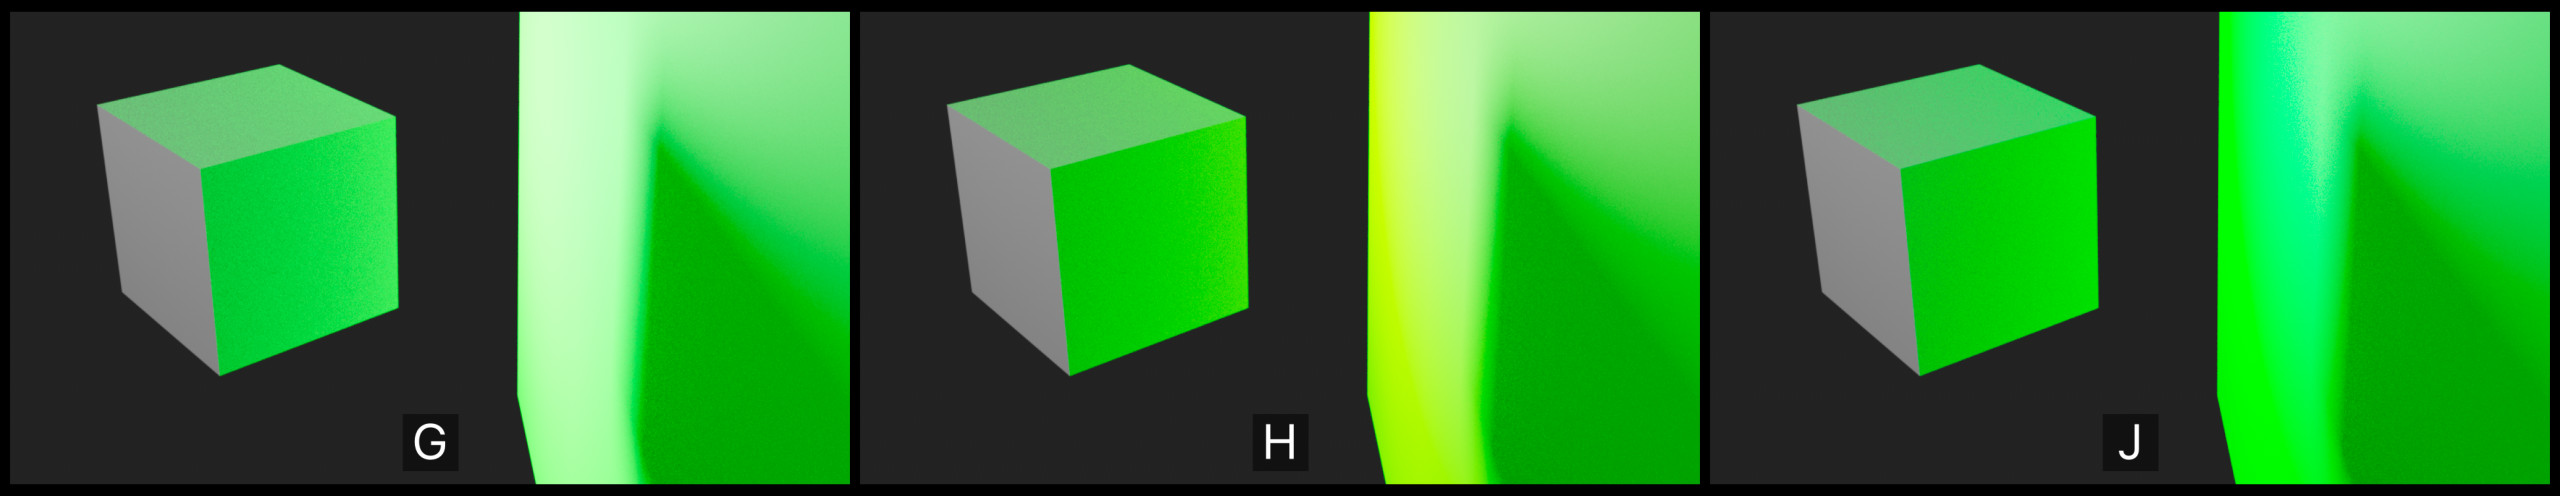
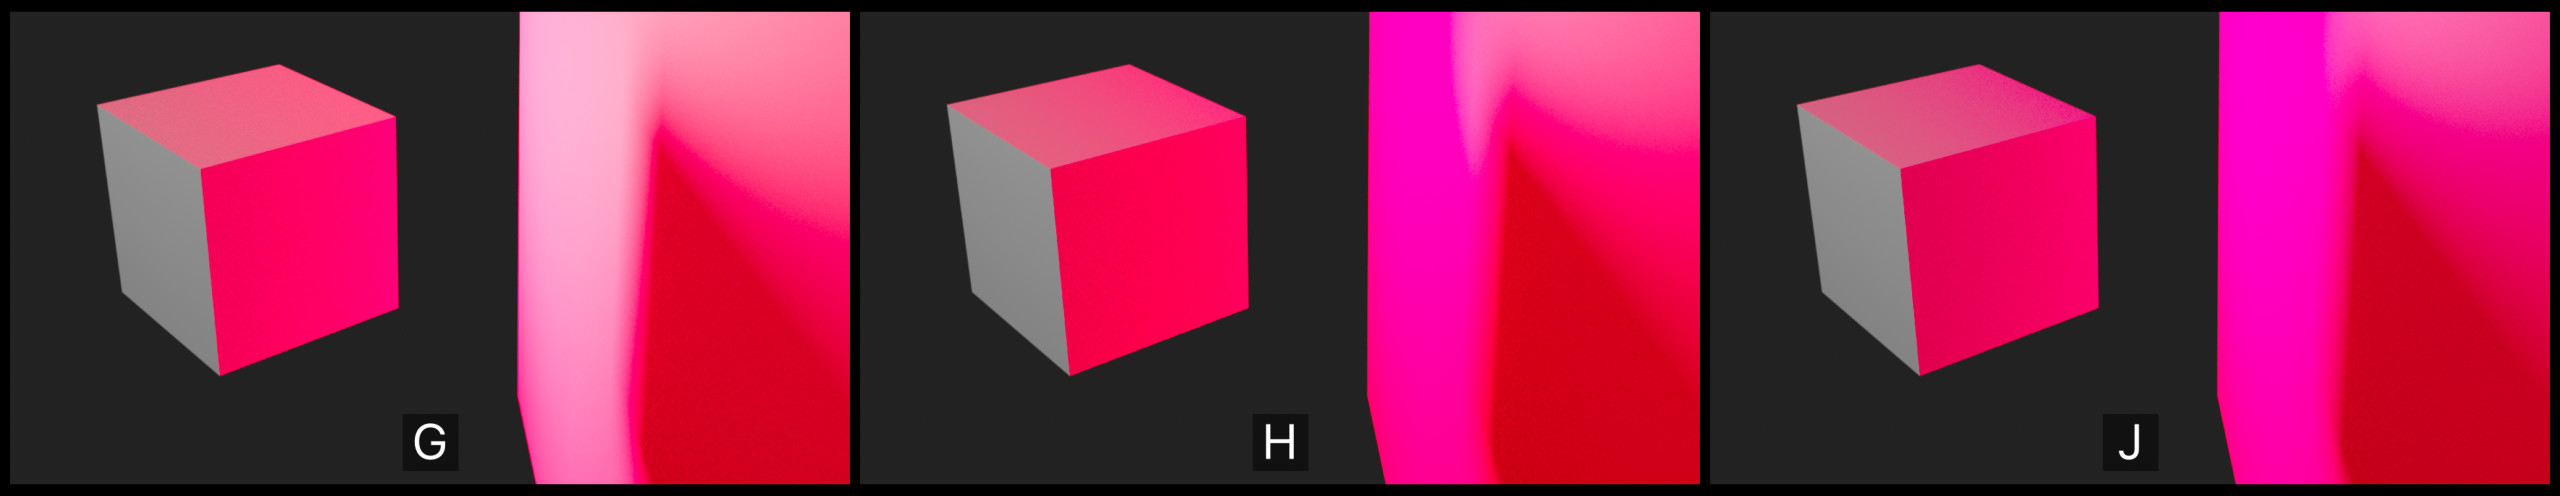
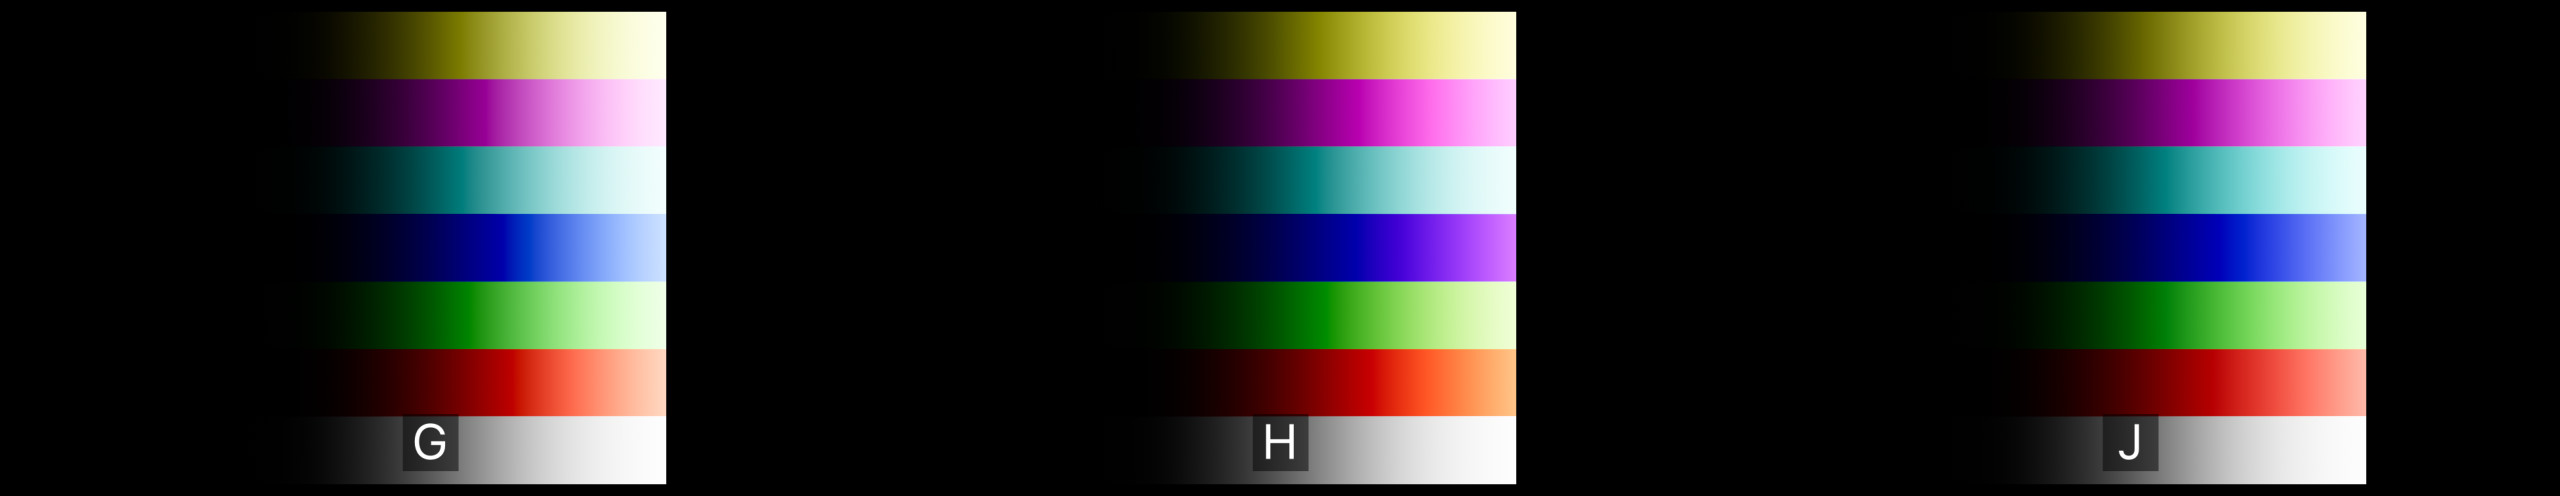
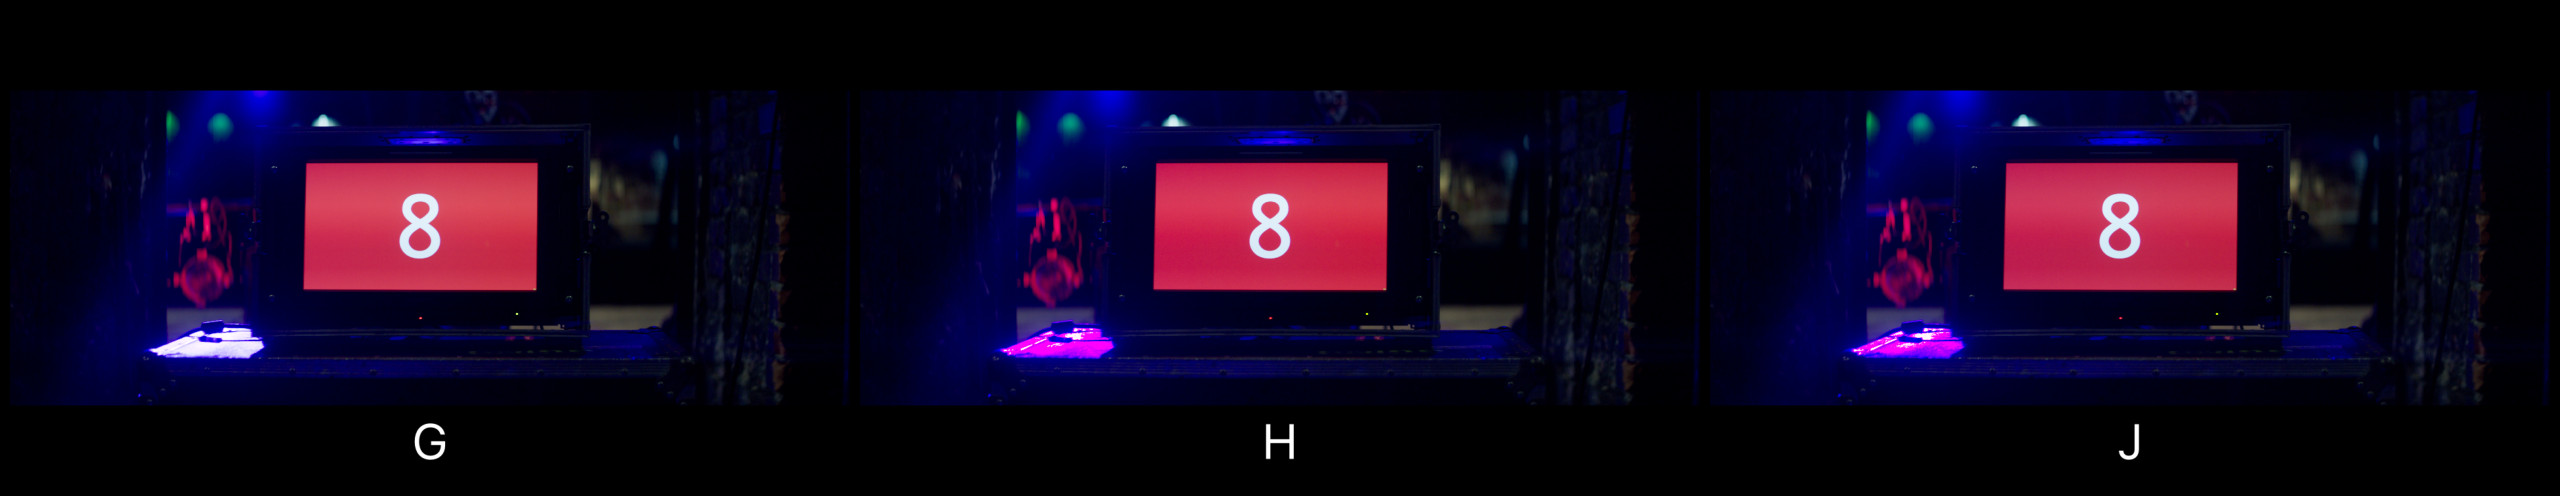
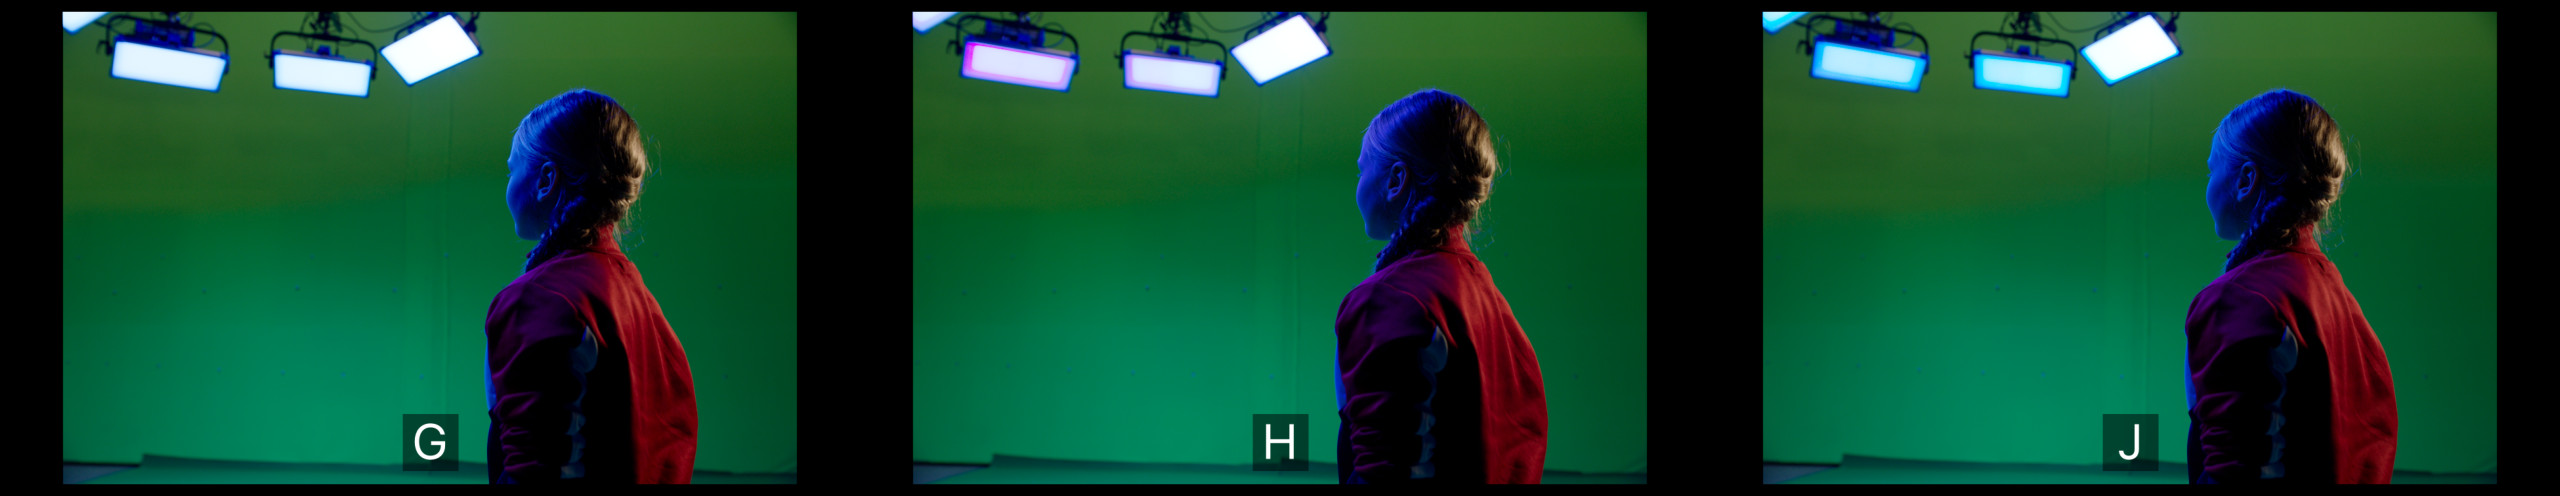
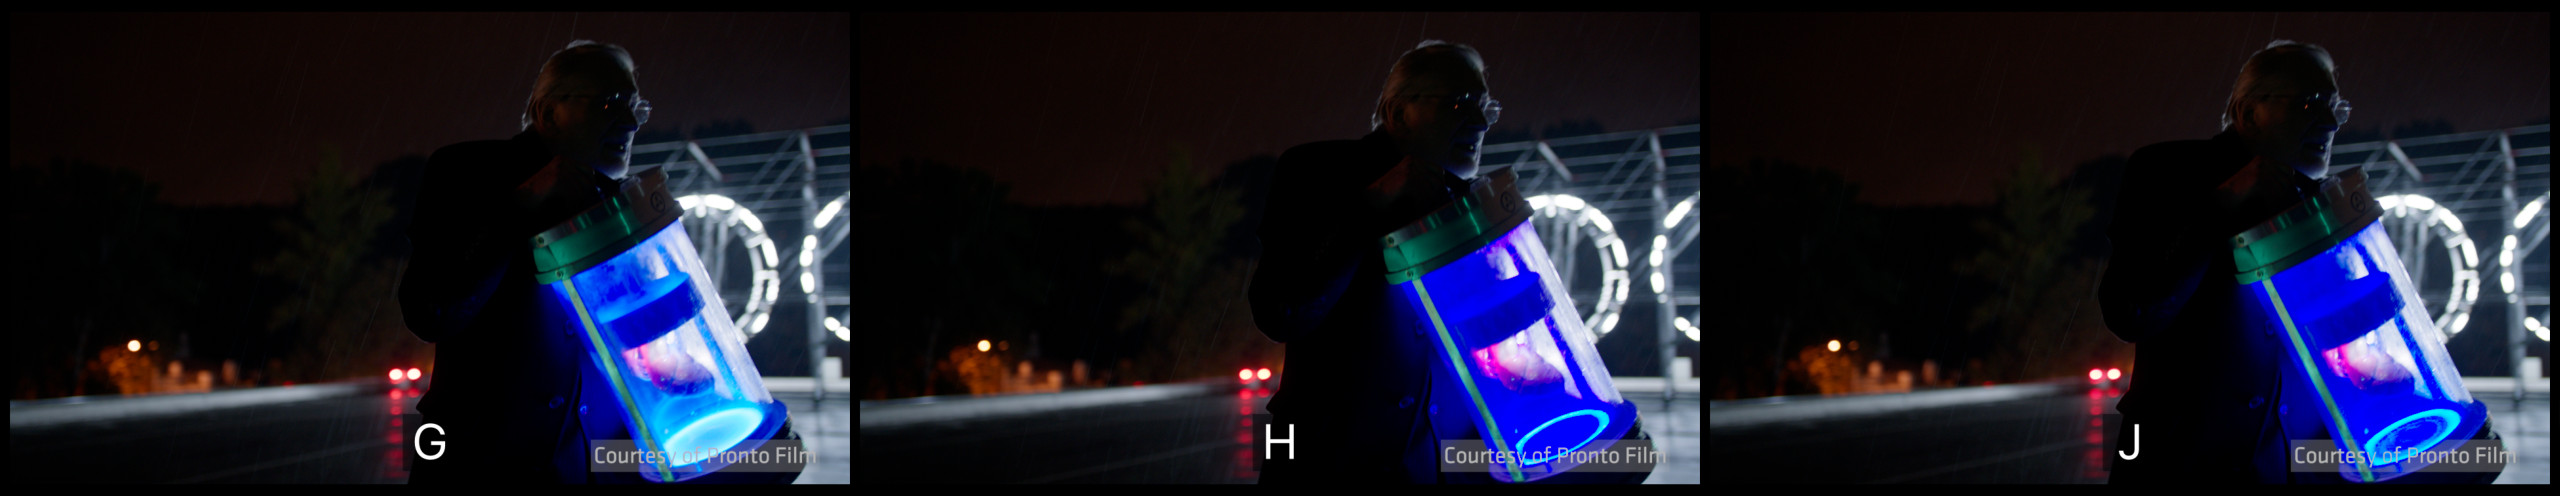
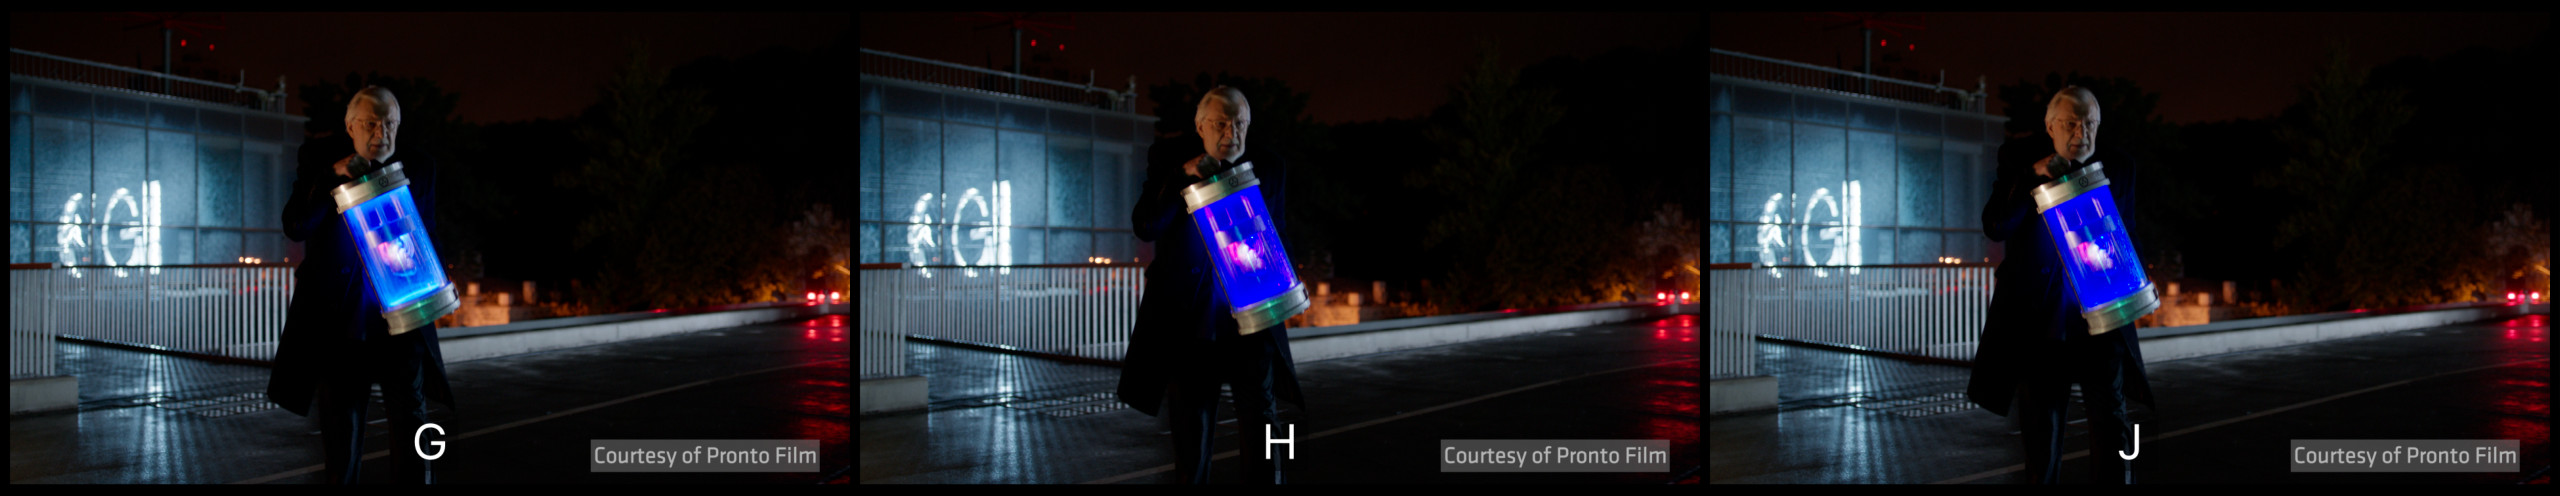
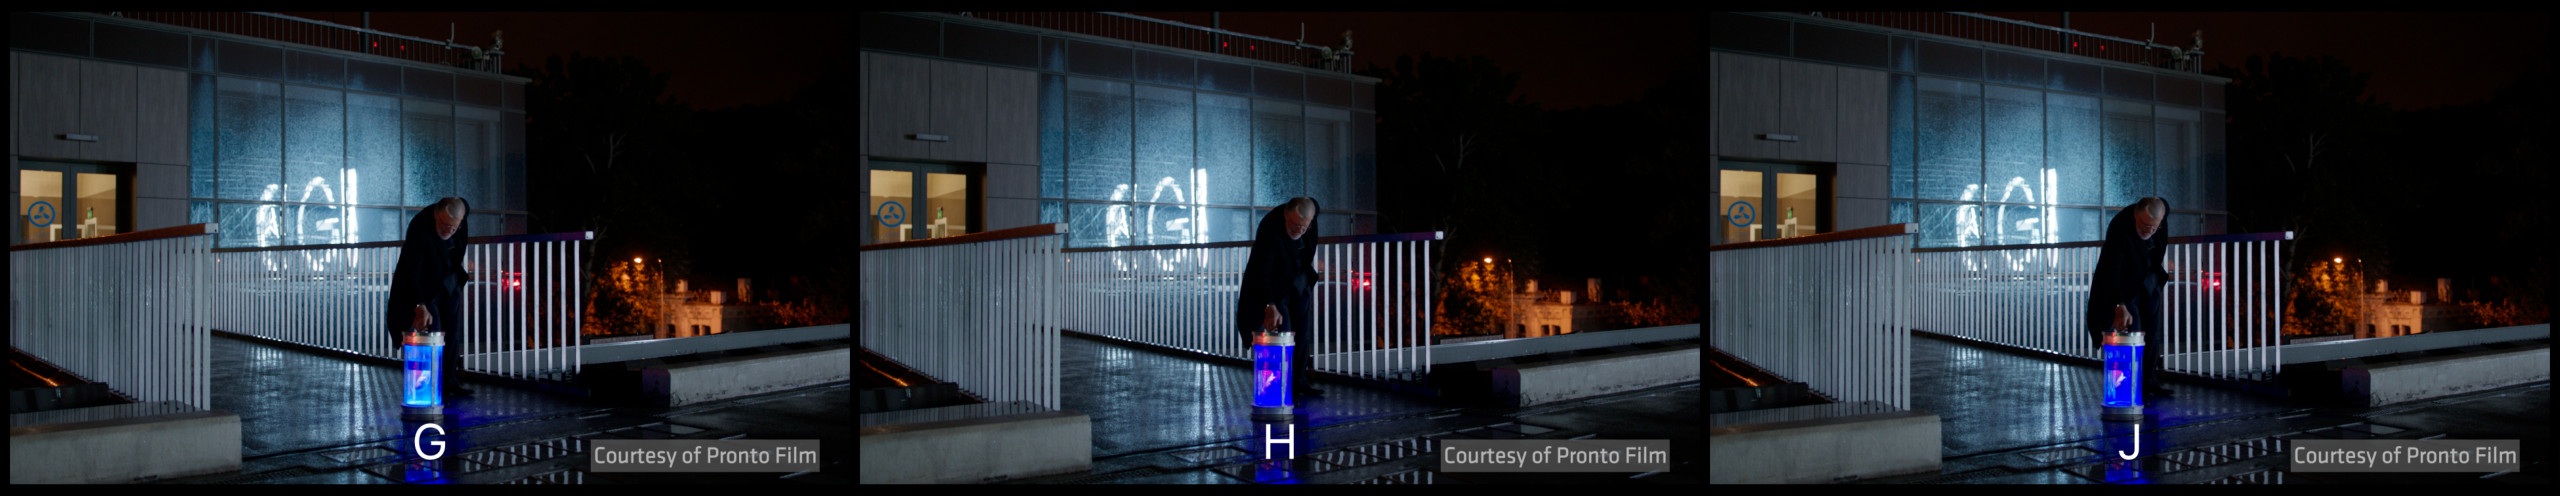
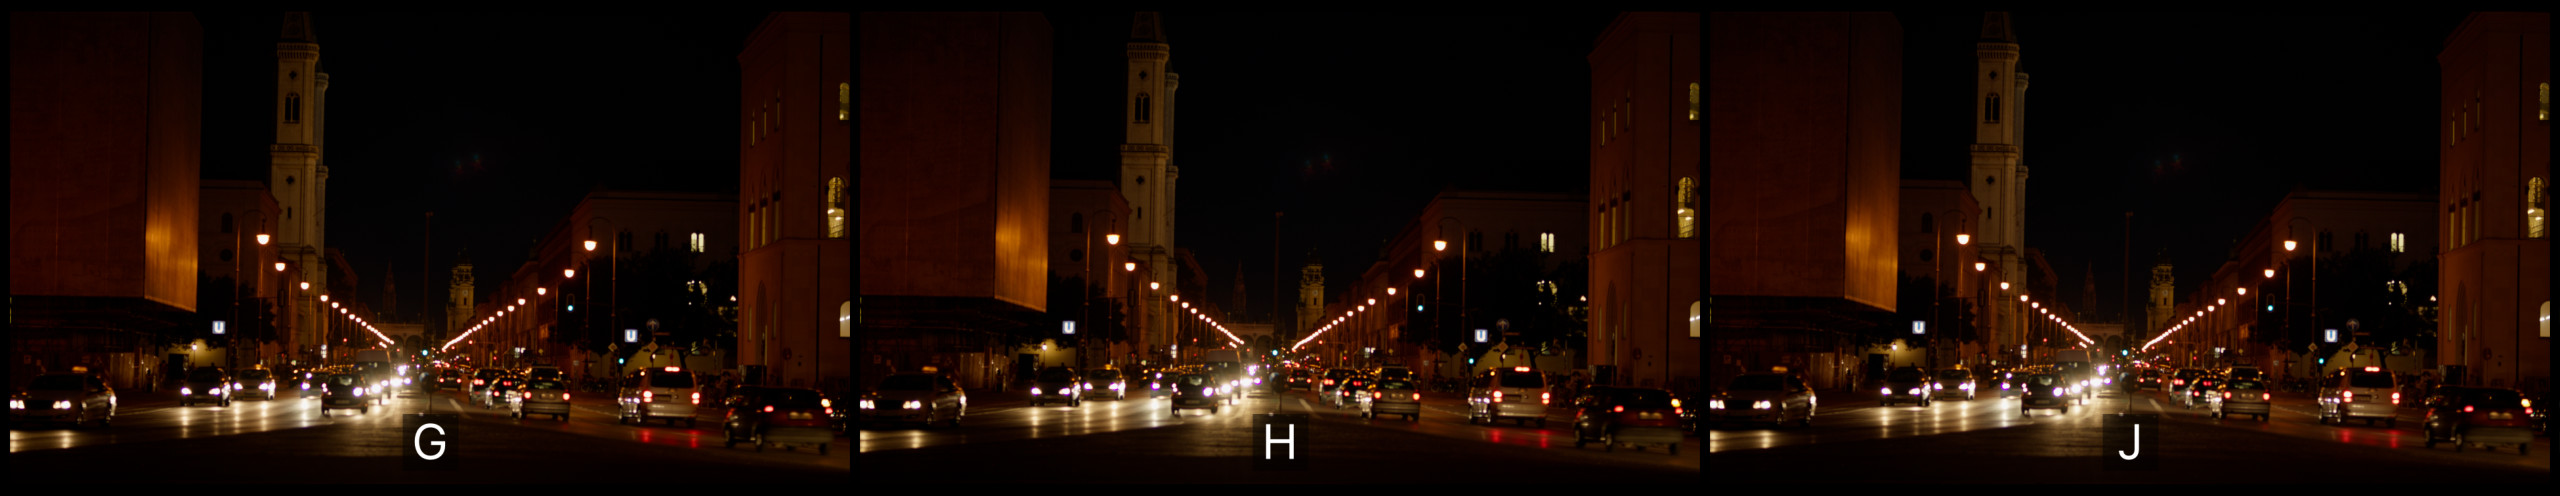
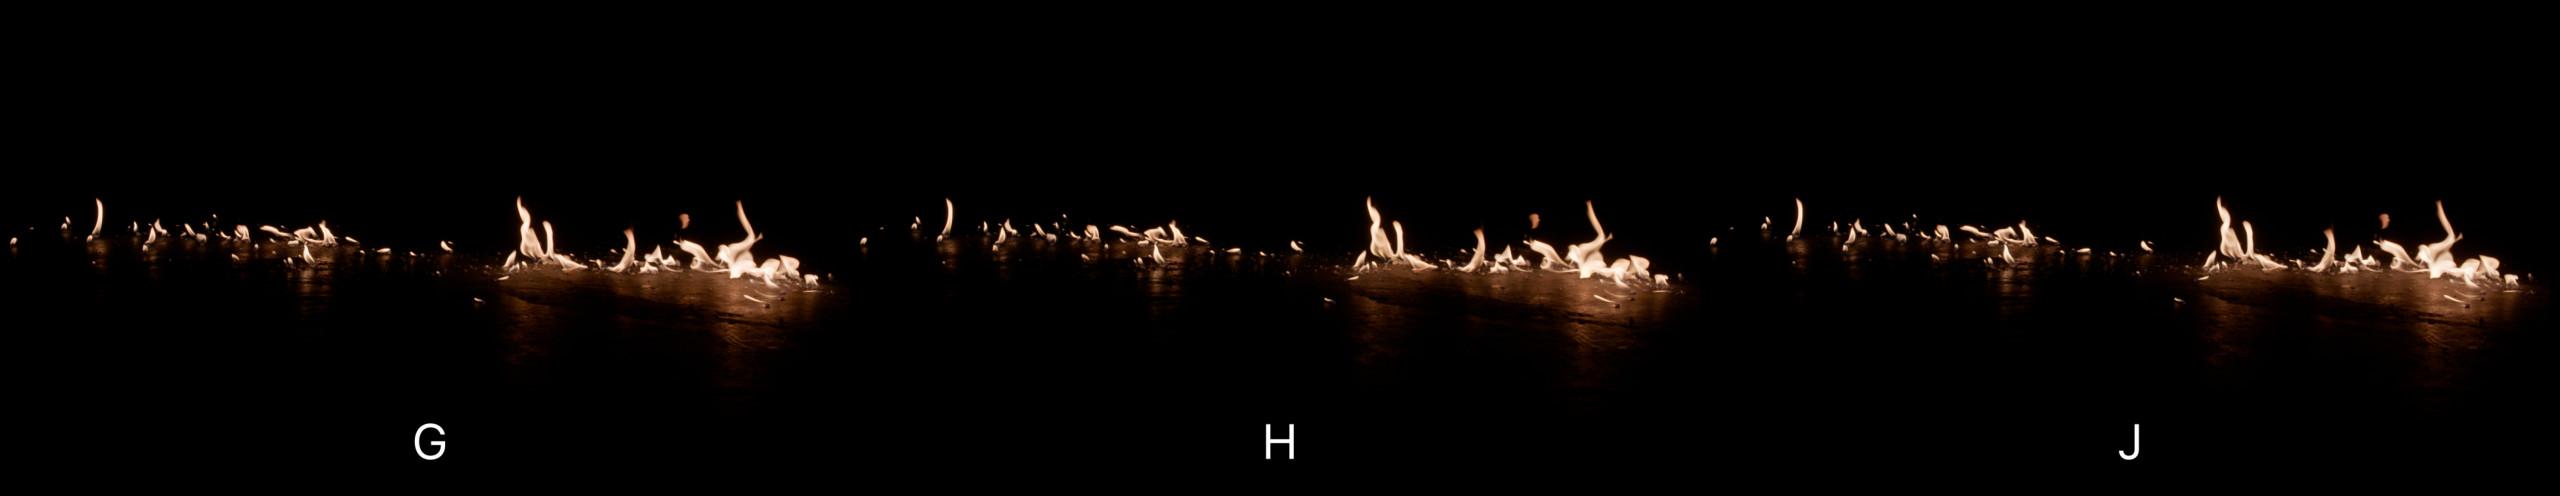
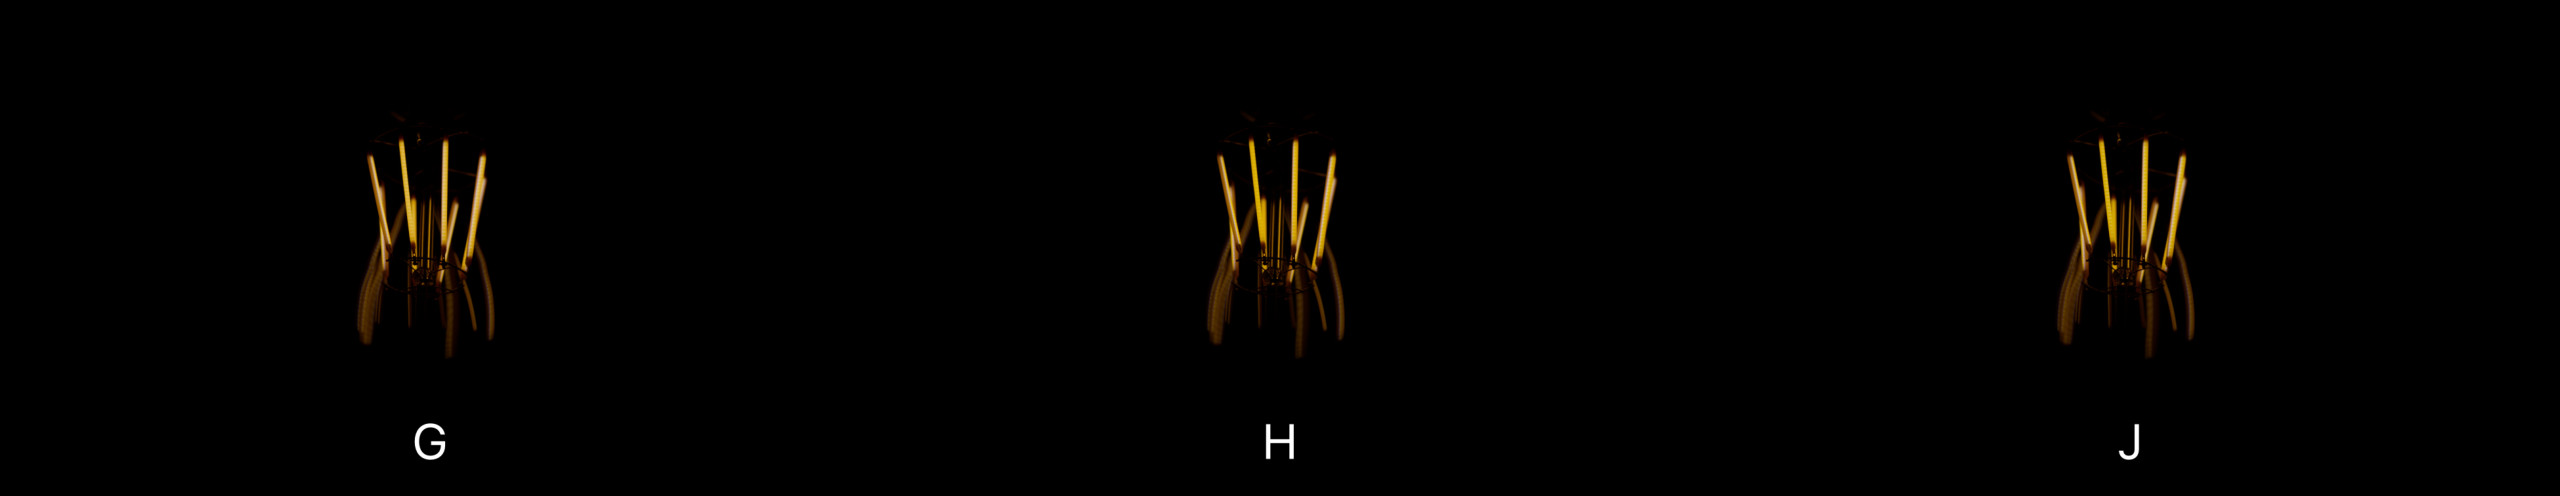
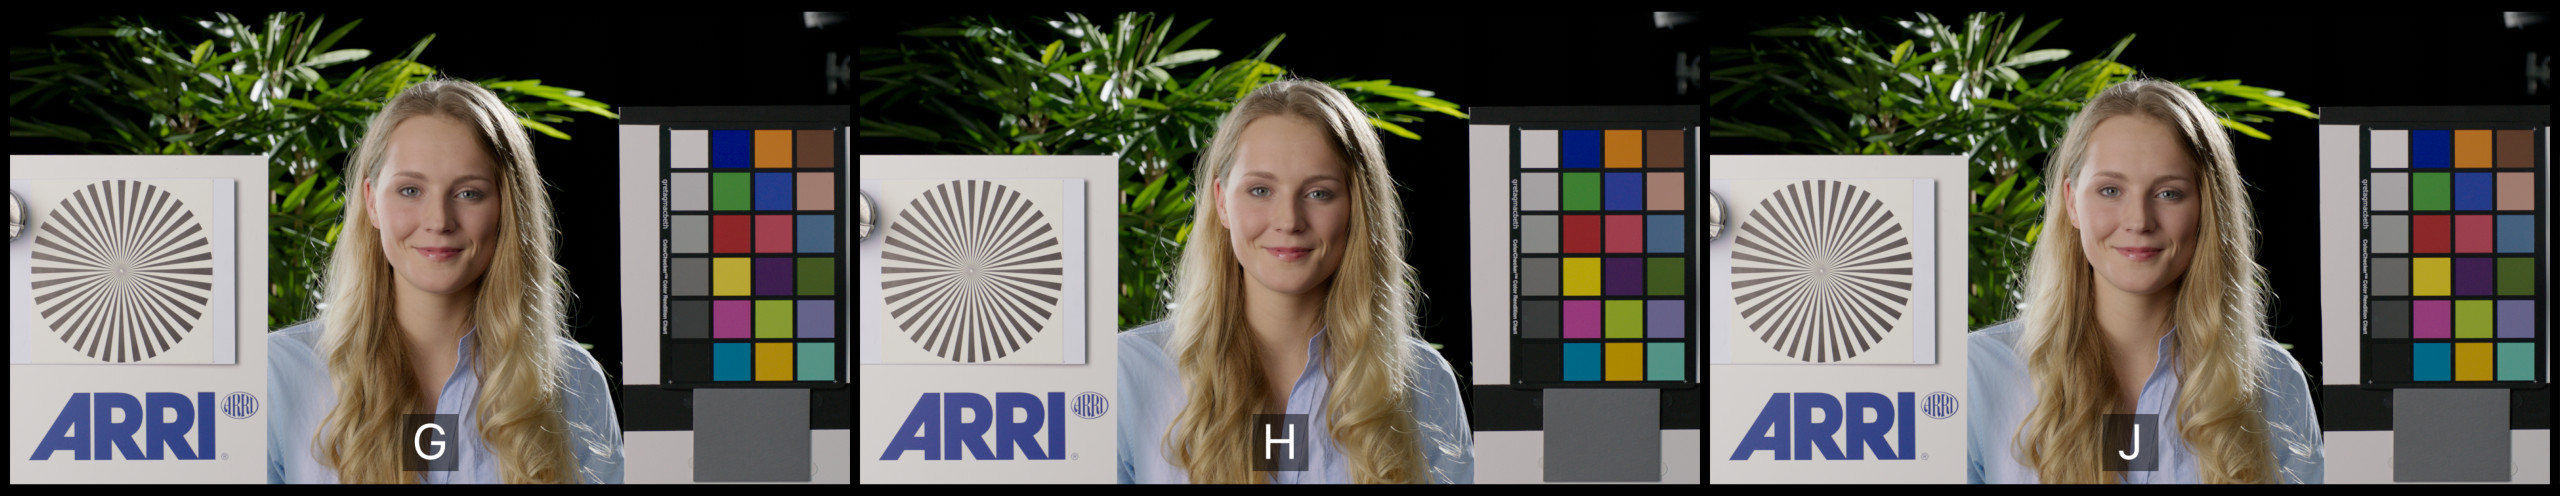
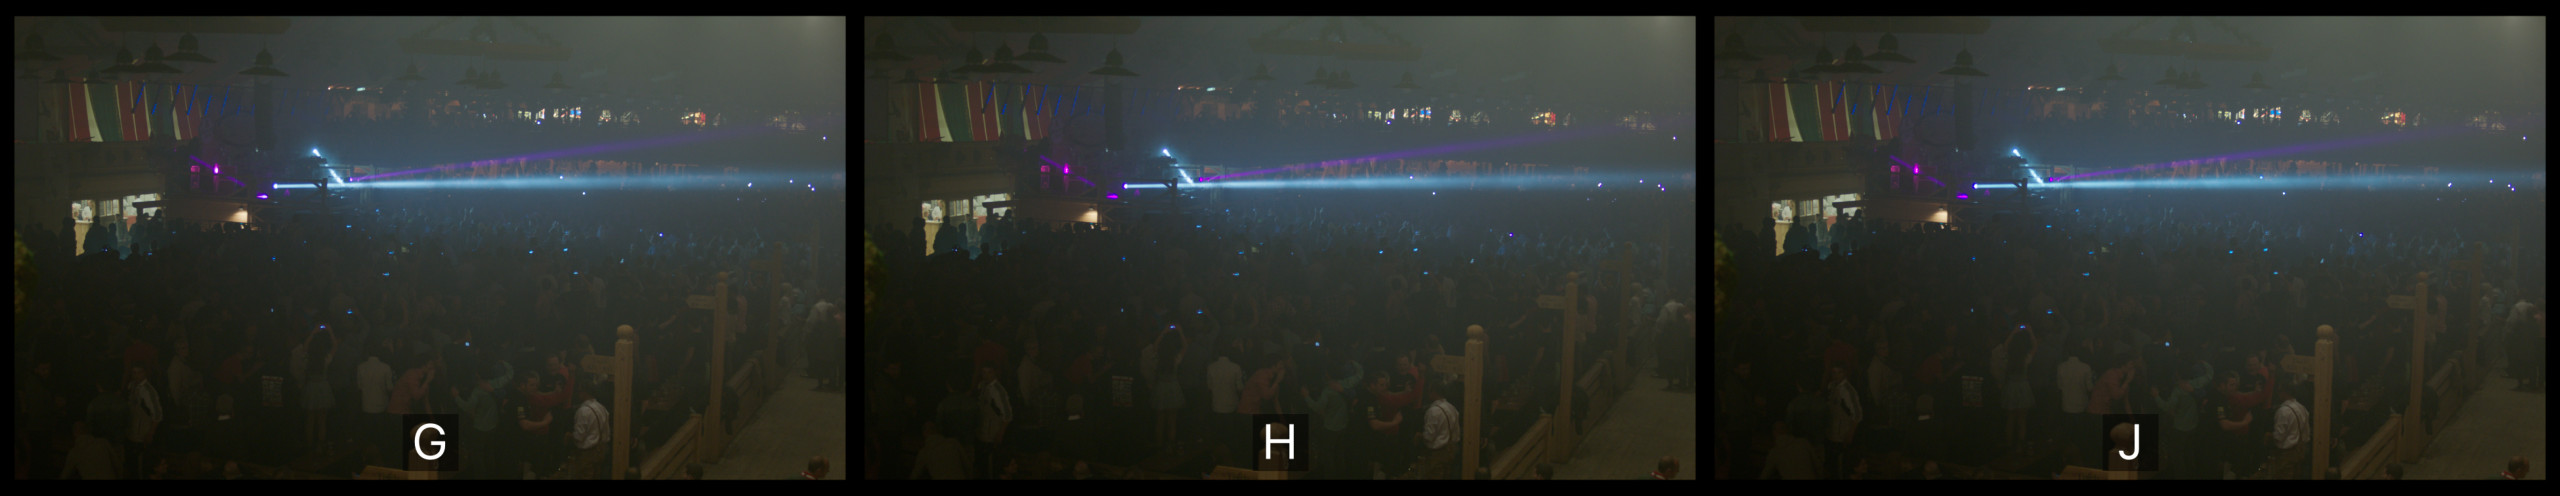
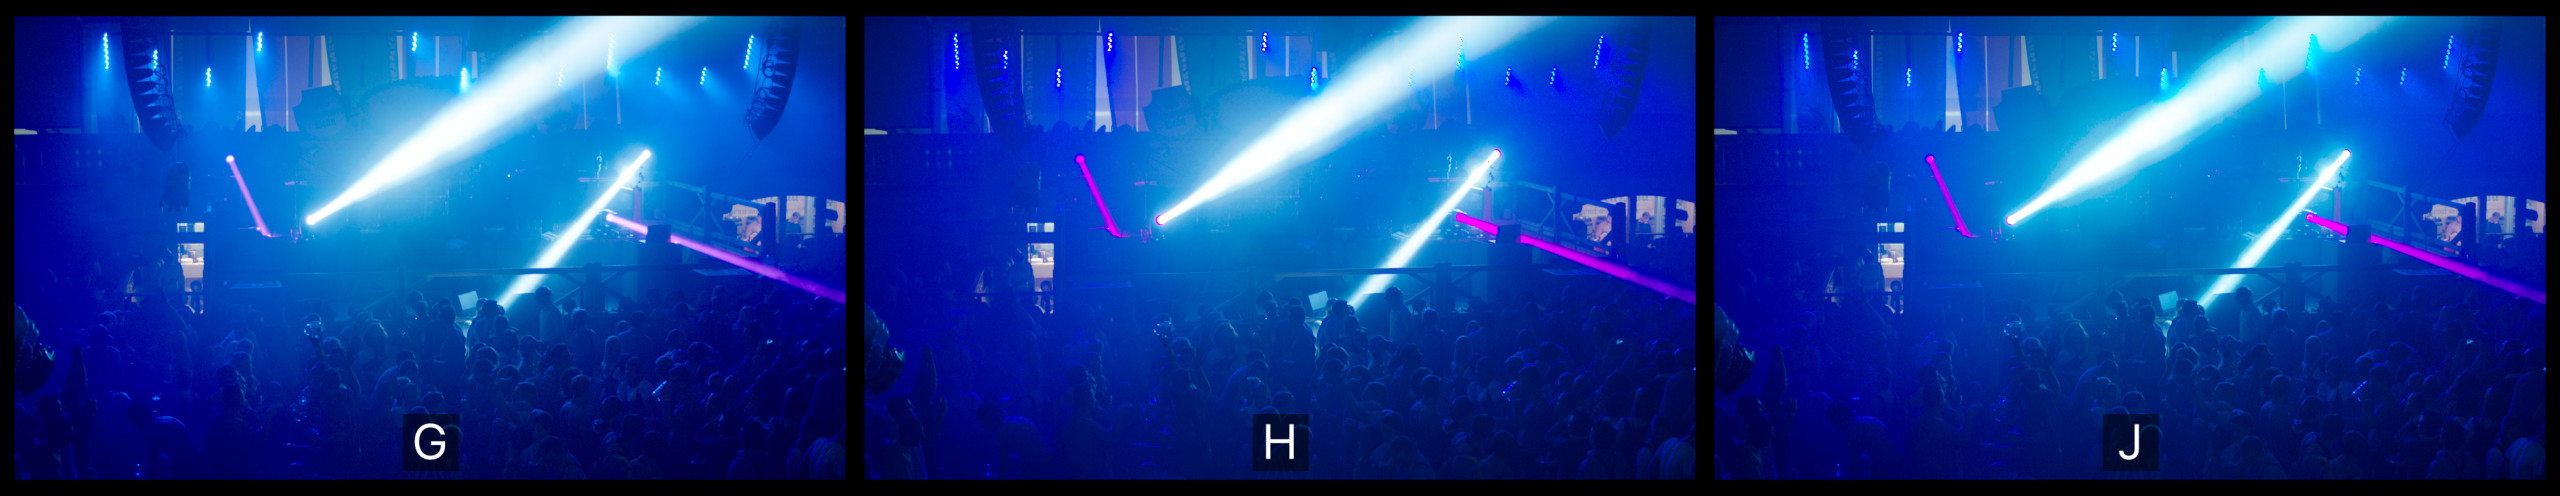
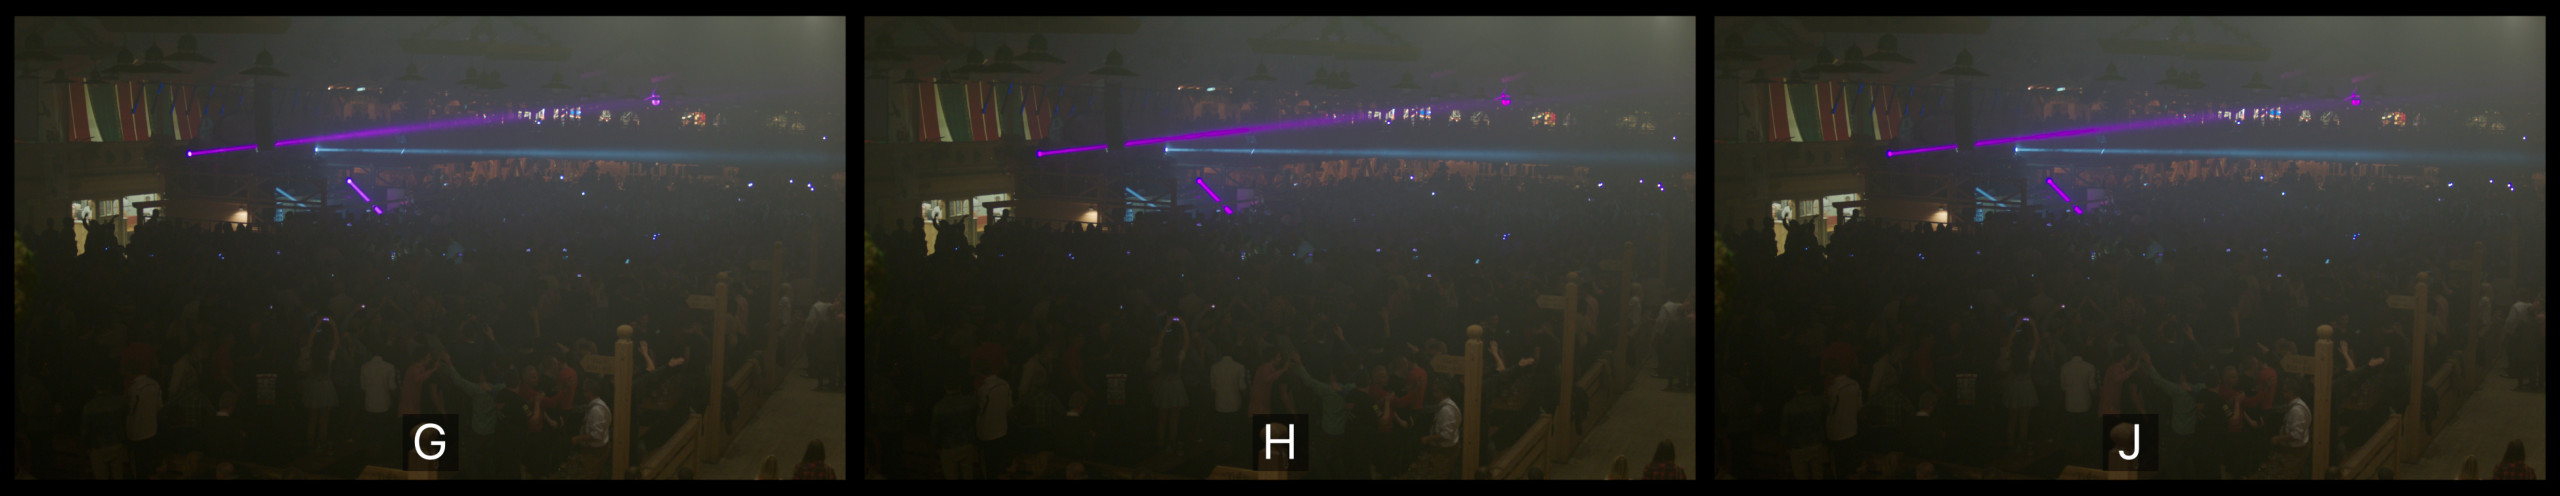
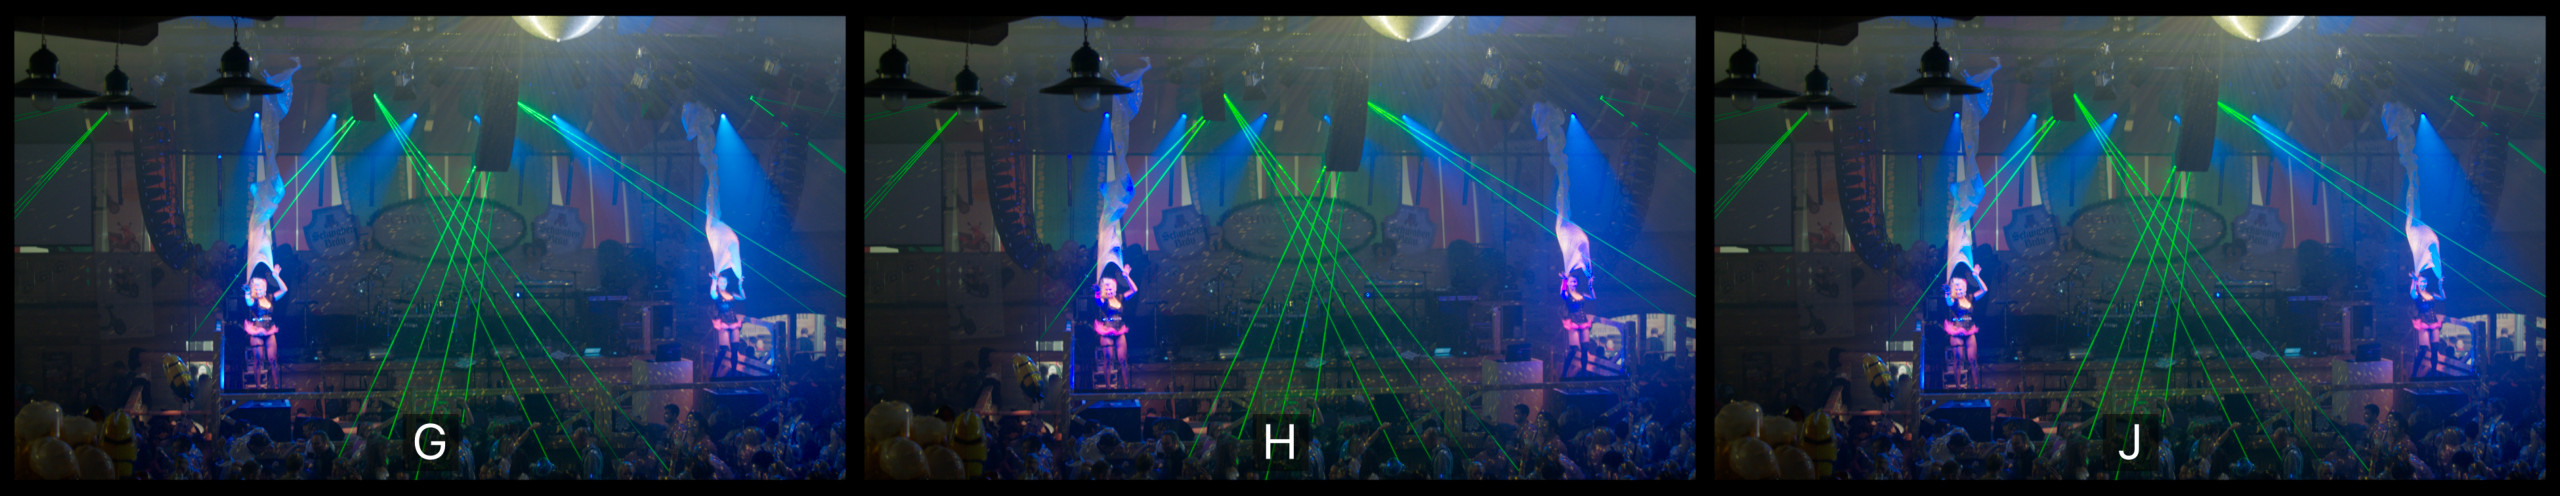
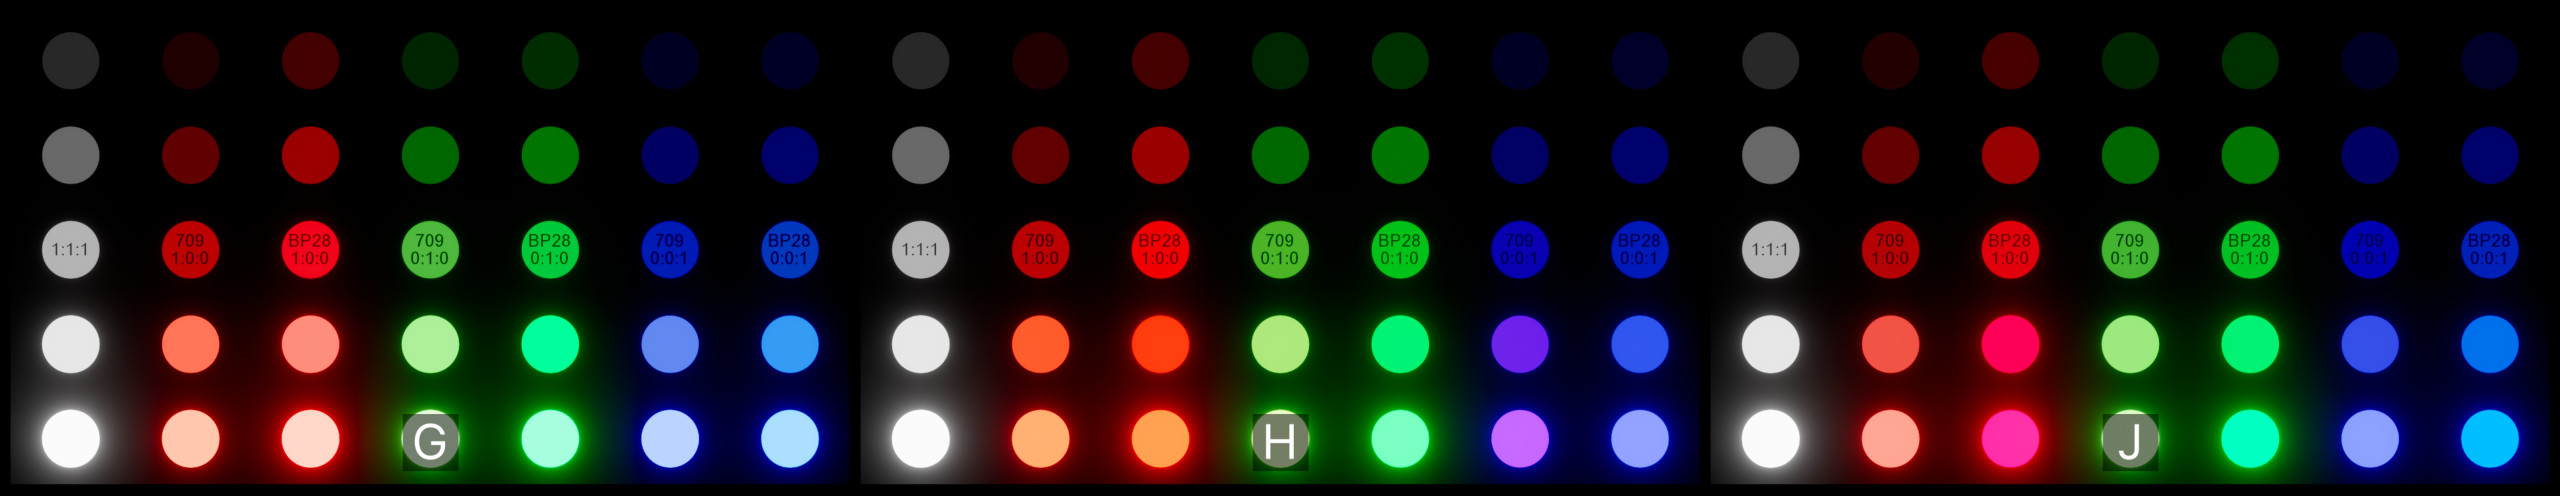
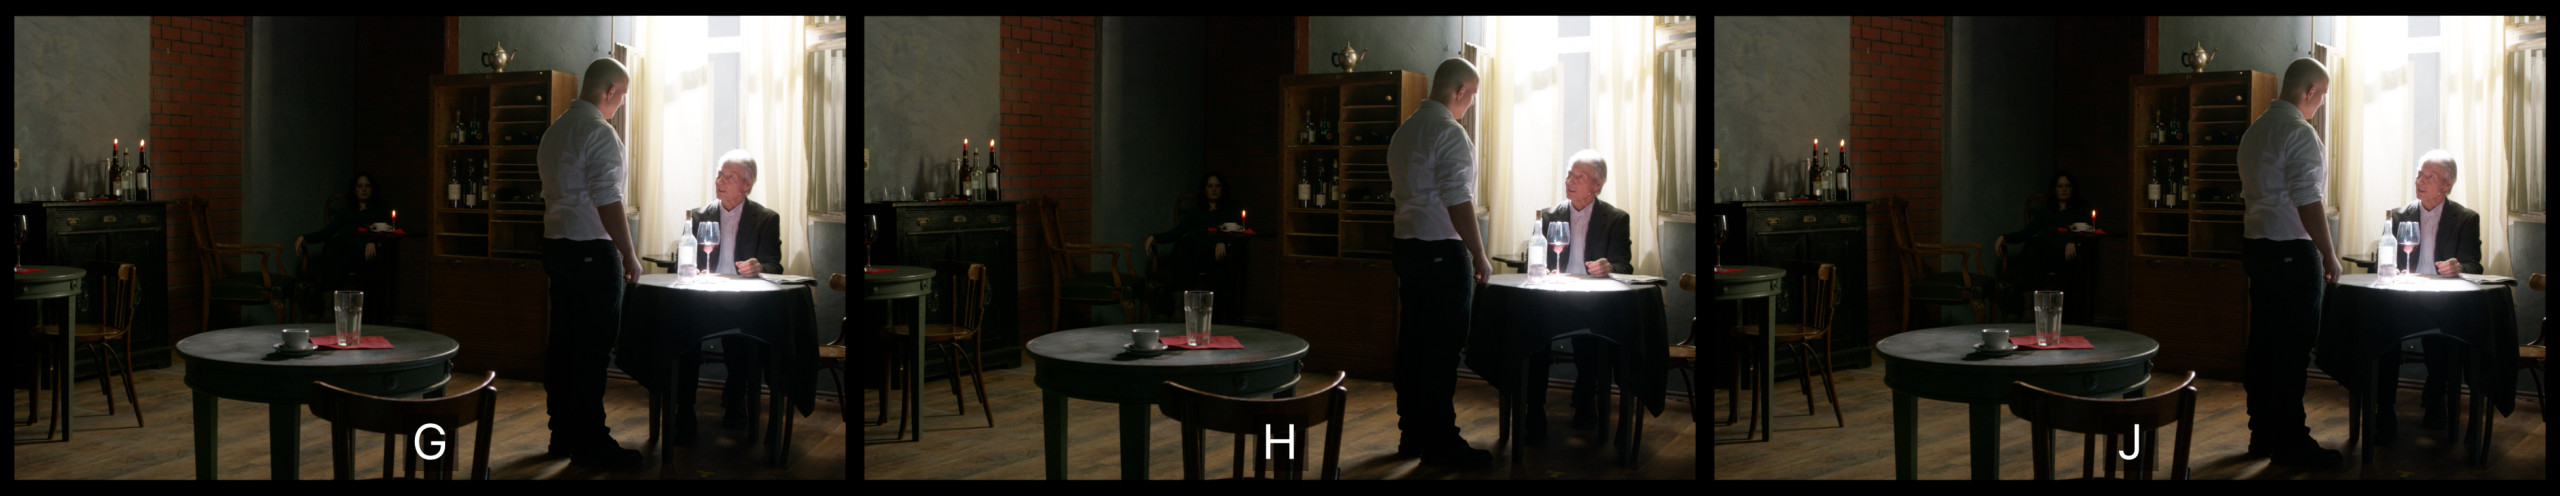
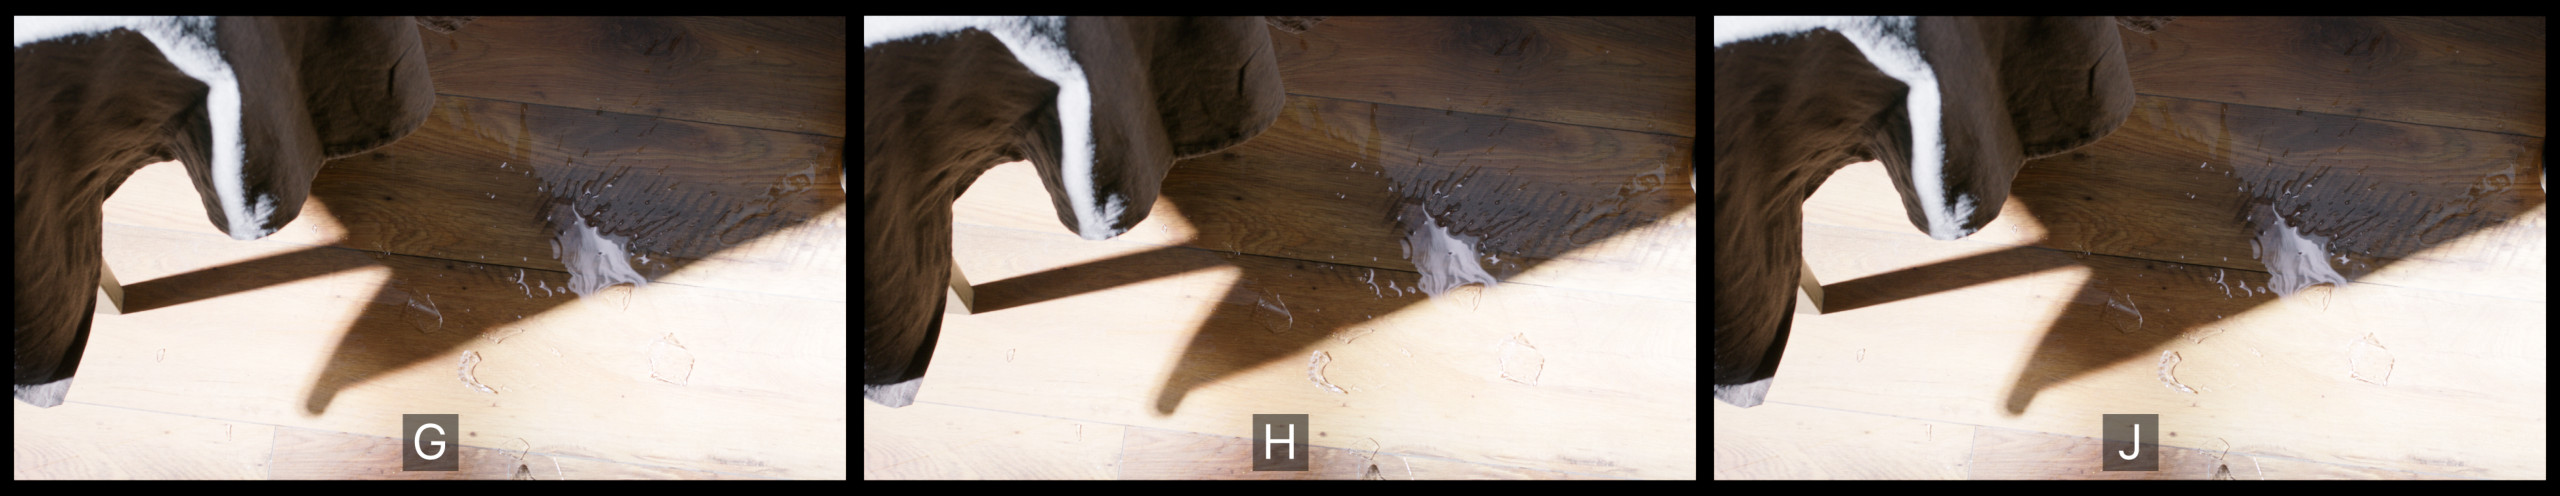
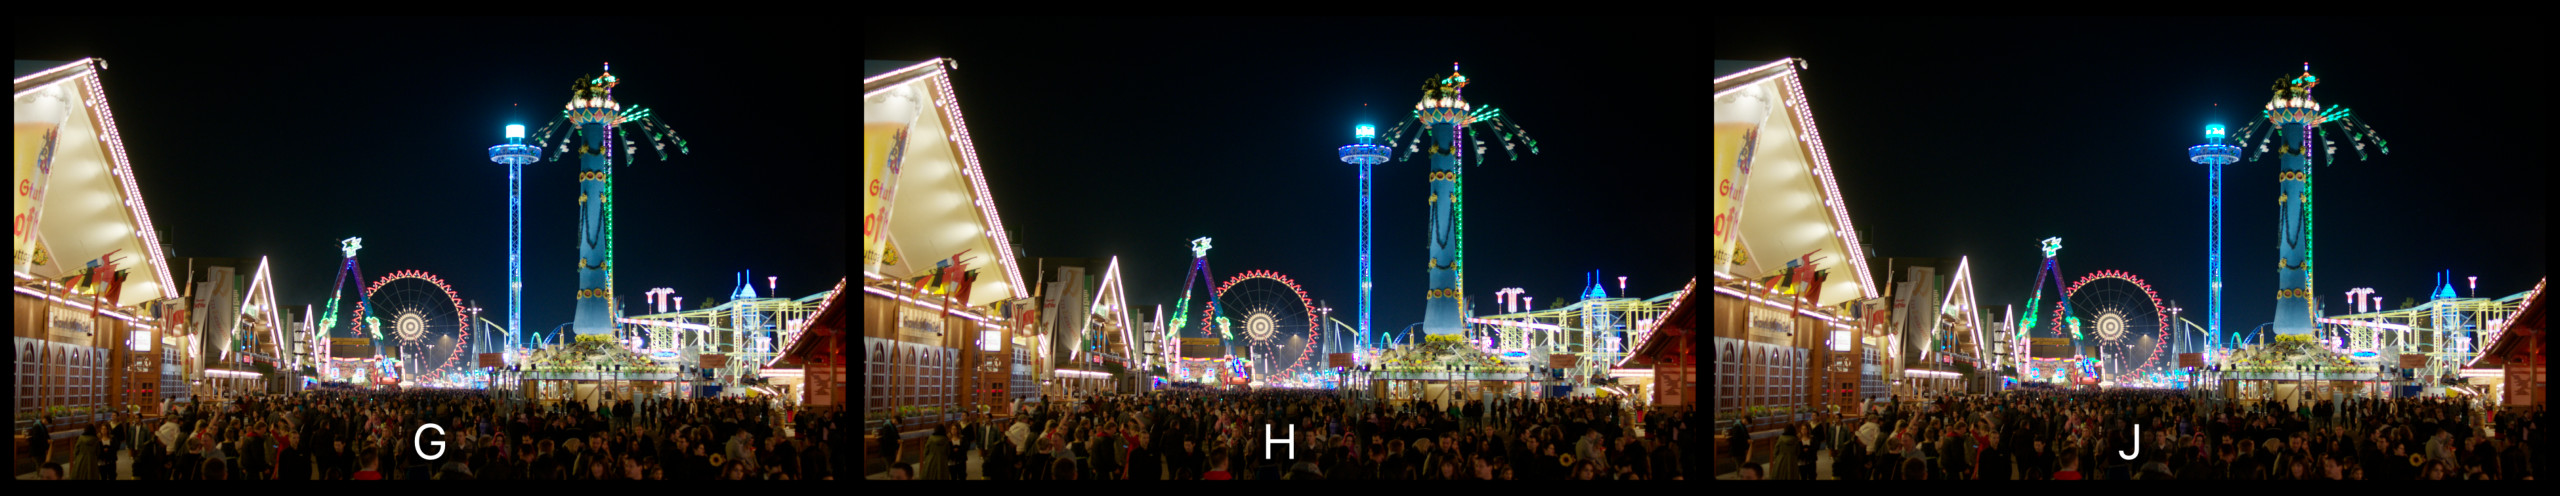
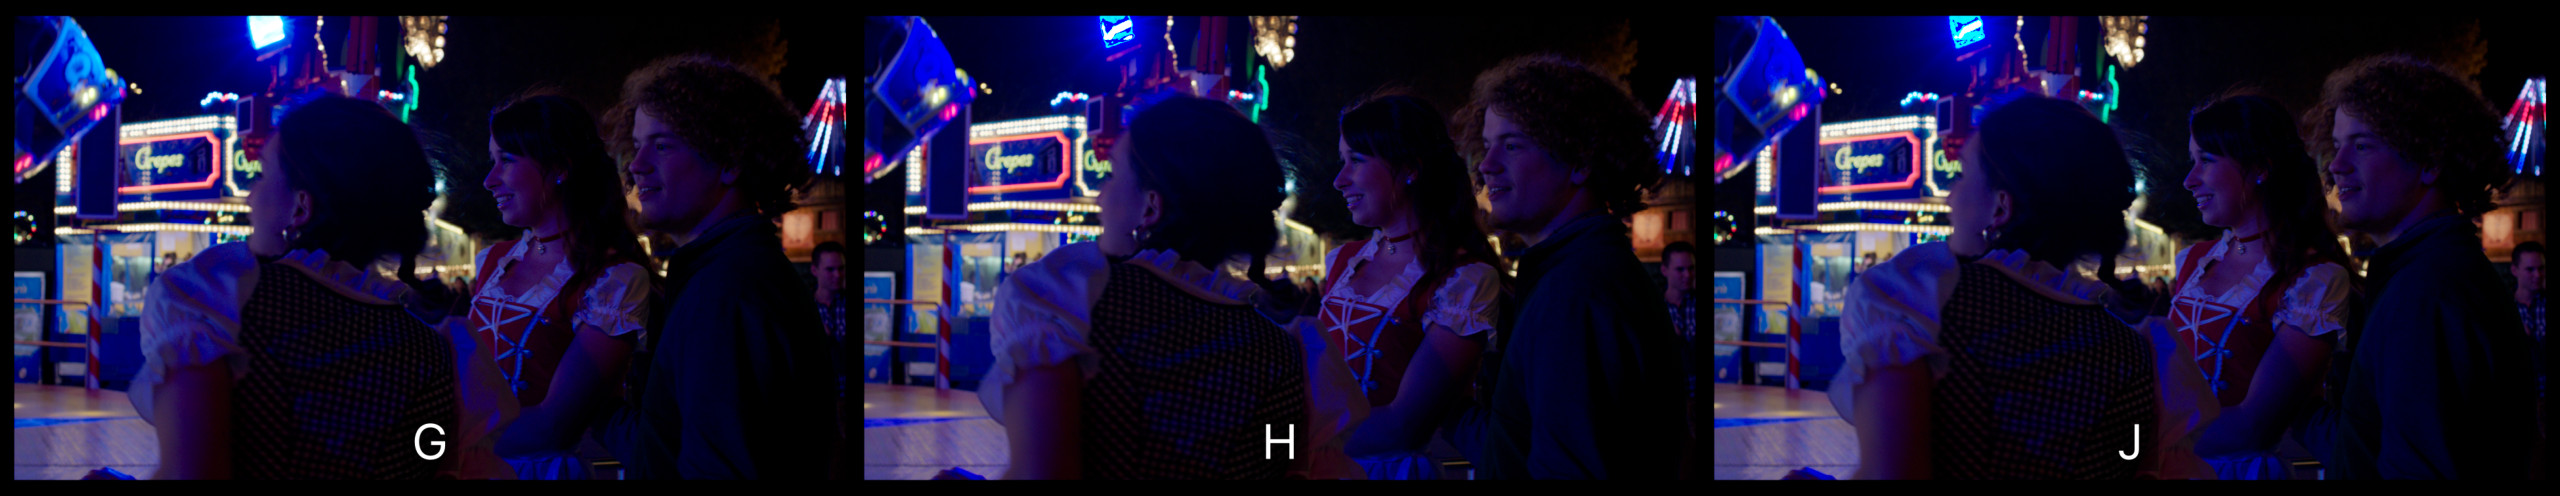
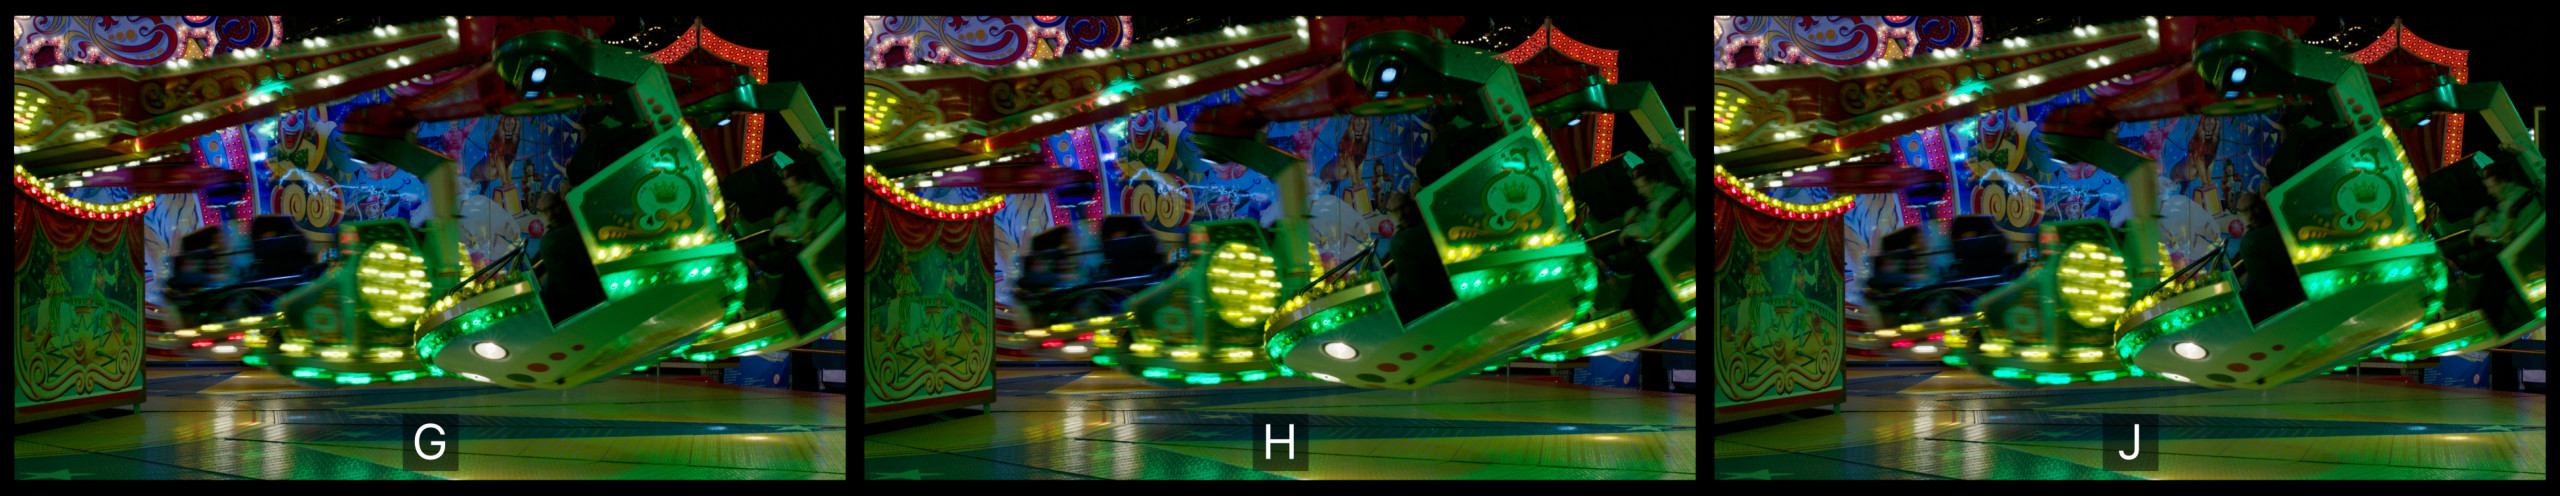
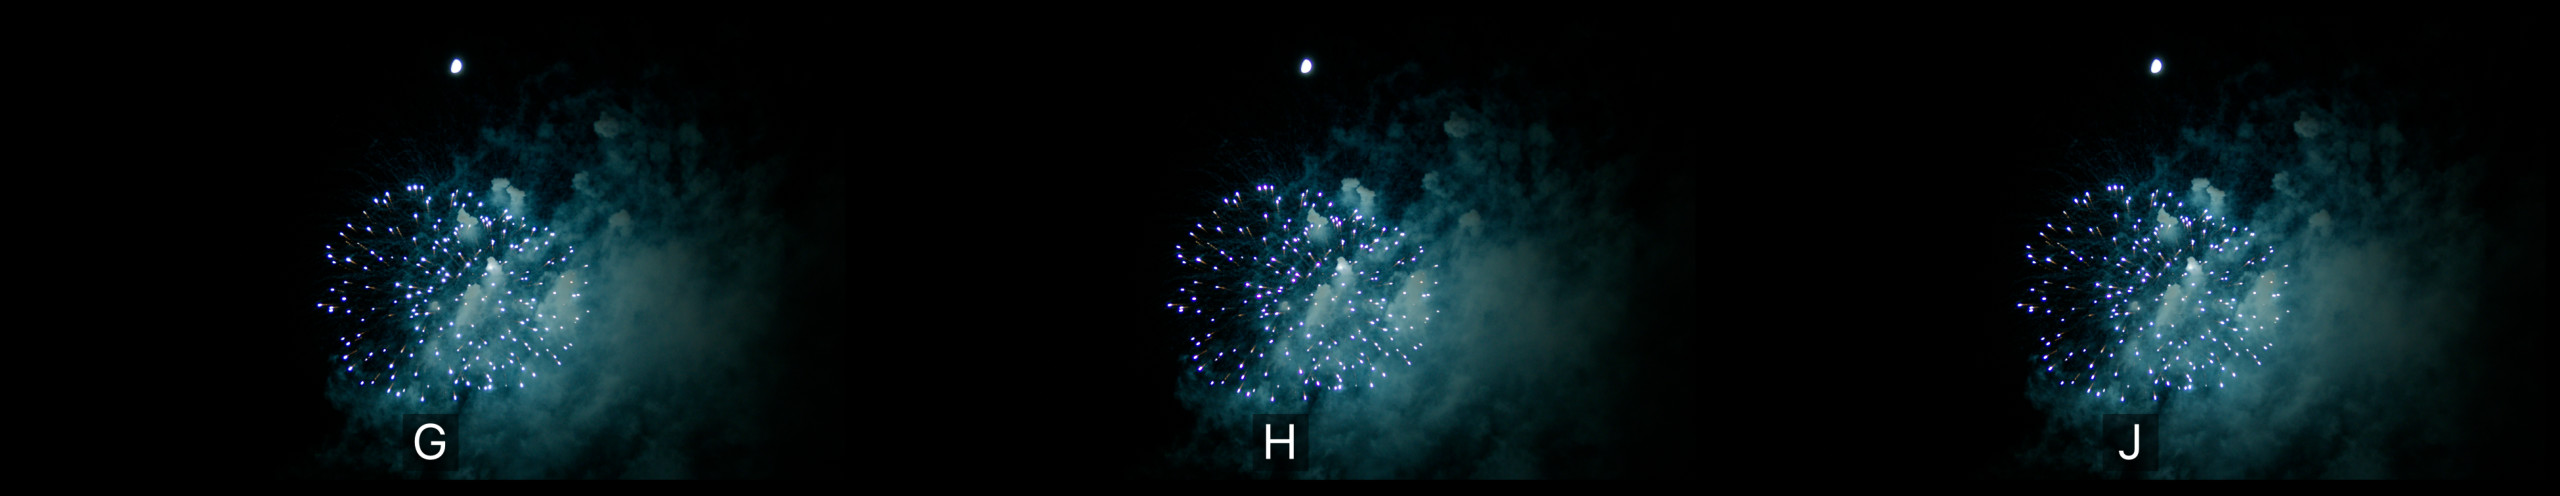
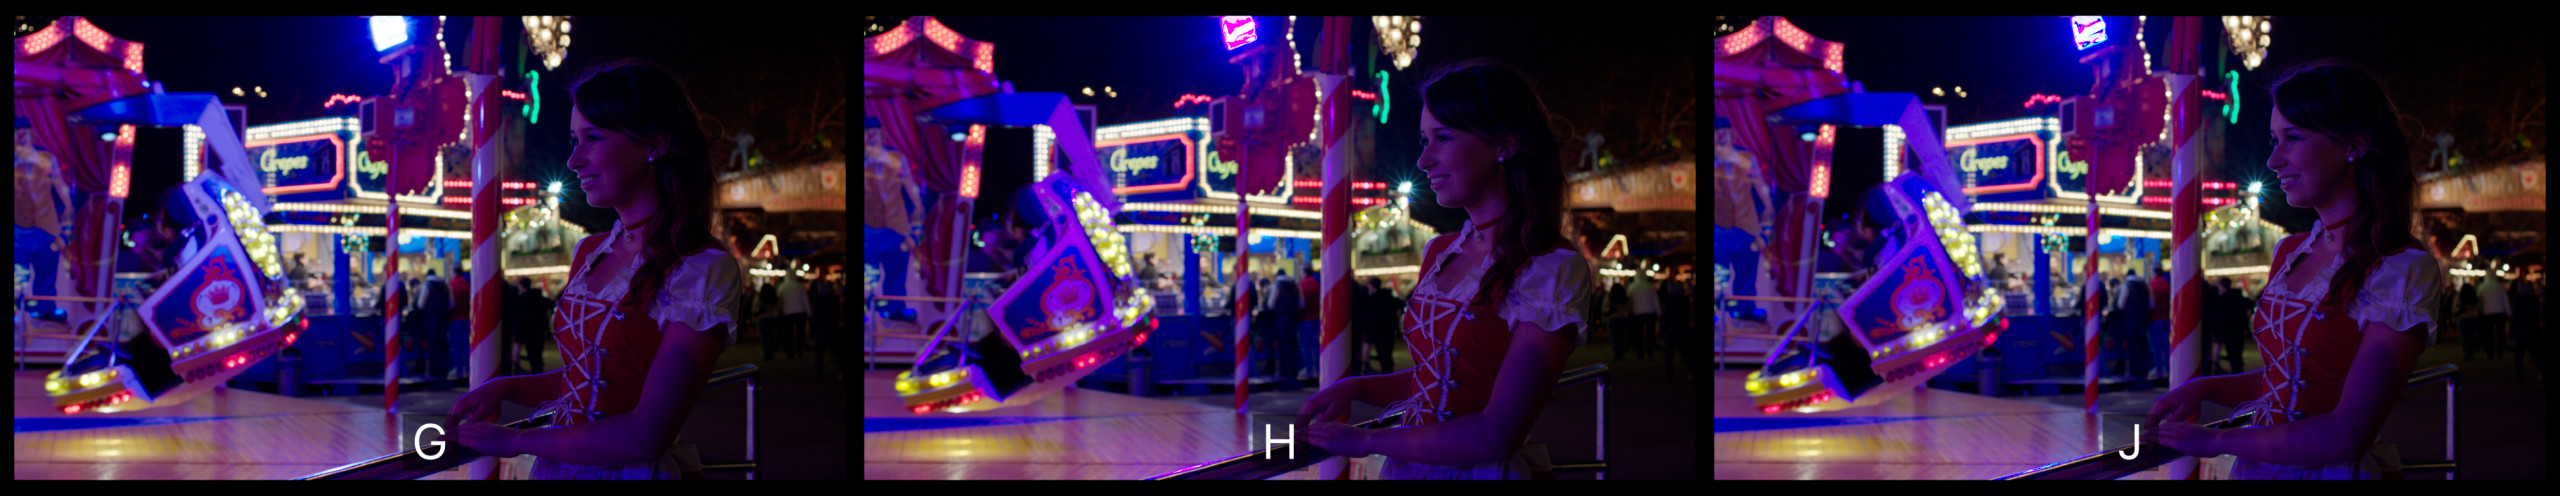
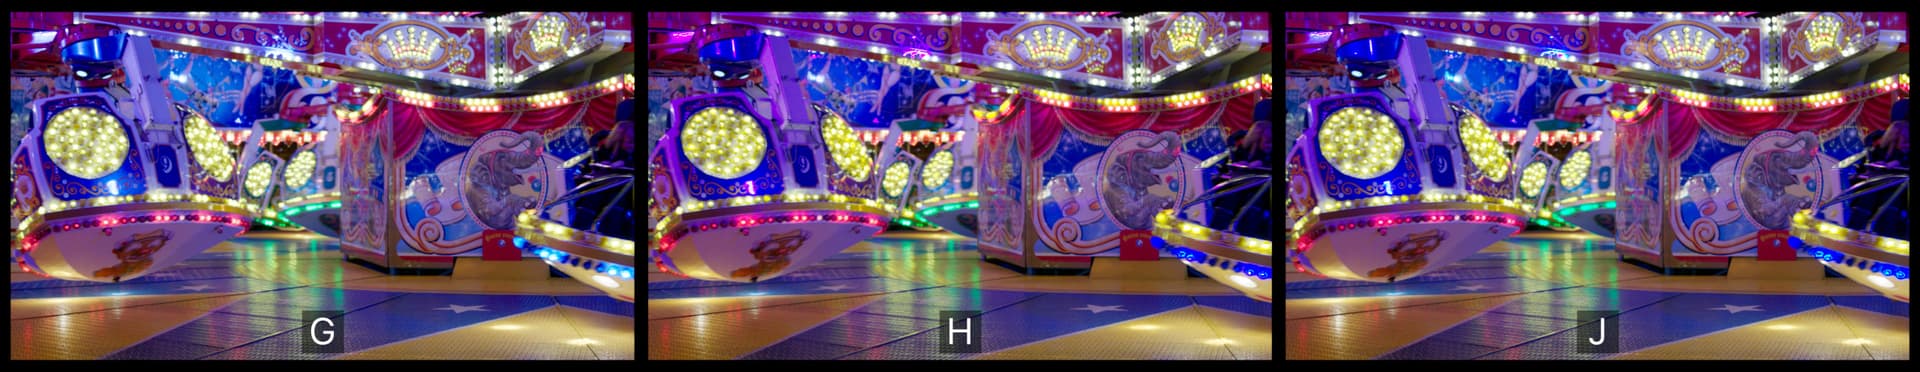
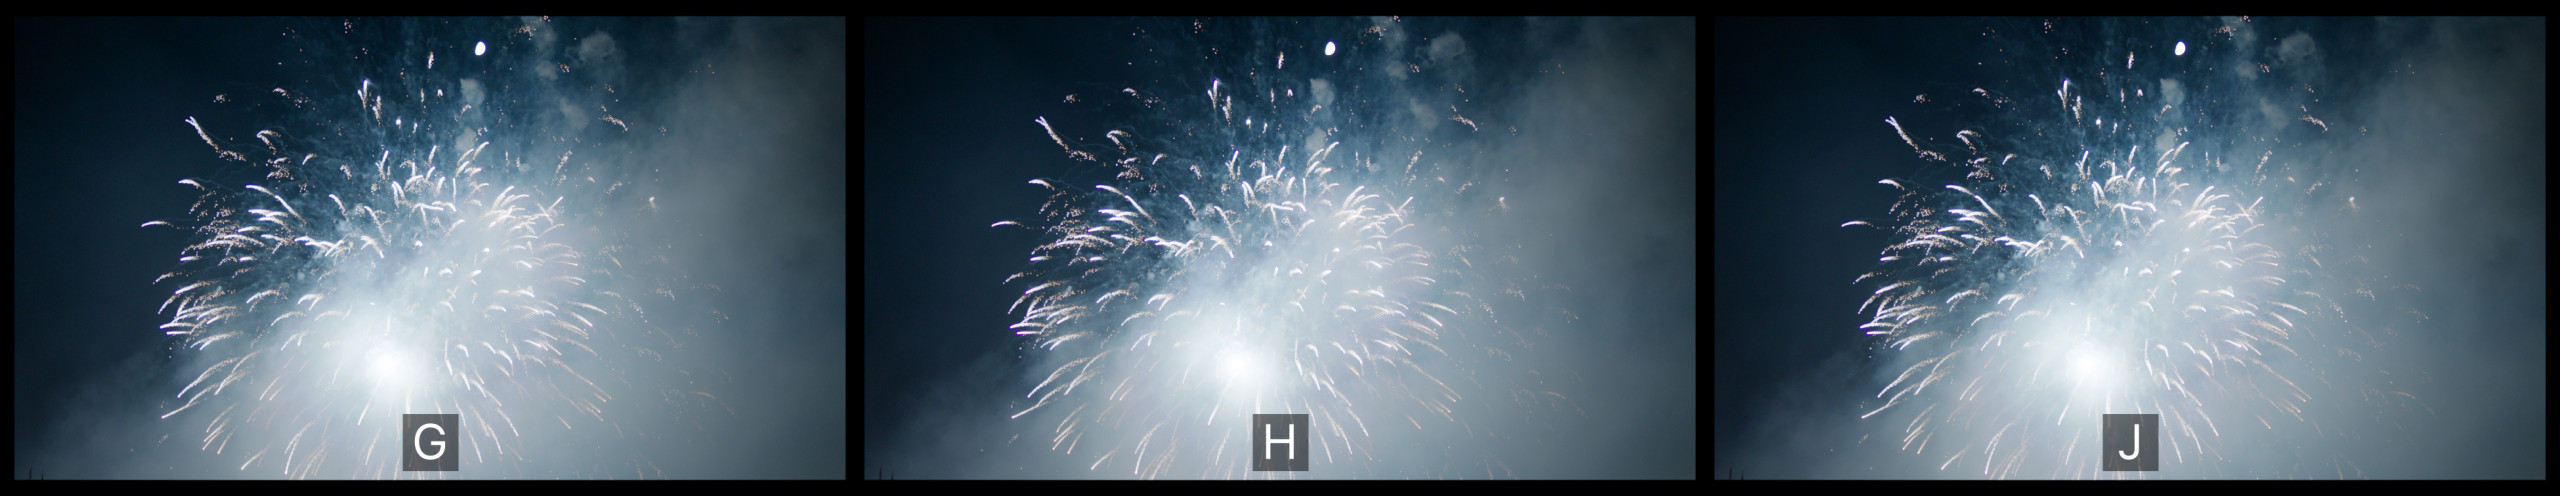
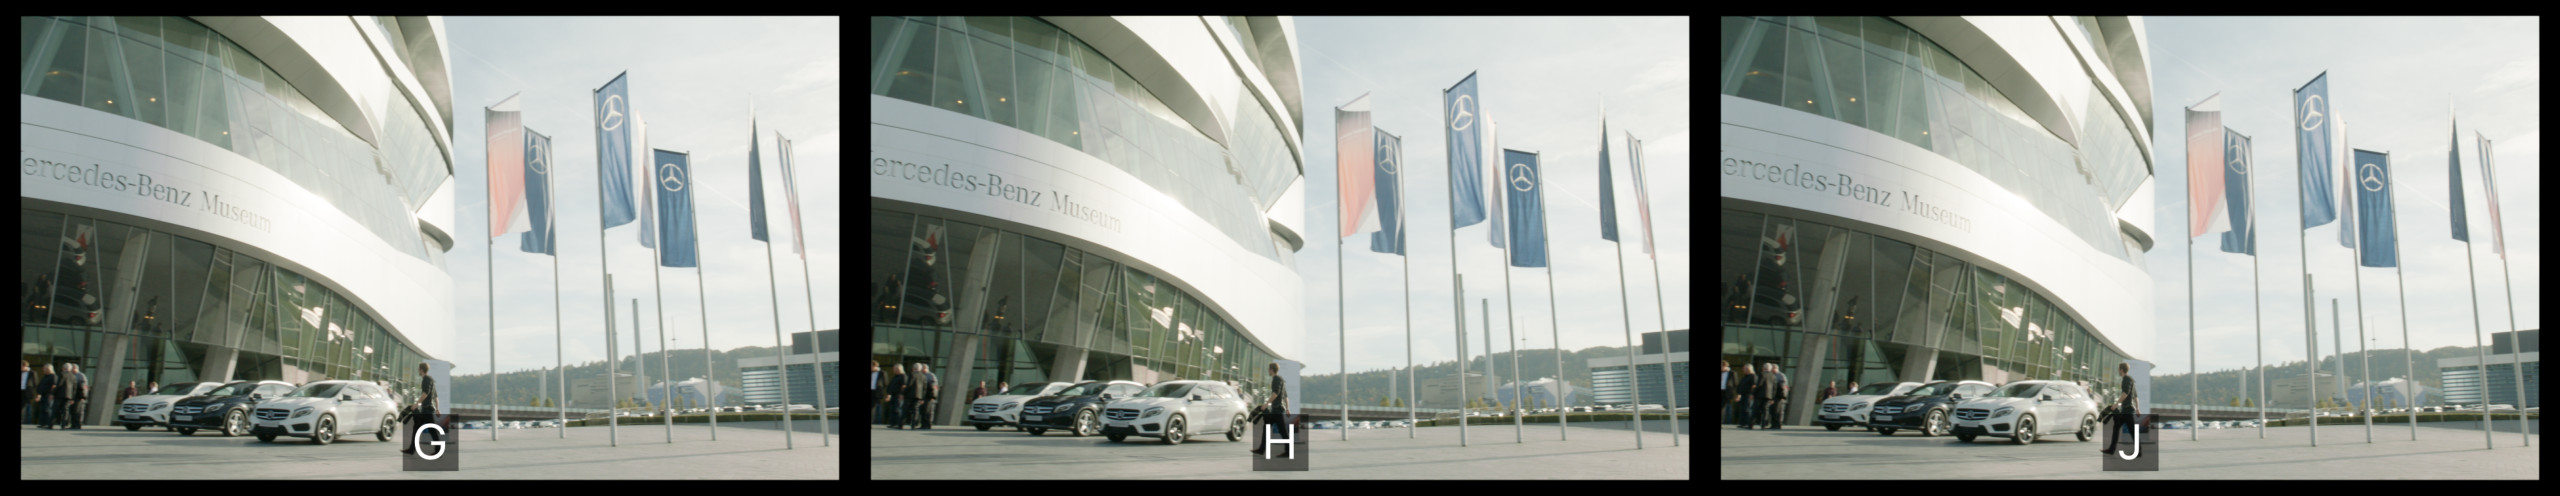
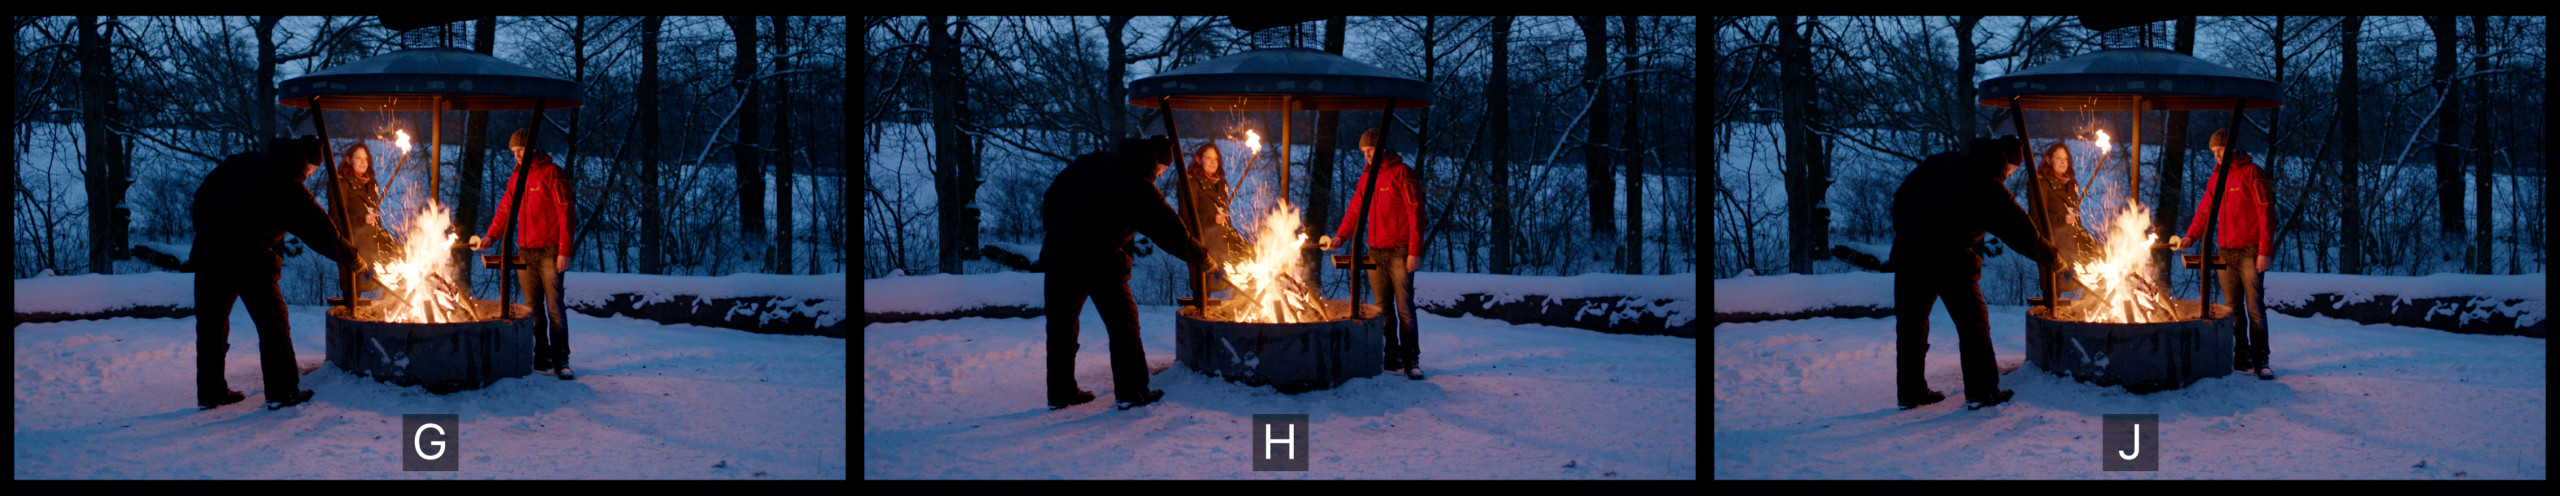
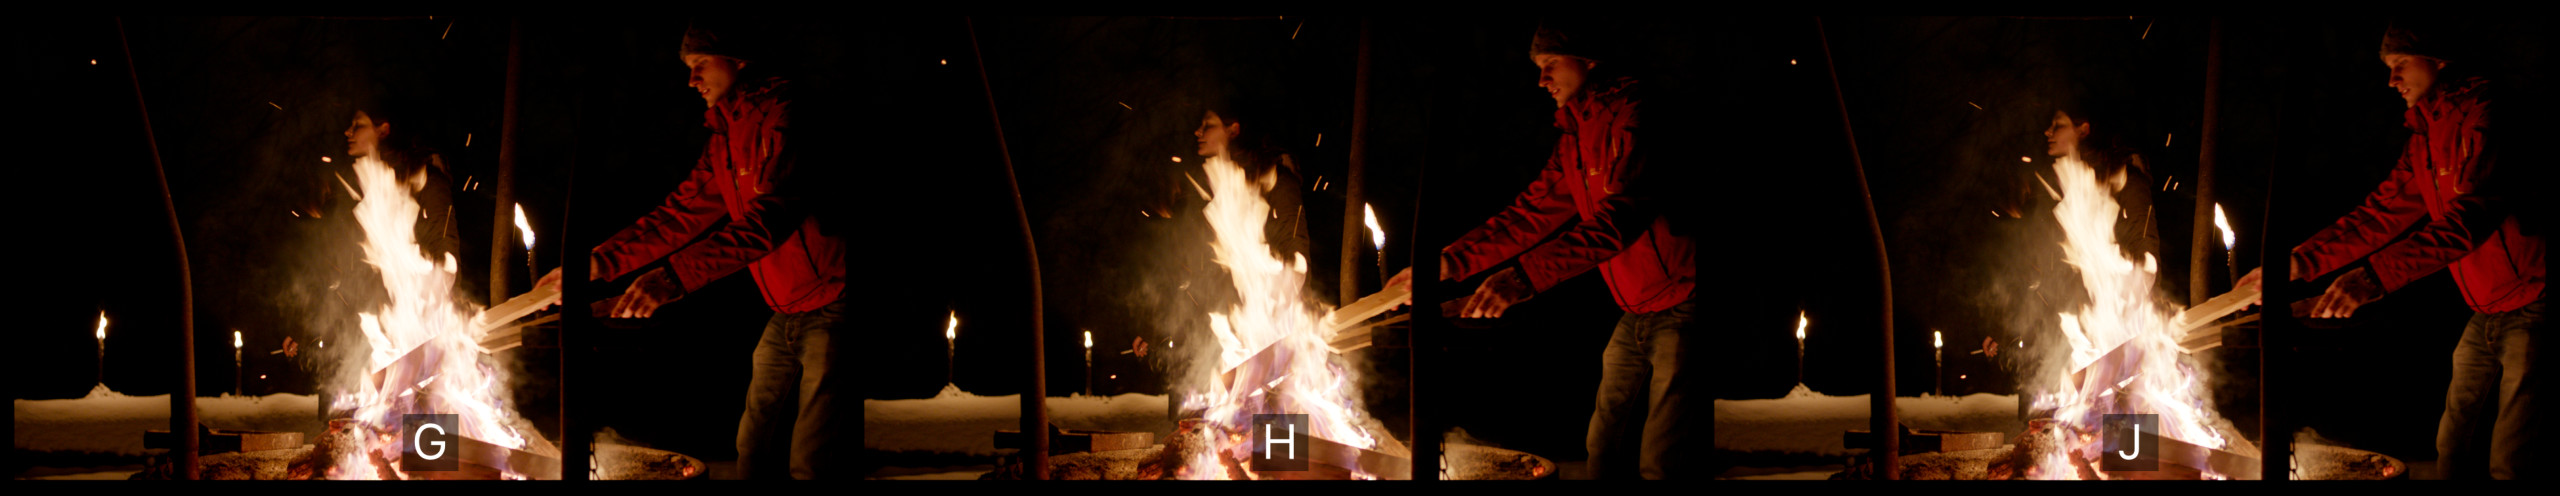
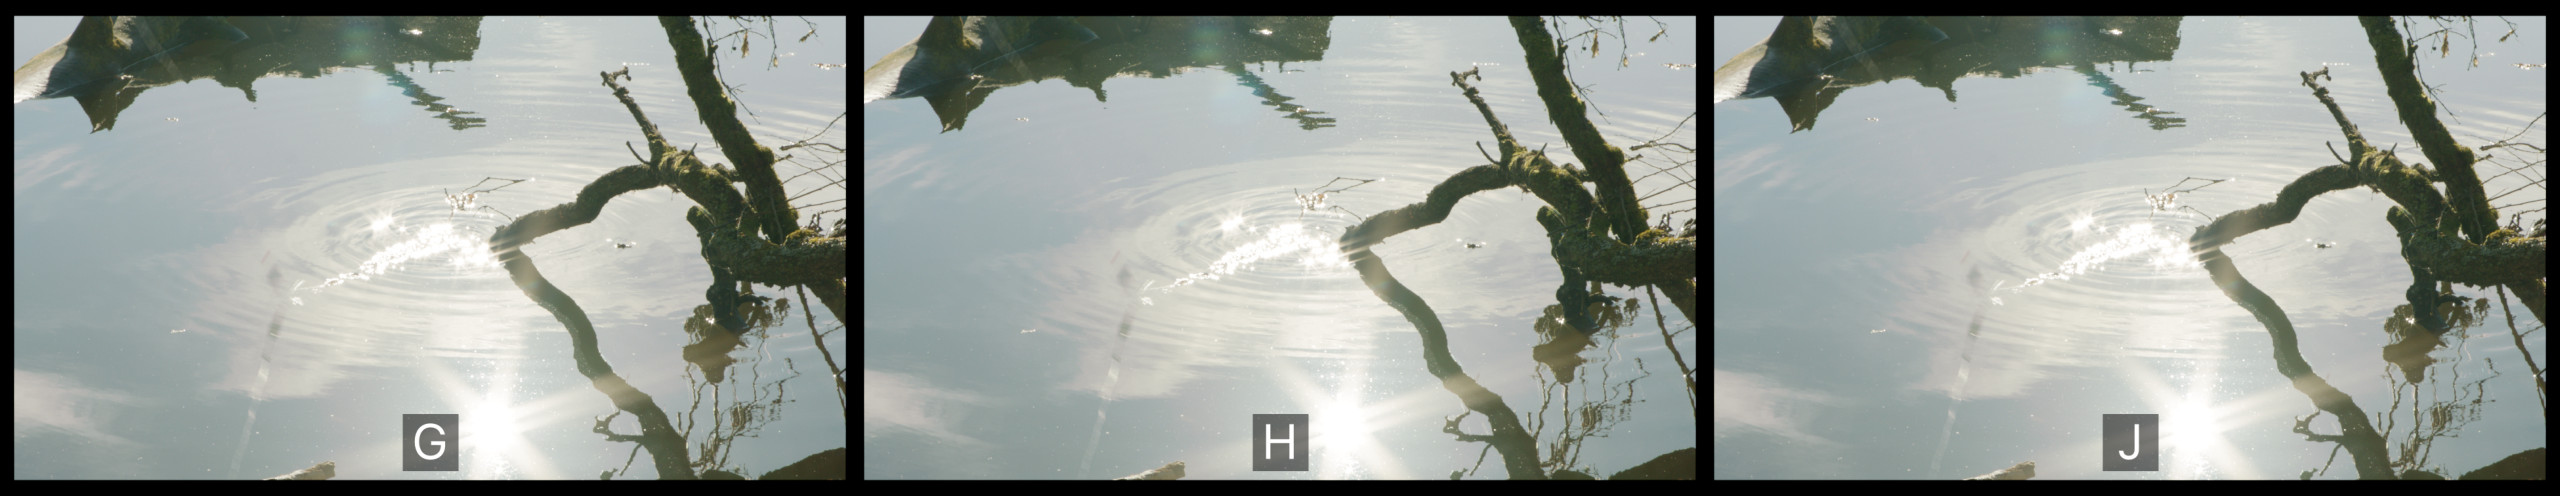
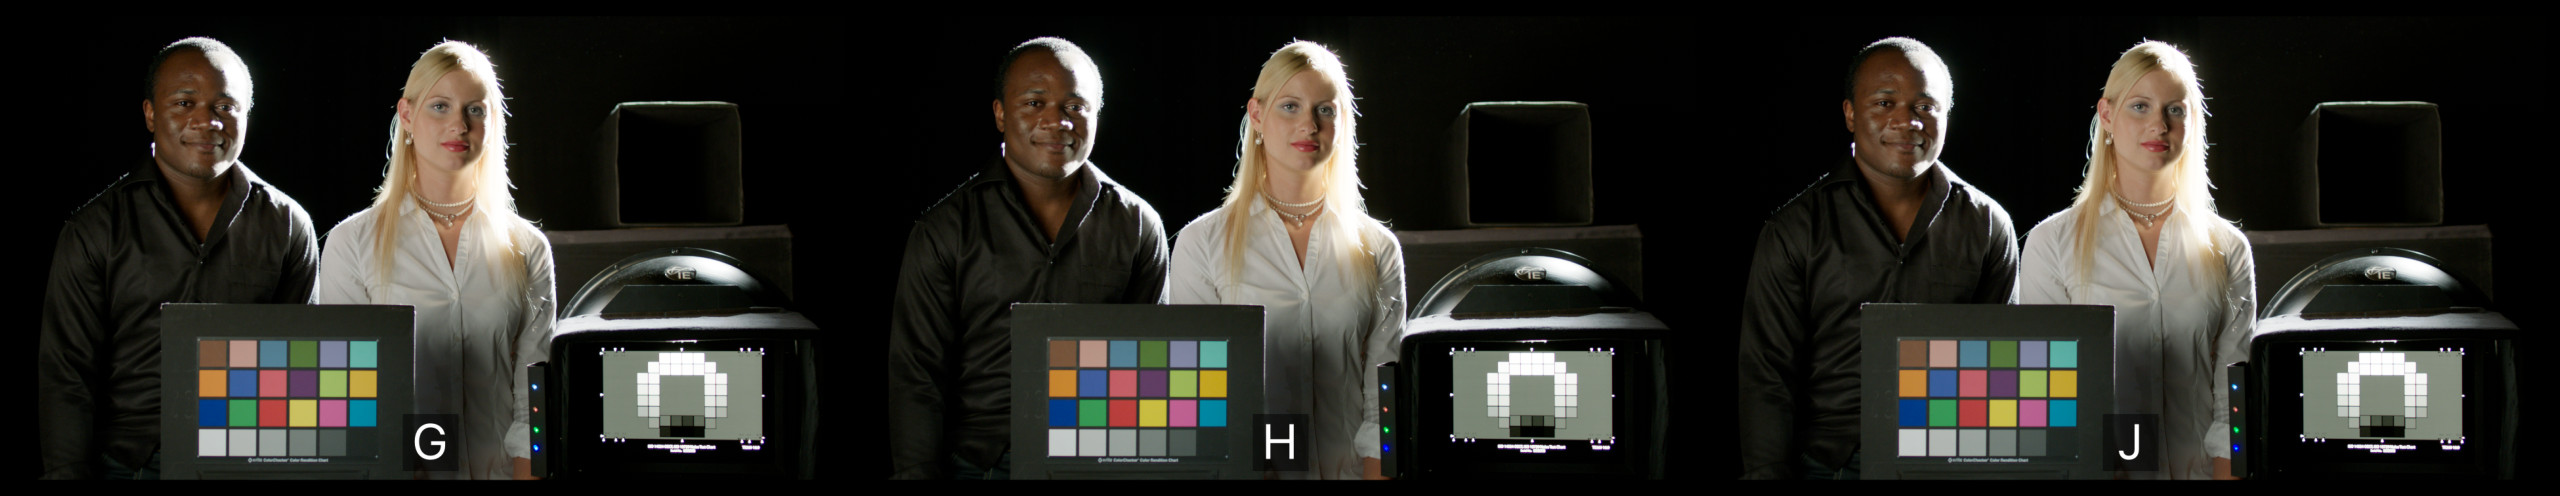
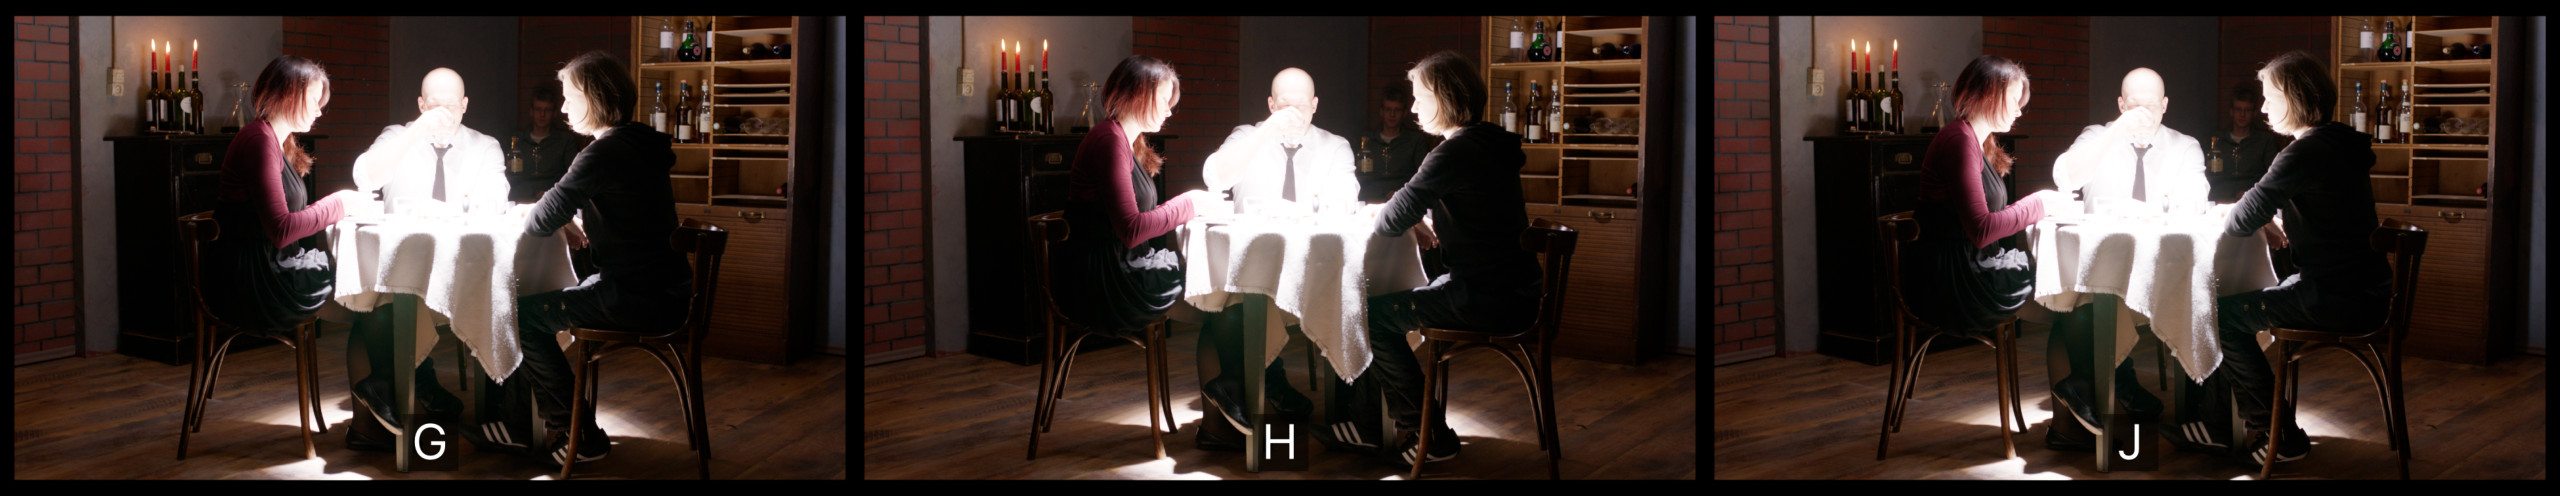
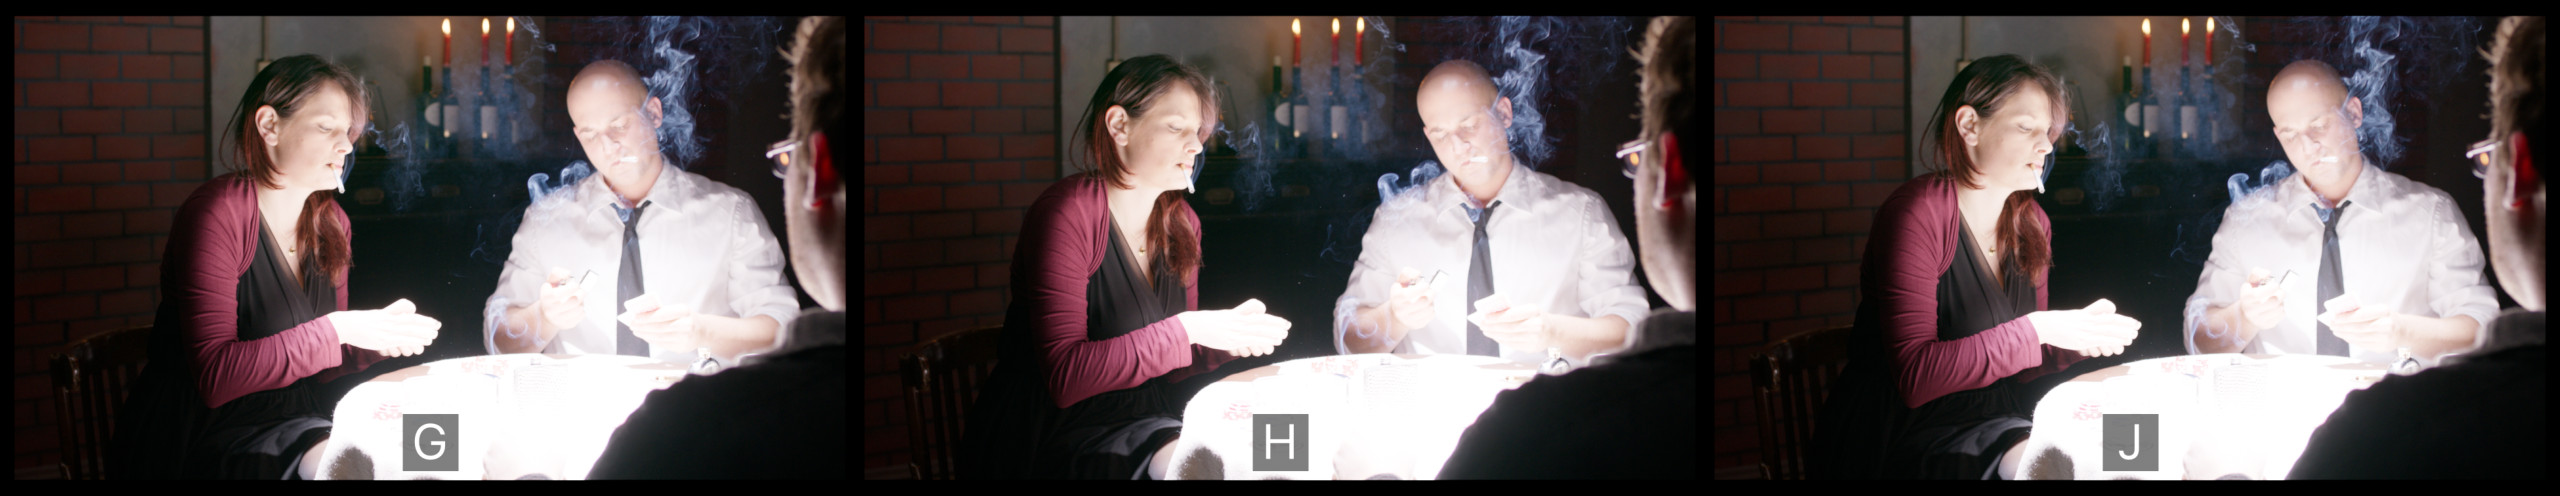
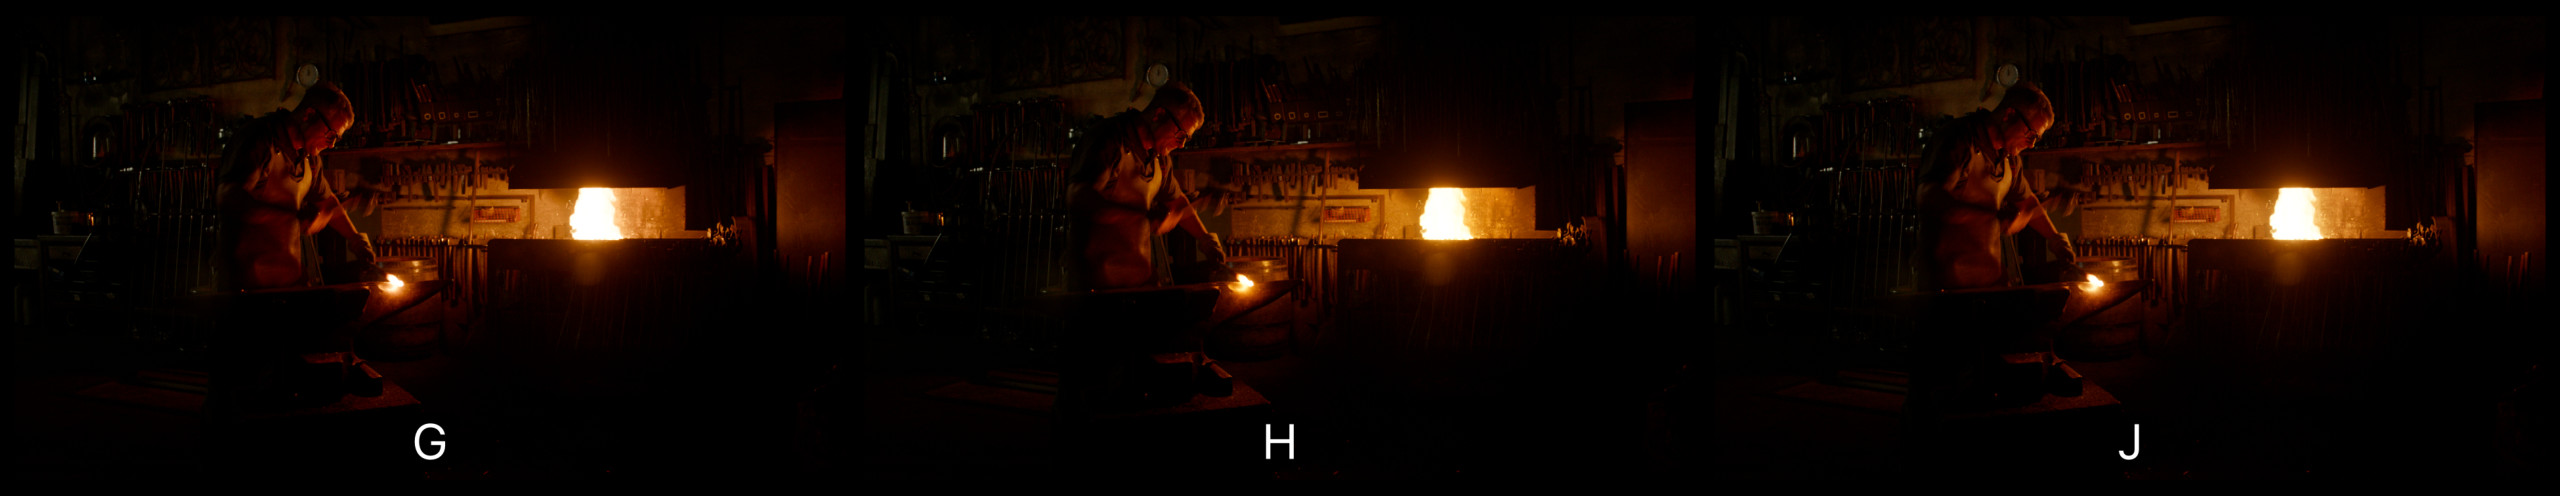
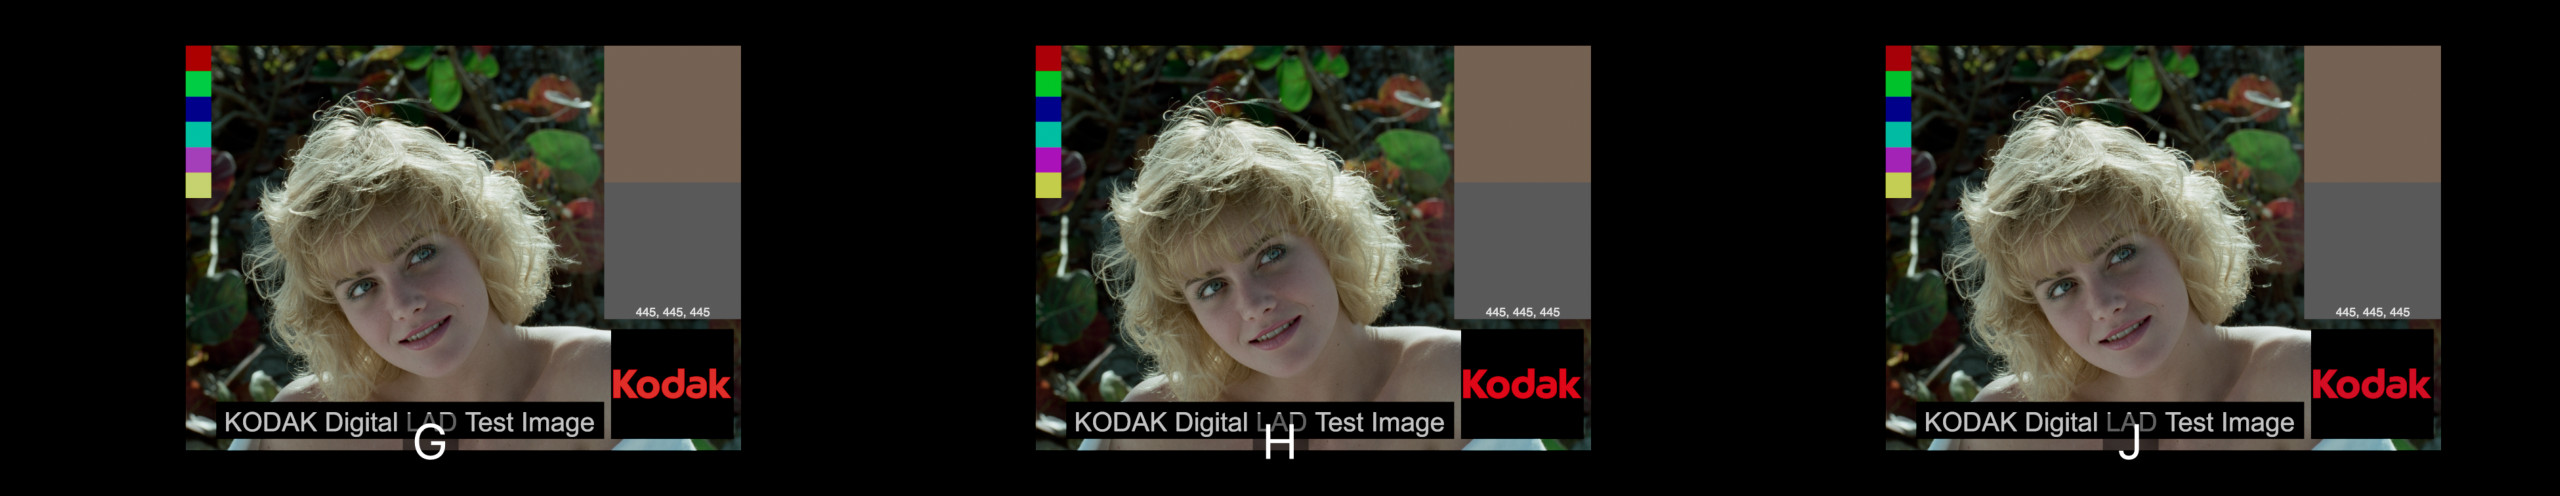
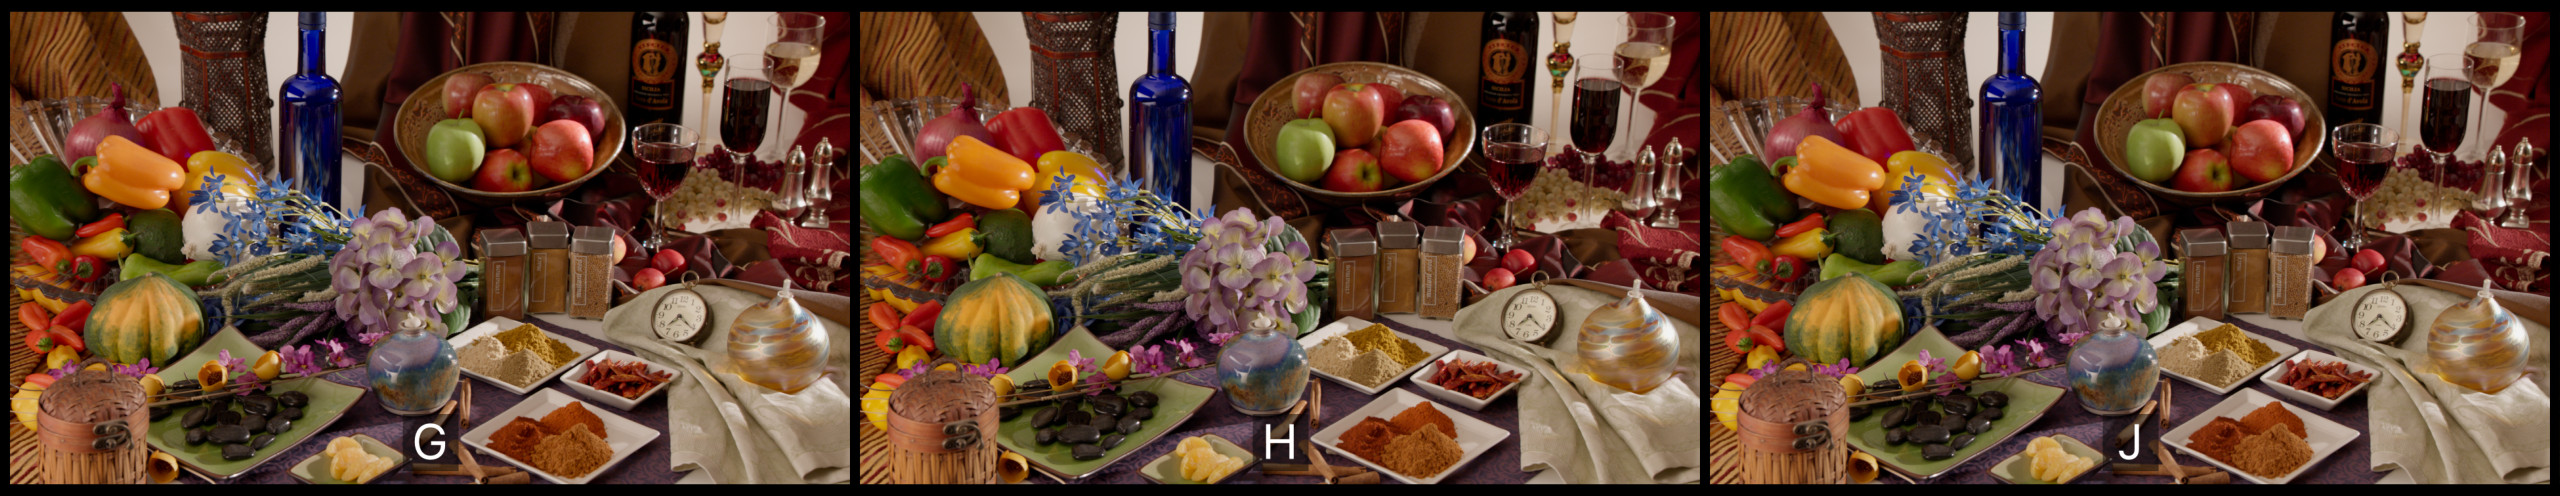
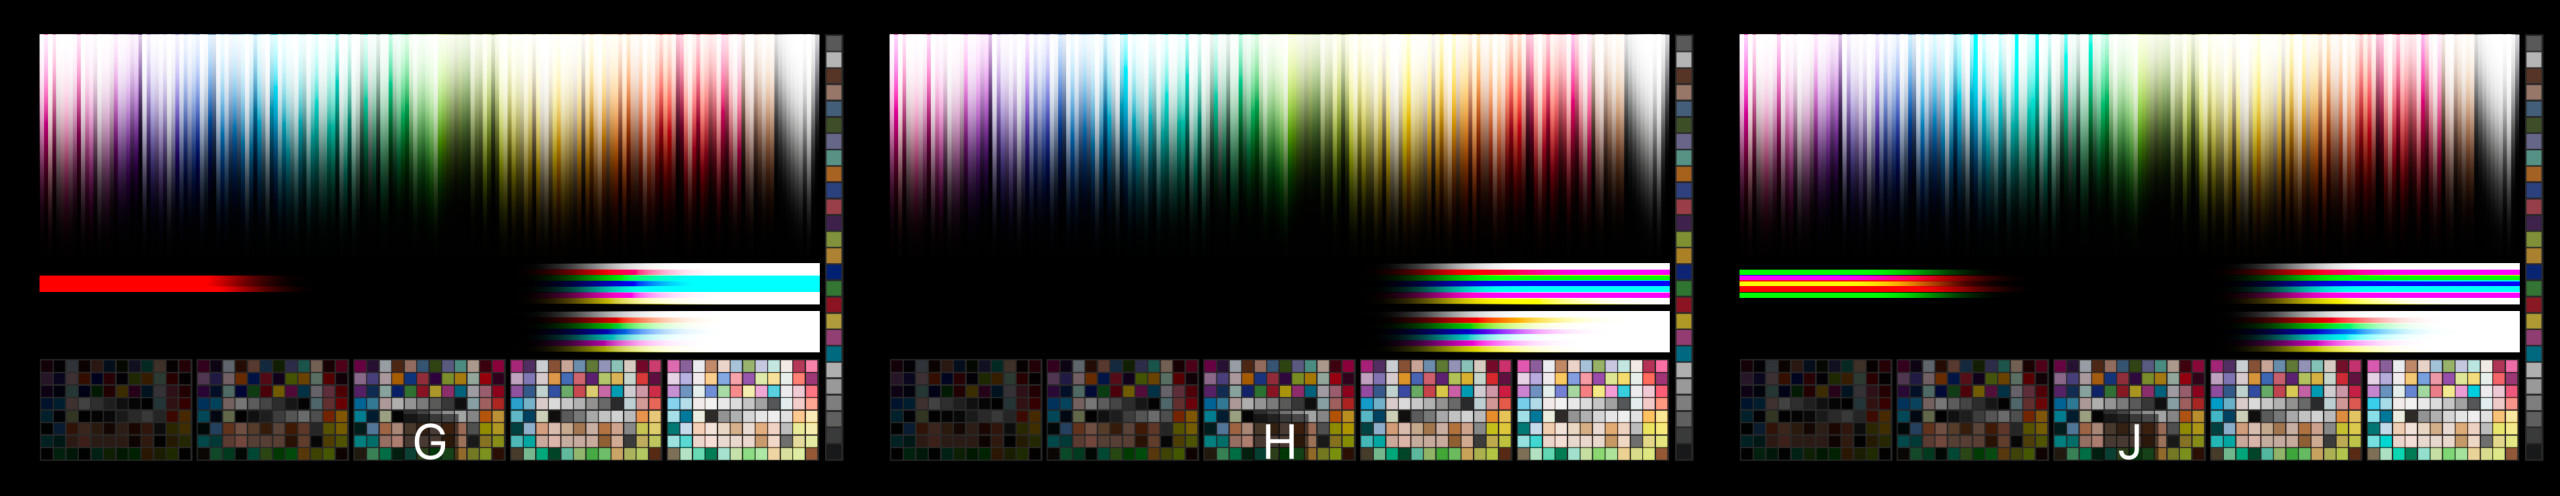
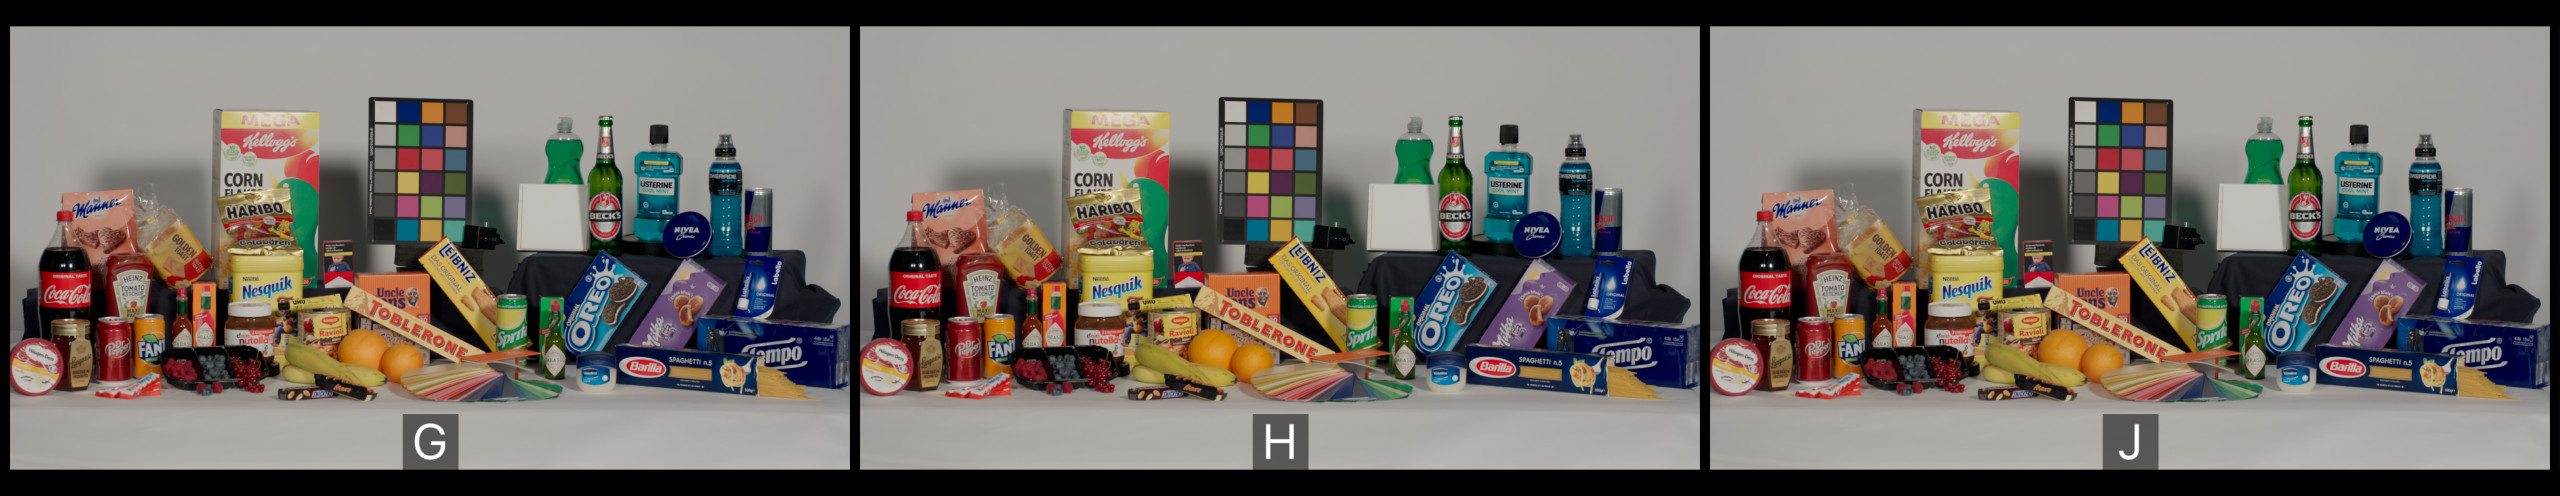
As is the case with all of these things, normal limited gamut input images all render very similarly, extreme images show more variation. I’m not going to try and present much more context than that, as I don’t want to influence people’s feelings.
Please comment below, or register your preference in this Google Form here.
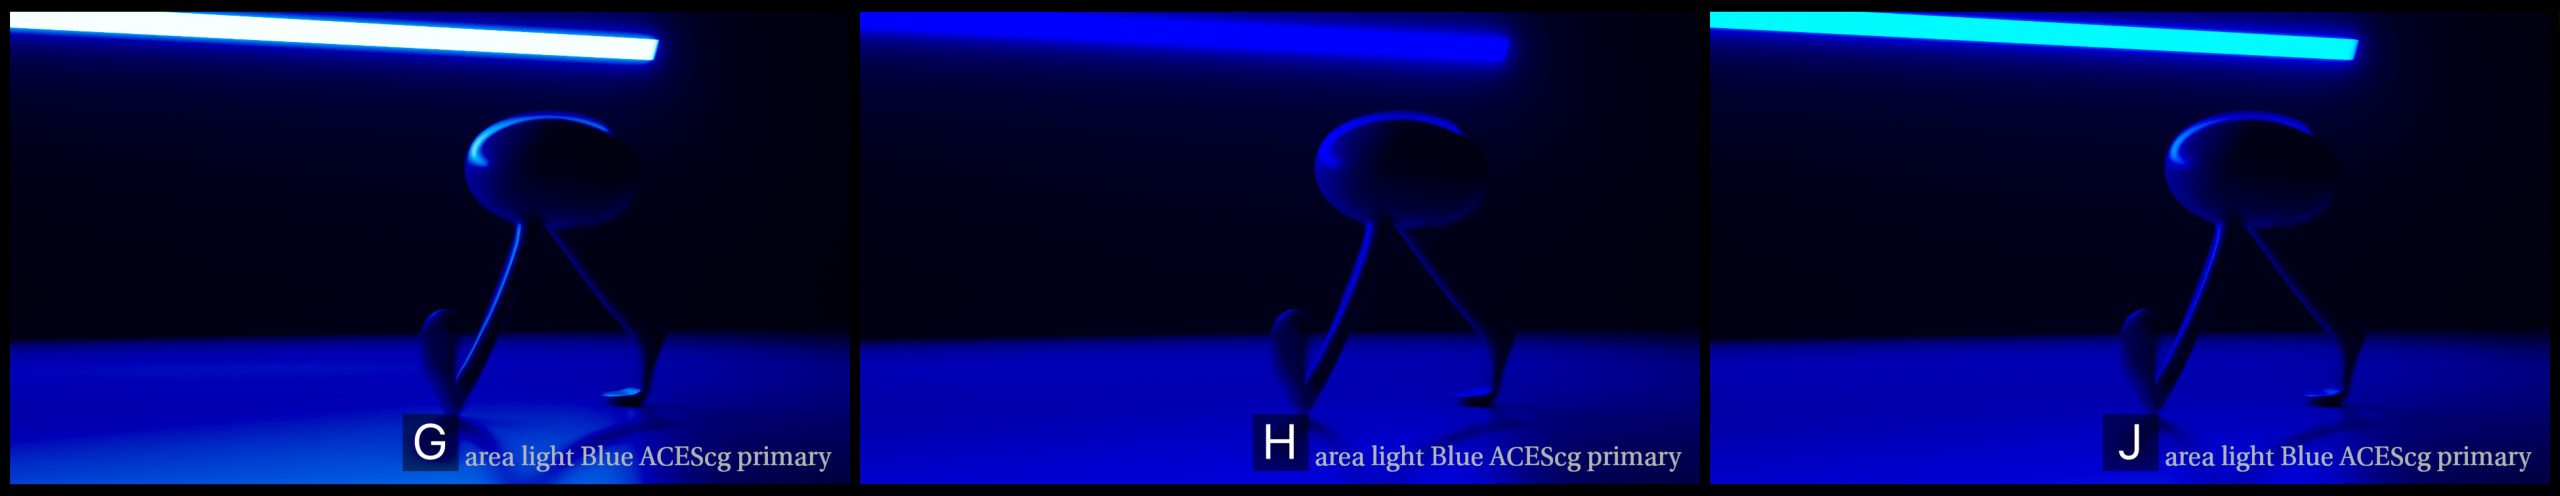
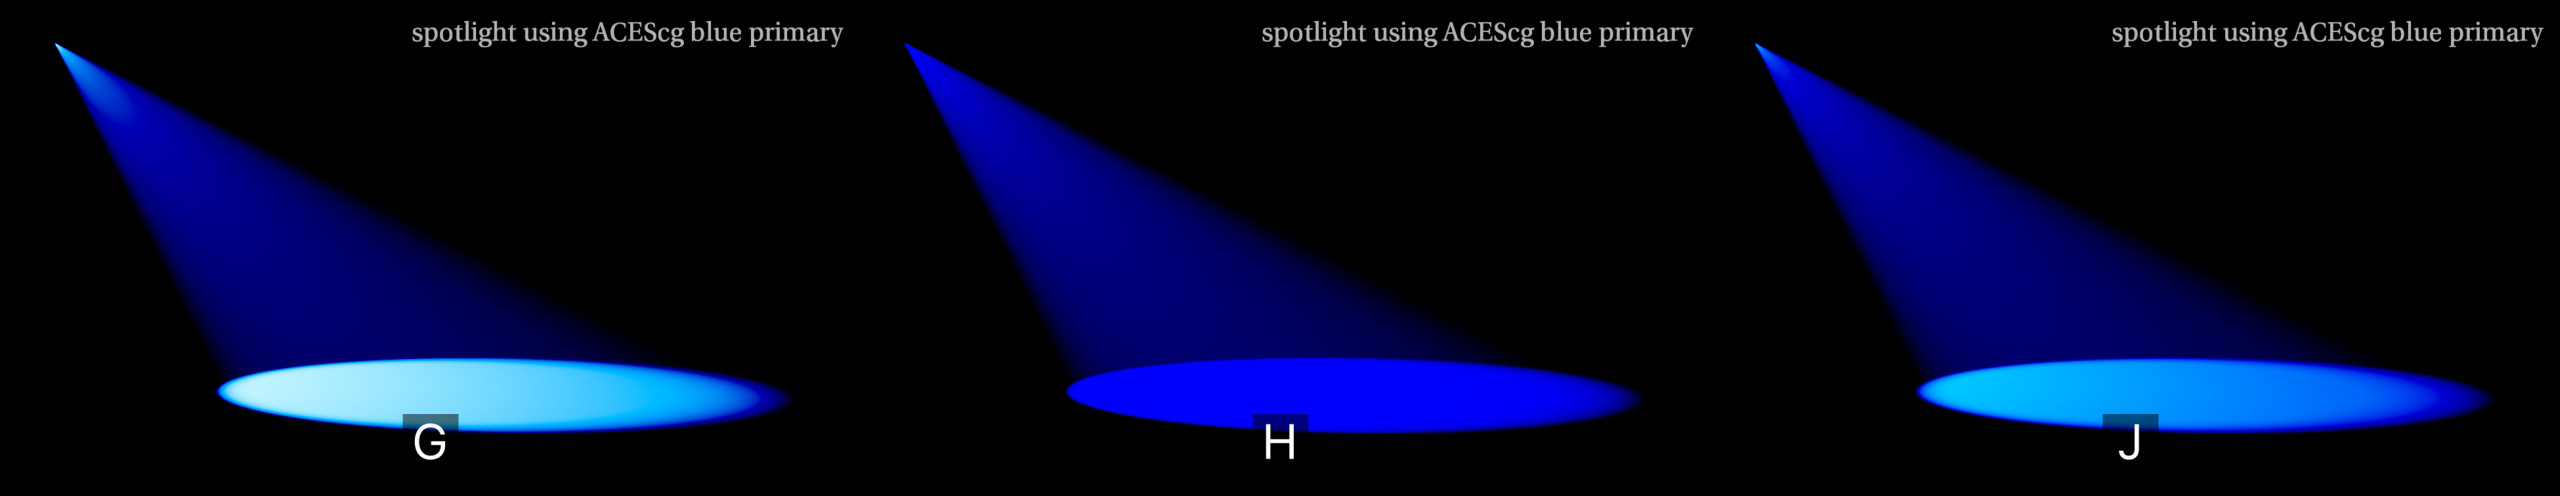
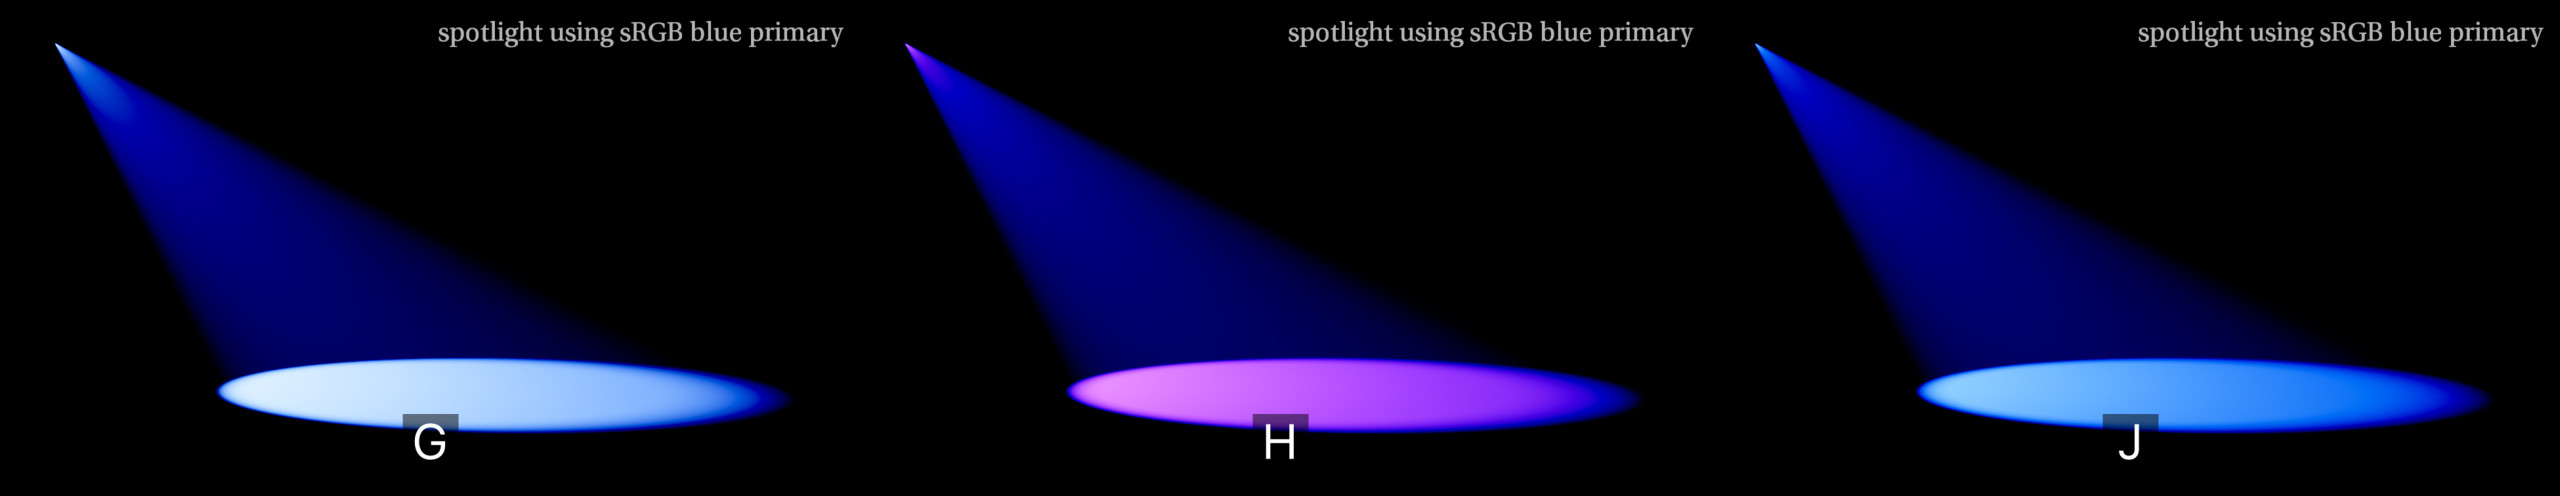
G for me too. Felt the most stable and predictable of all. I preferred the seemingly more chroma preserving J in some examples but I have no true reference what those should look like. At least G to me perceptually behaves similar across all hues in these SDR samples and gives an out of the box result that doesn’t immediately scream ‘need gamut compres’ or other treatment.
Considering that OpenDRT just got relicensed under GPLv3, is there a non-encumbered Desmos or Google colab model of that tone curve or should we go back to SSTS?
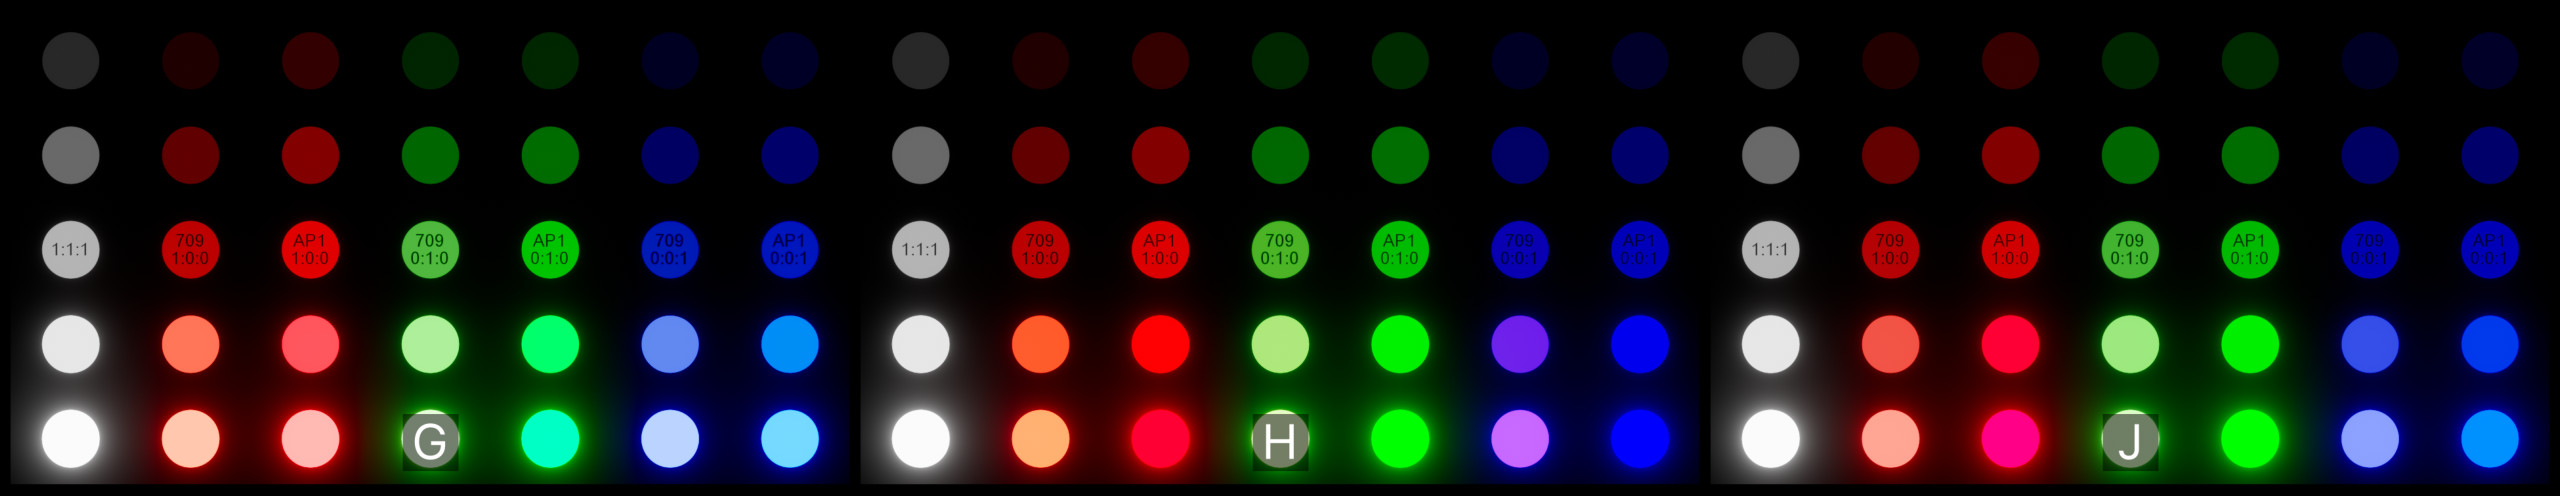
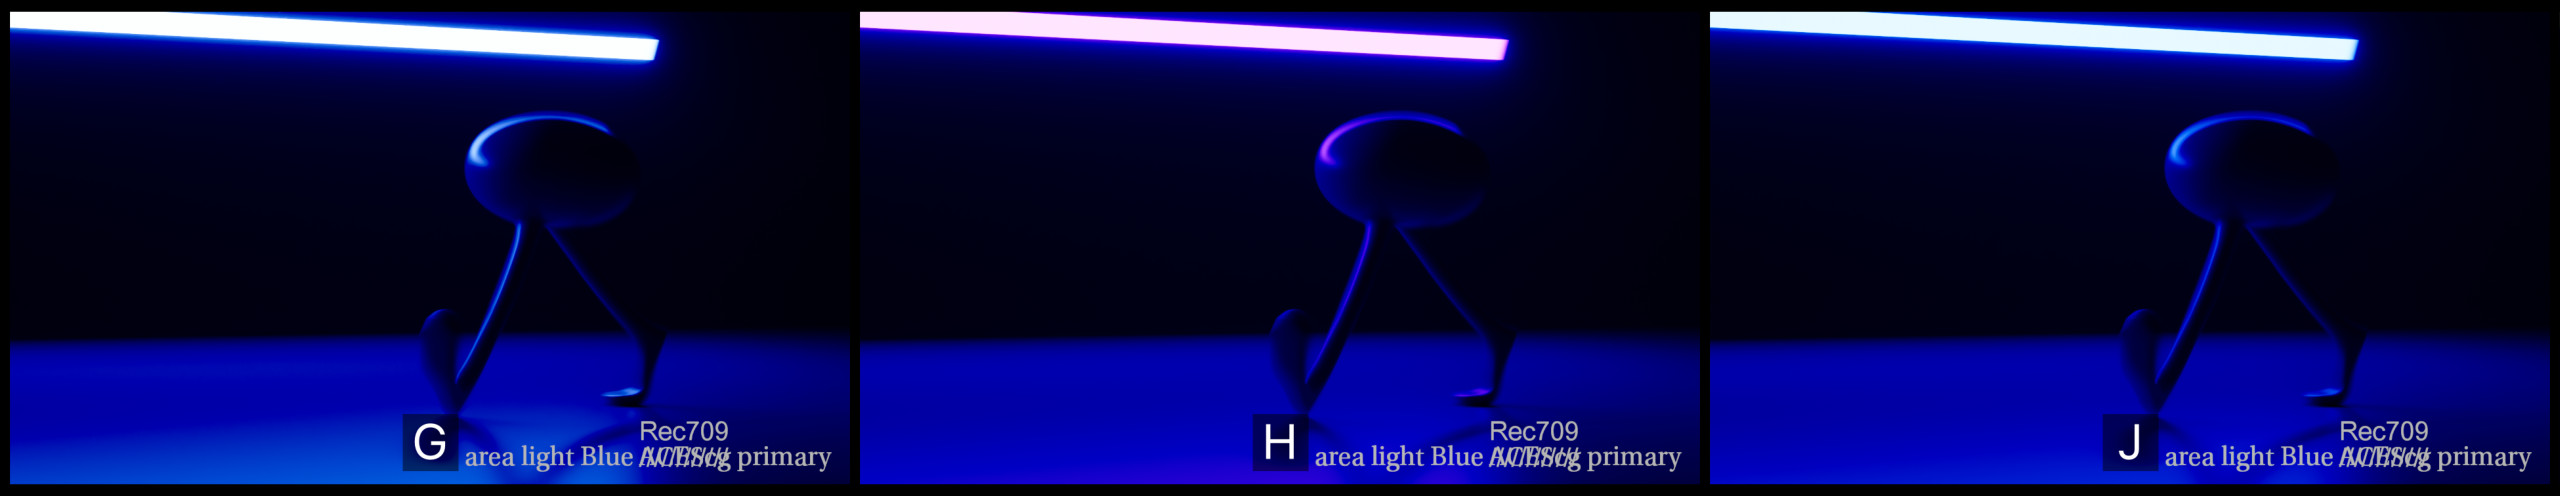
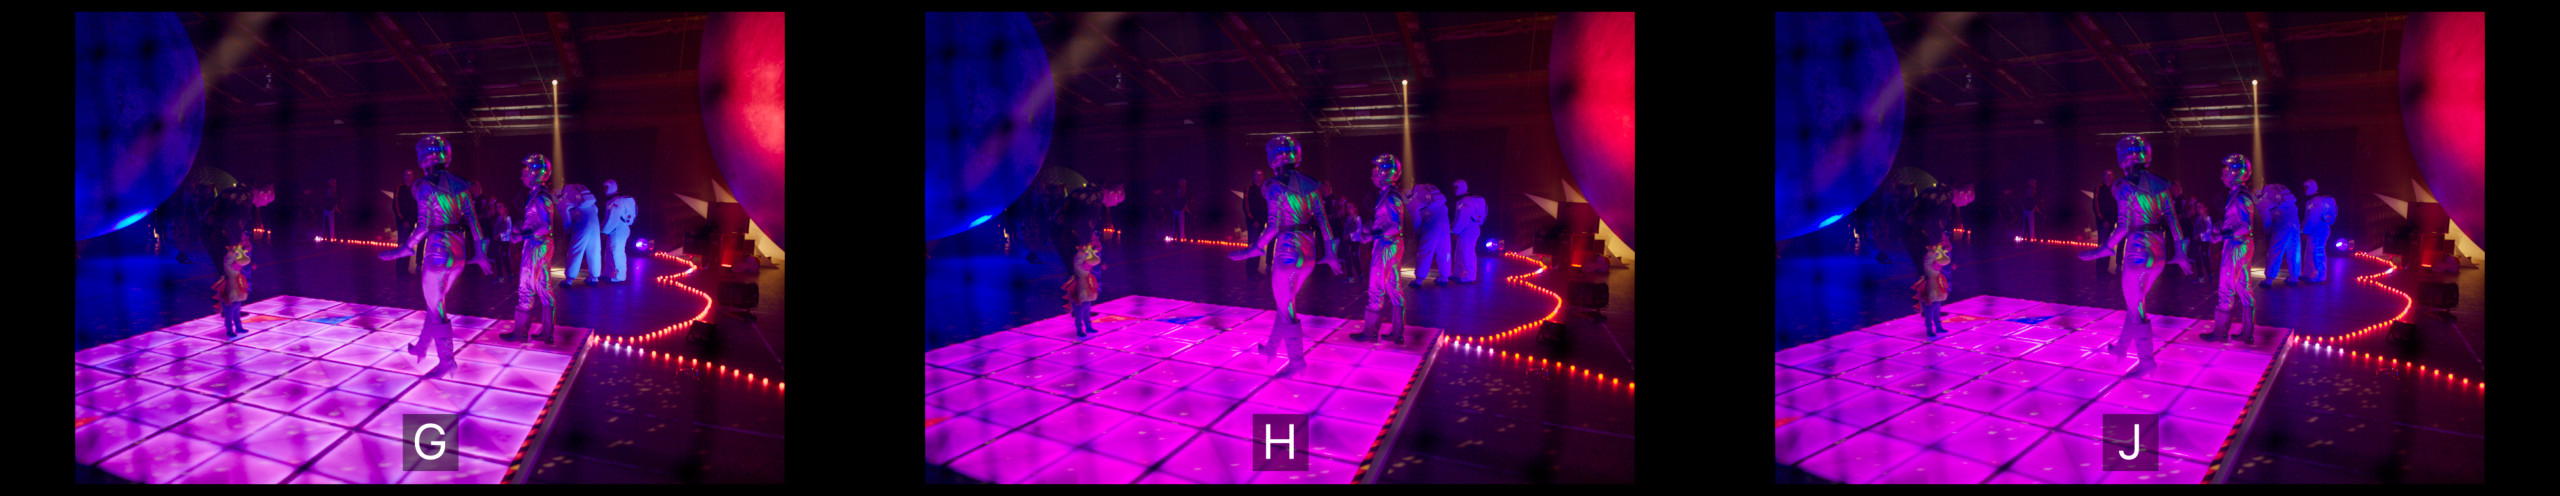
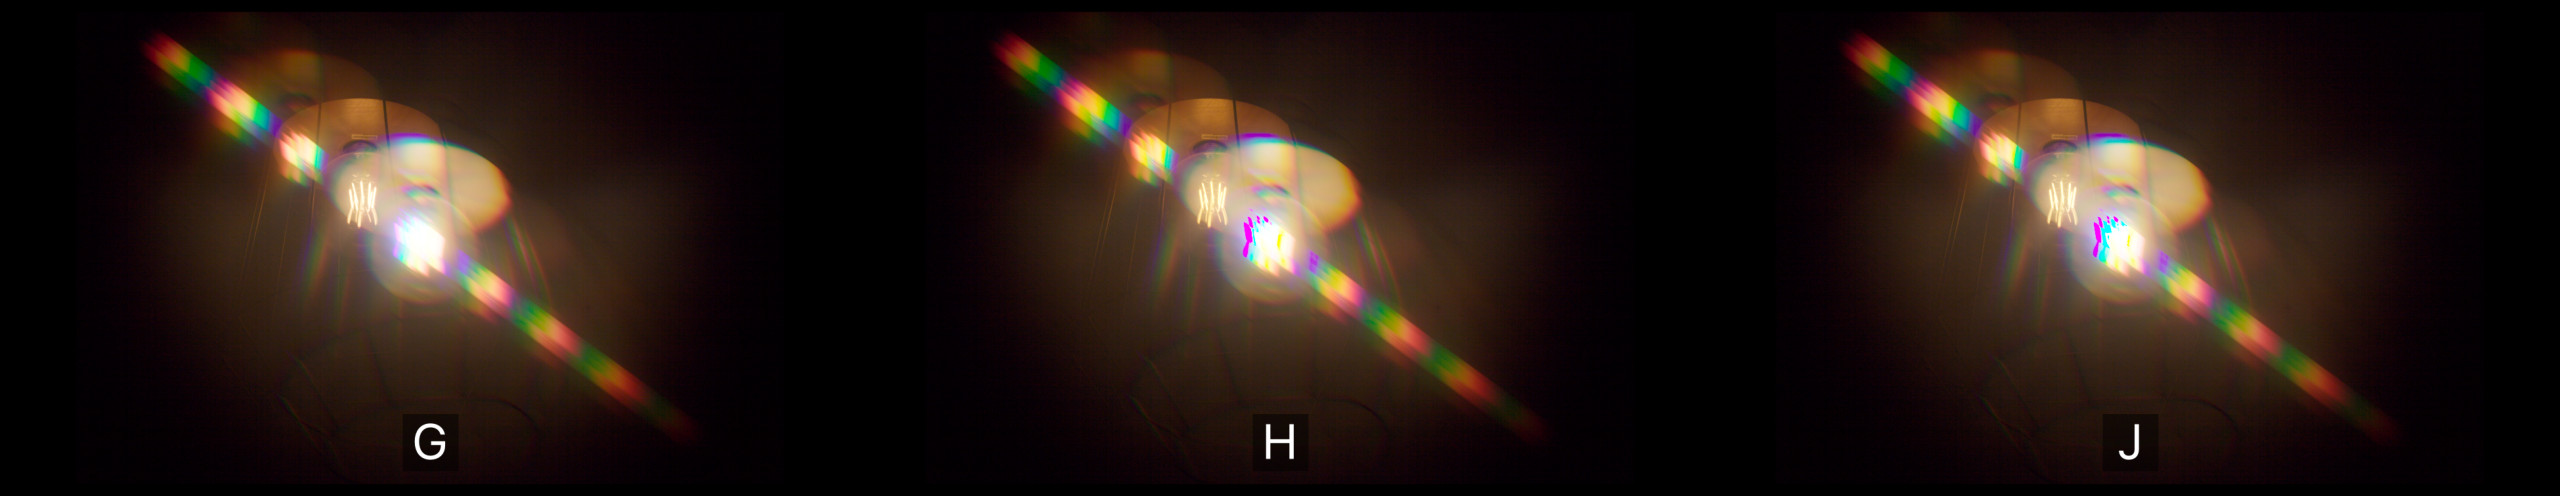
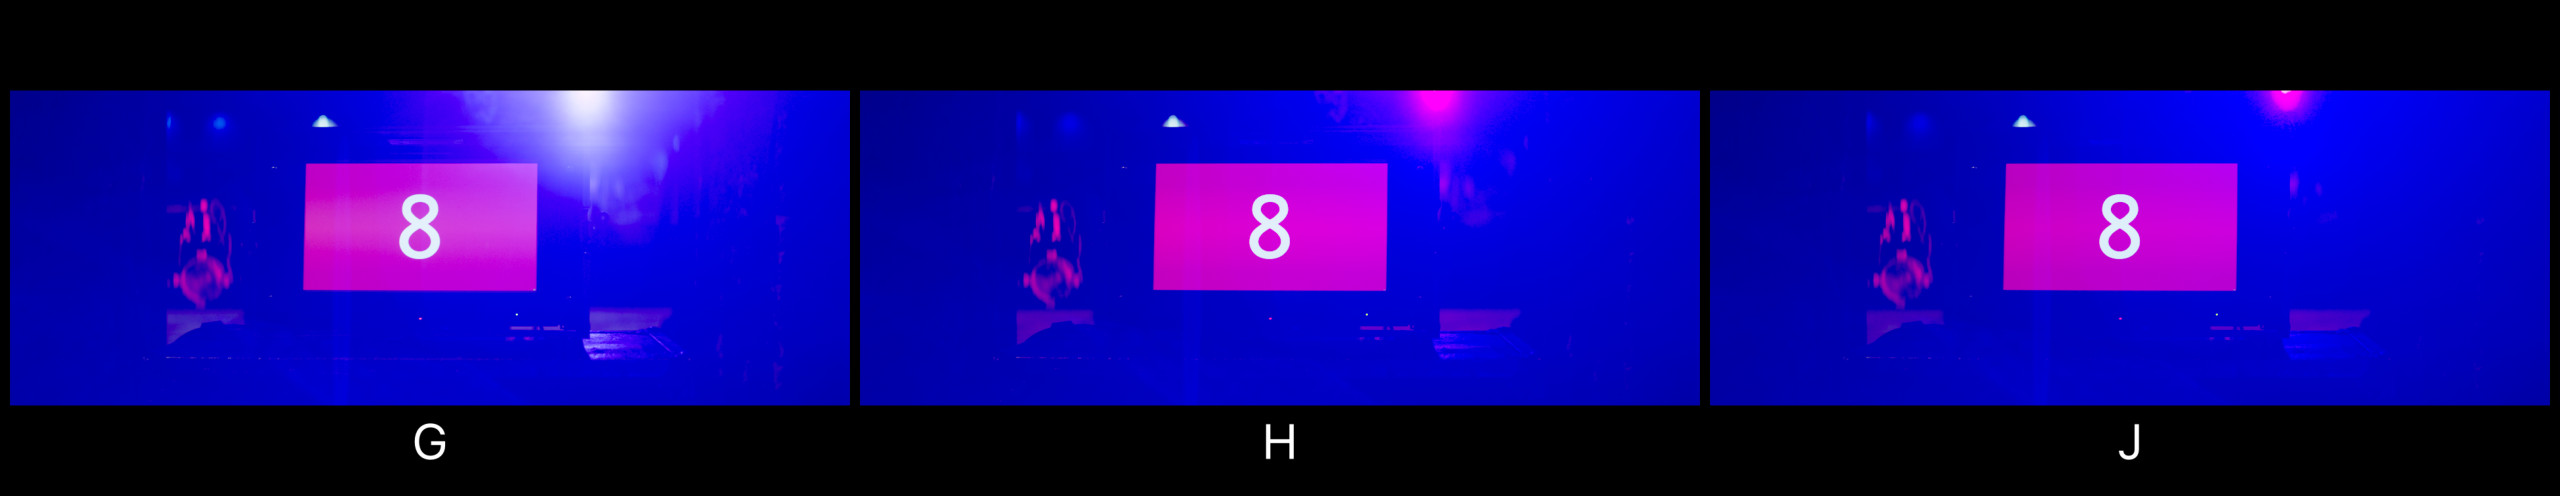
To answer the original question, G definitely tends to break less than the other two but H has more pleasing reds and greens (although the reds completely break when they reach AP1 chroma levels). J has the most pleasing blues chromaticity-wise but G hit the spot more for the lightness that I would expect high intensity blues to have in Rec.709. Of course, these problems are different when the gamut you’re mapping to is P3D65 or Rec.2020 with a display range of 1000 nits