I made a modified version of your Desmos plot, where C_1 is automatically calculated to make the curve continuous as you vary C_0, instead of being a slider.
You need to drop C_0 to 1.0 instead of 1.2 to make the first derivative smooth. That is probably not enough contrast for our purposes. But it is interesting to see where the kink comes from.
Here is a version of the tone scale formula which compensates for the reduction in exposure introduced by the (Display) Flare compensation.
As the first equation does not change the slope at zero (besides the gamma value) one could change the order without significant difference, but I find this cleaner.
t_1 as most of the parameters is there to give us leverage on many different issues at once.
Some are:
it compensates the display flare without moving 0.0; this is important in a relative black system
it compensates for the shadow wash-out, which is introduced by the first part of the equation
most importantly, it compensates for the kink you get from the toe of the log grading space toe, this is important for the “gradeability” of the system.
with t_1 = 0.0 we get a ACEScct to Rec.1886 mapping like this:
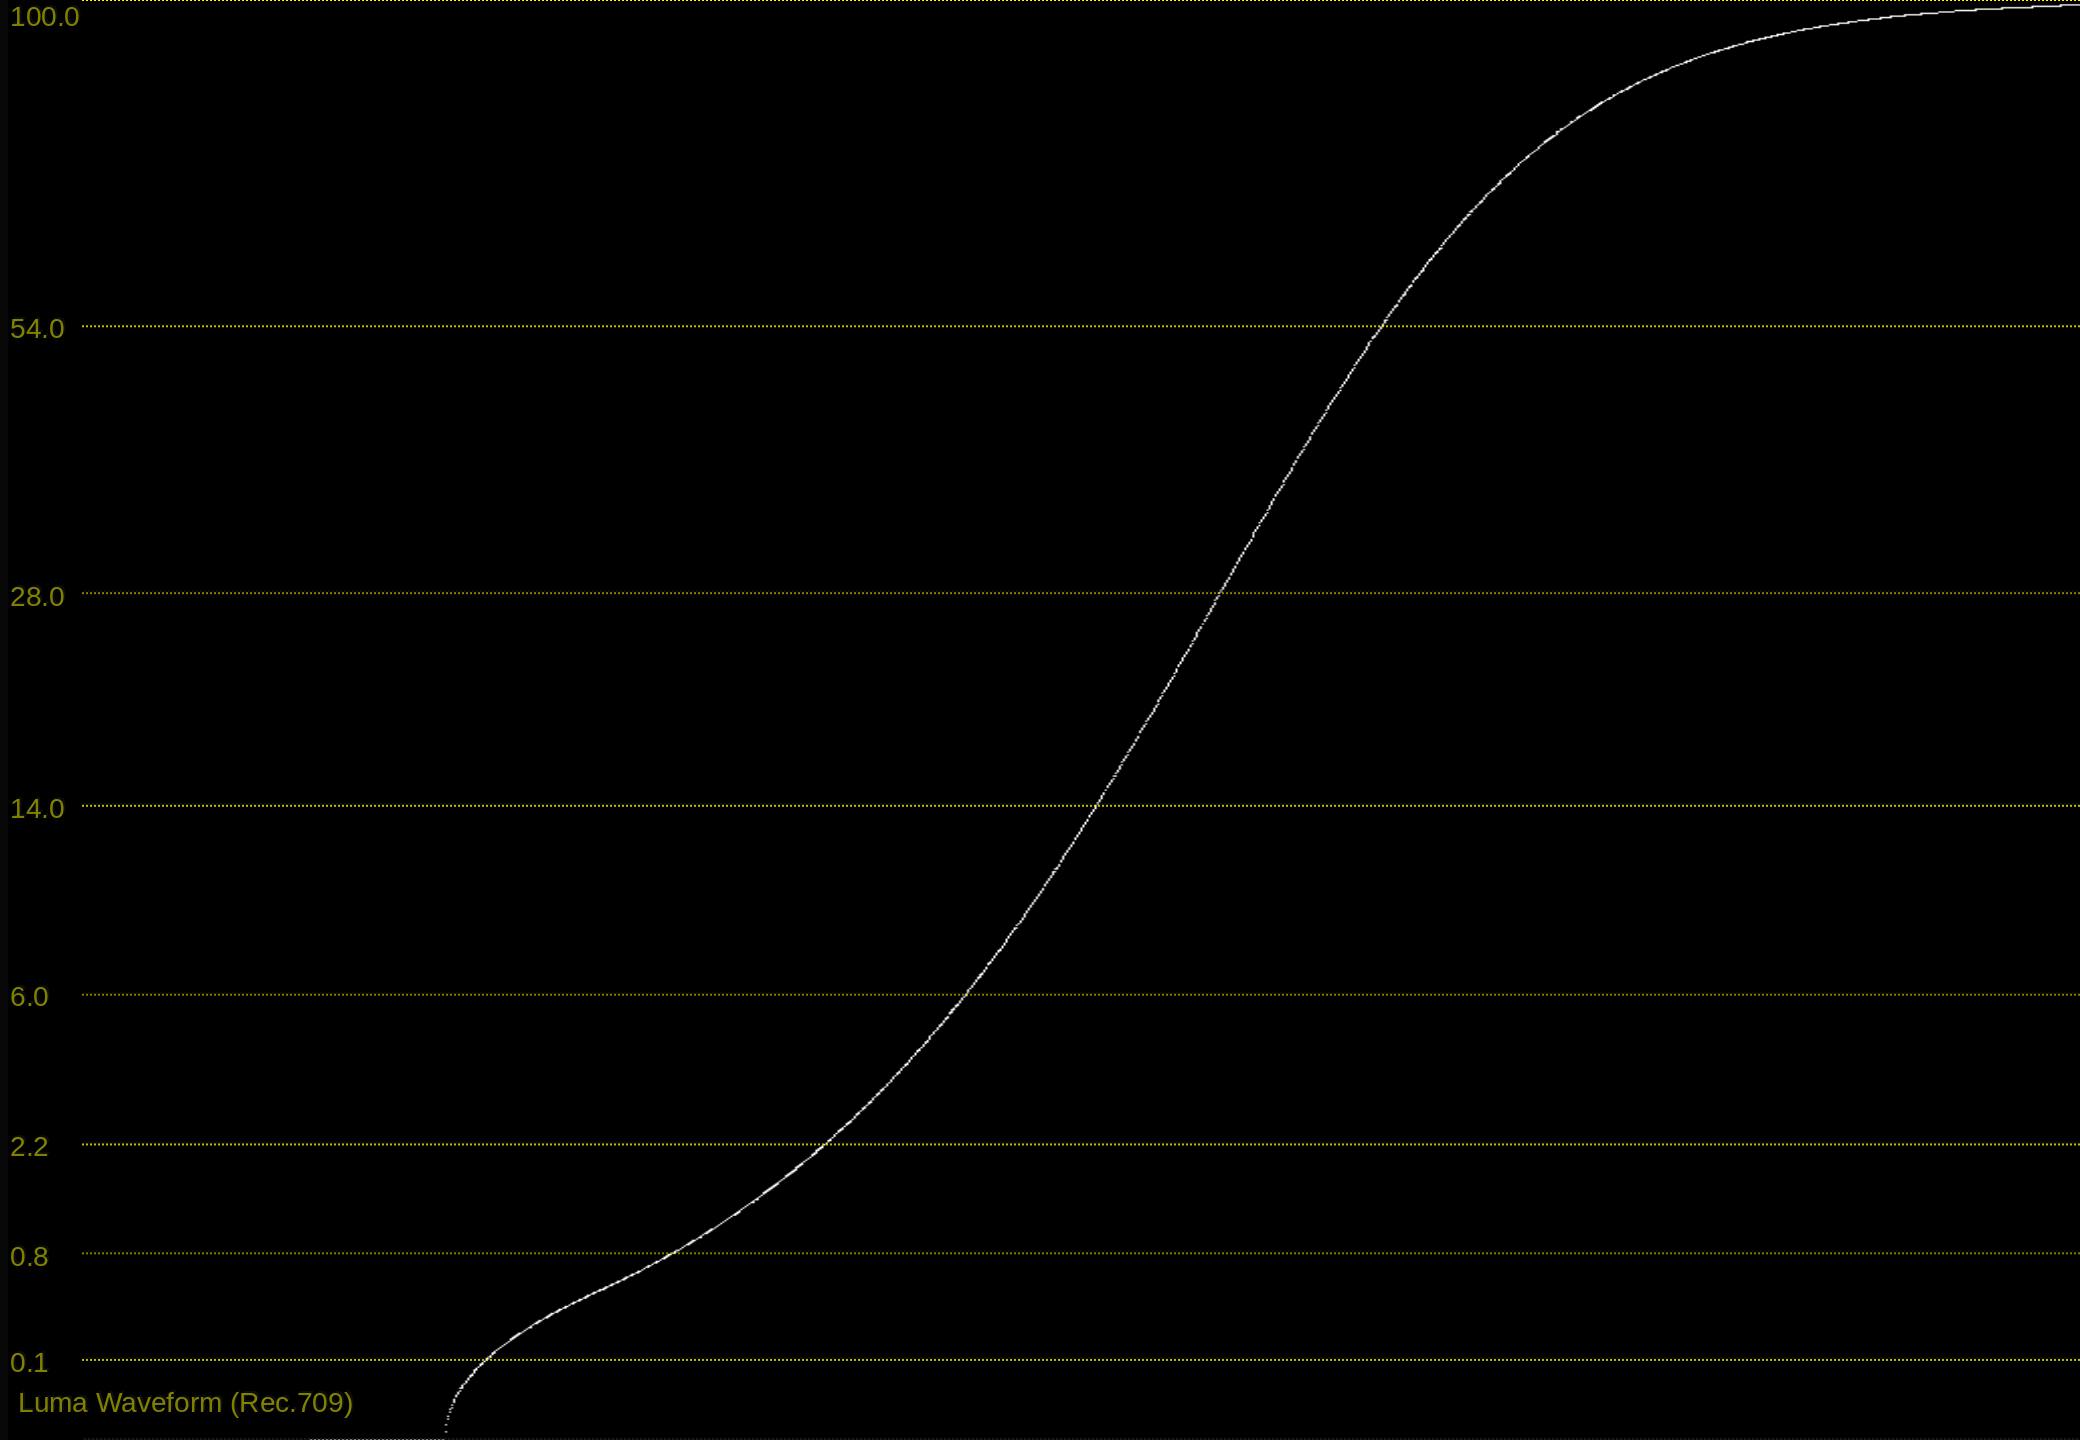
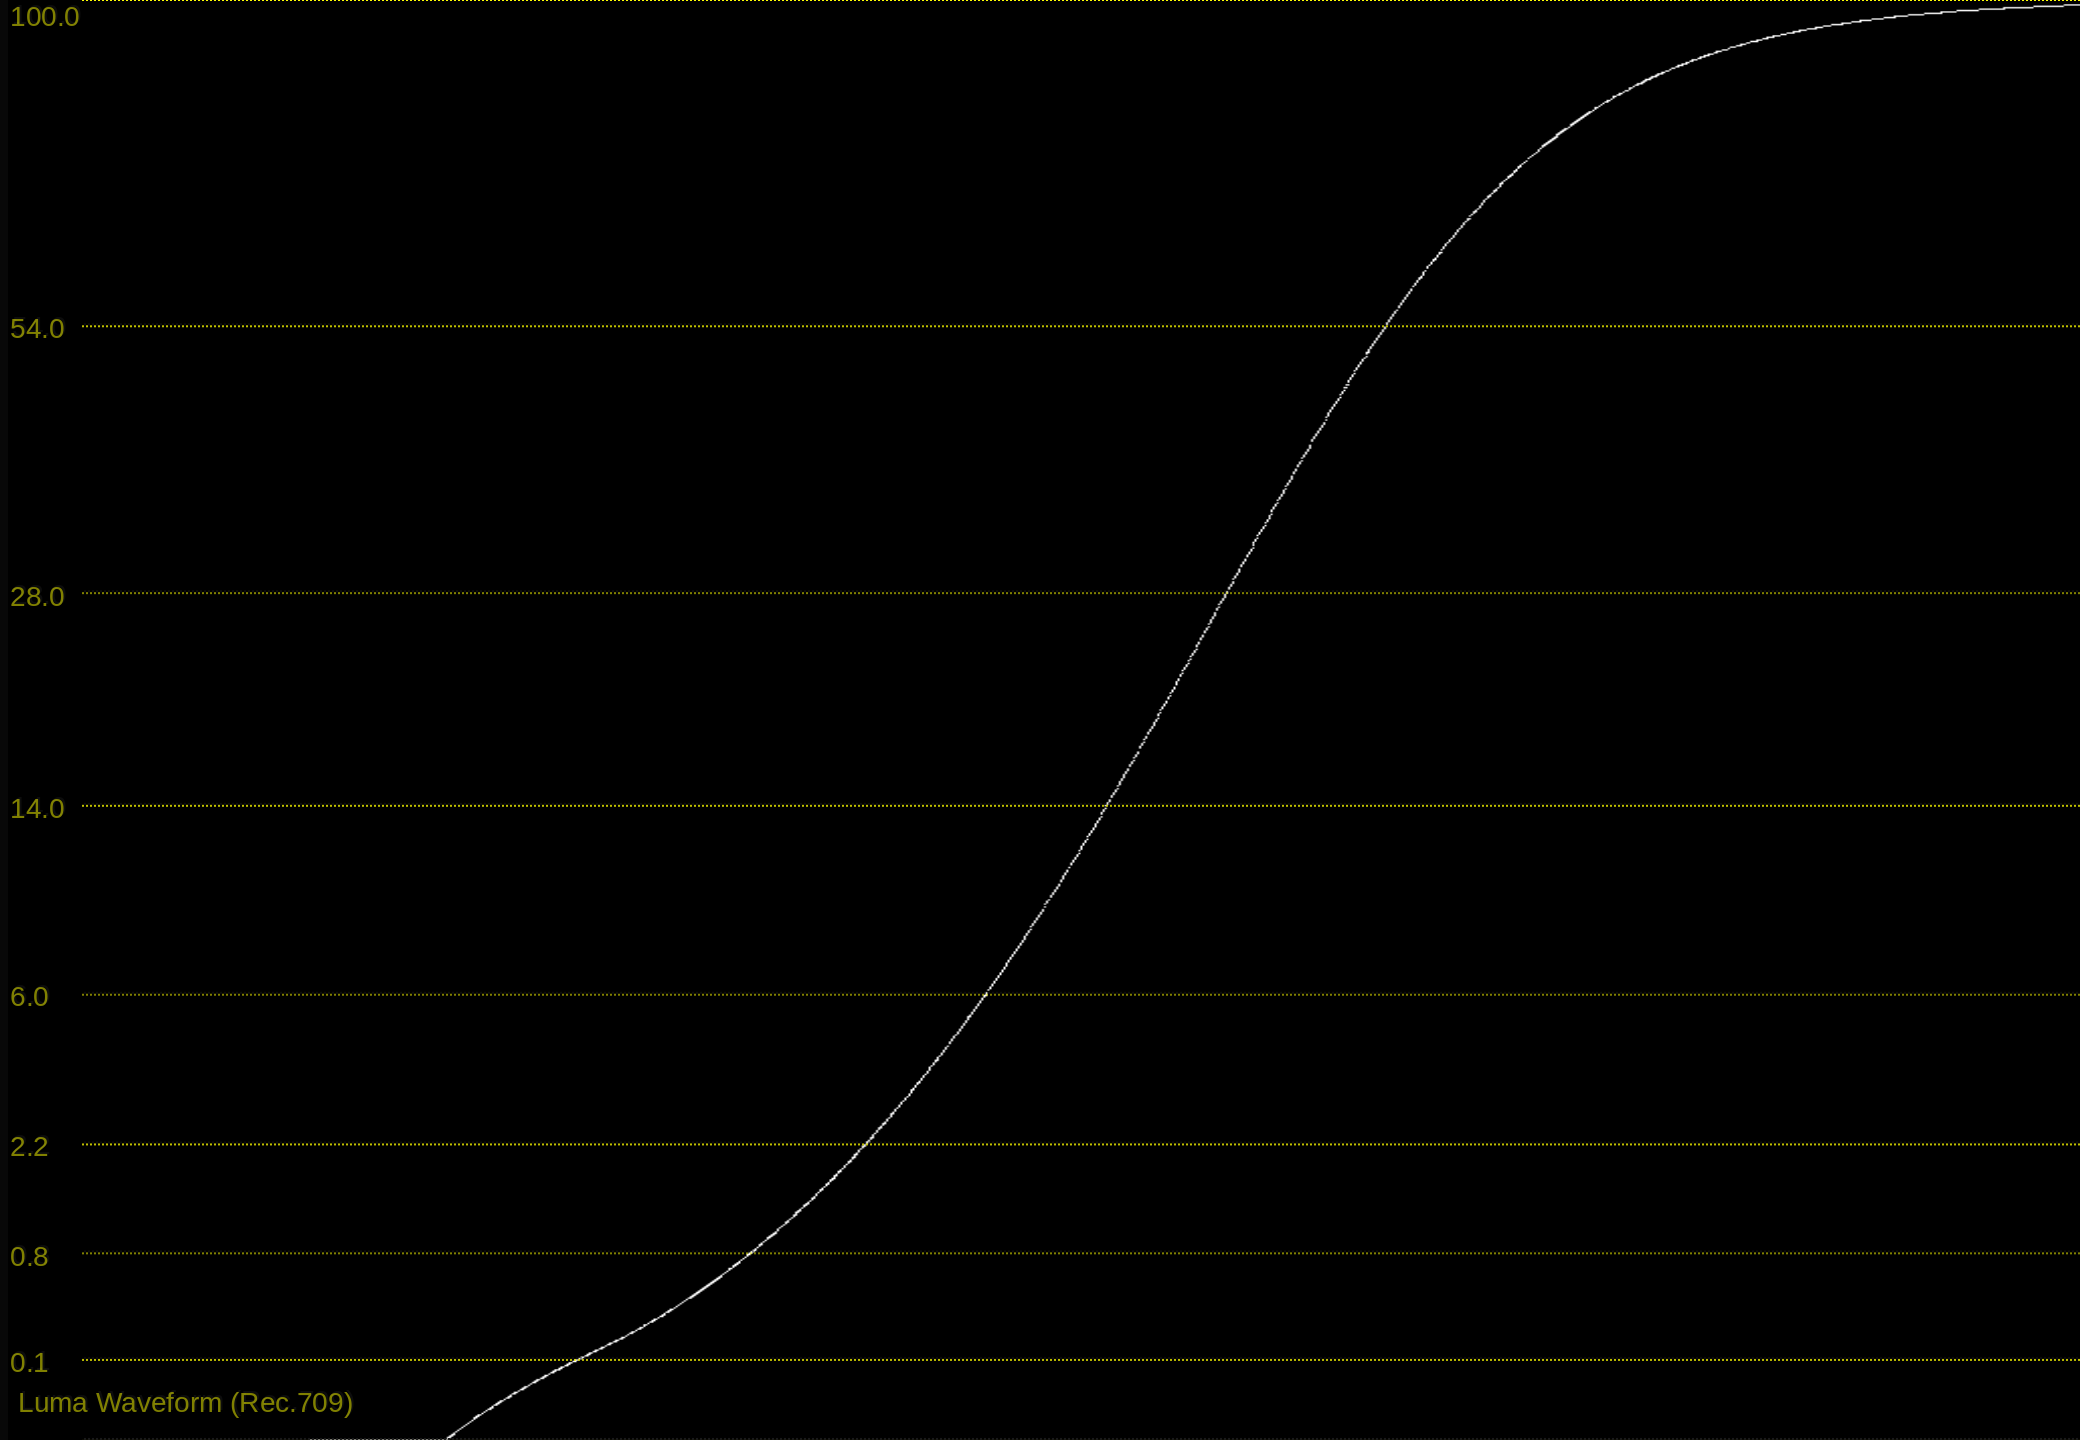
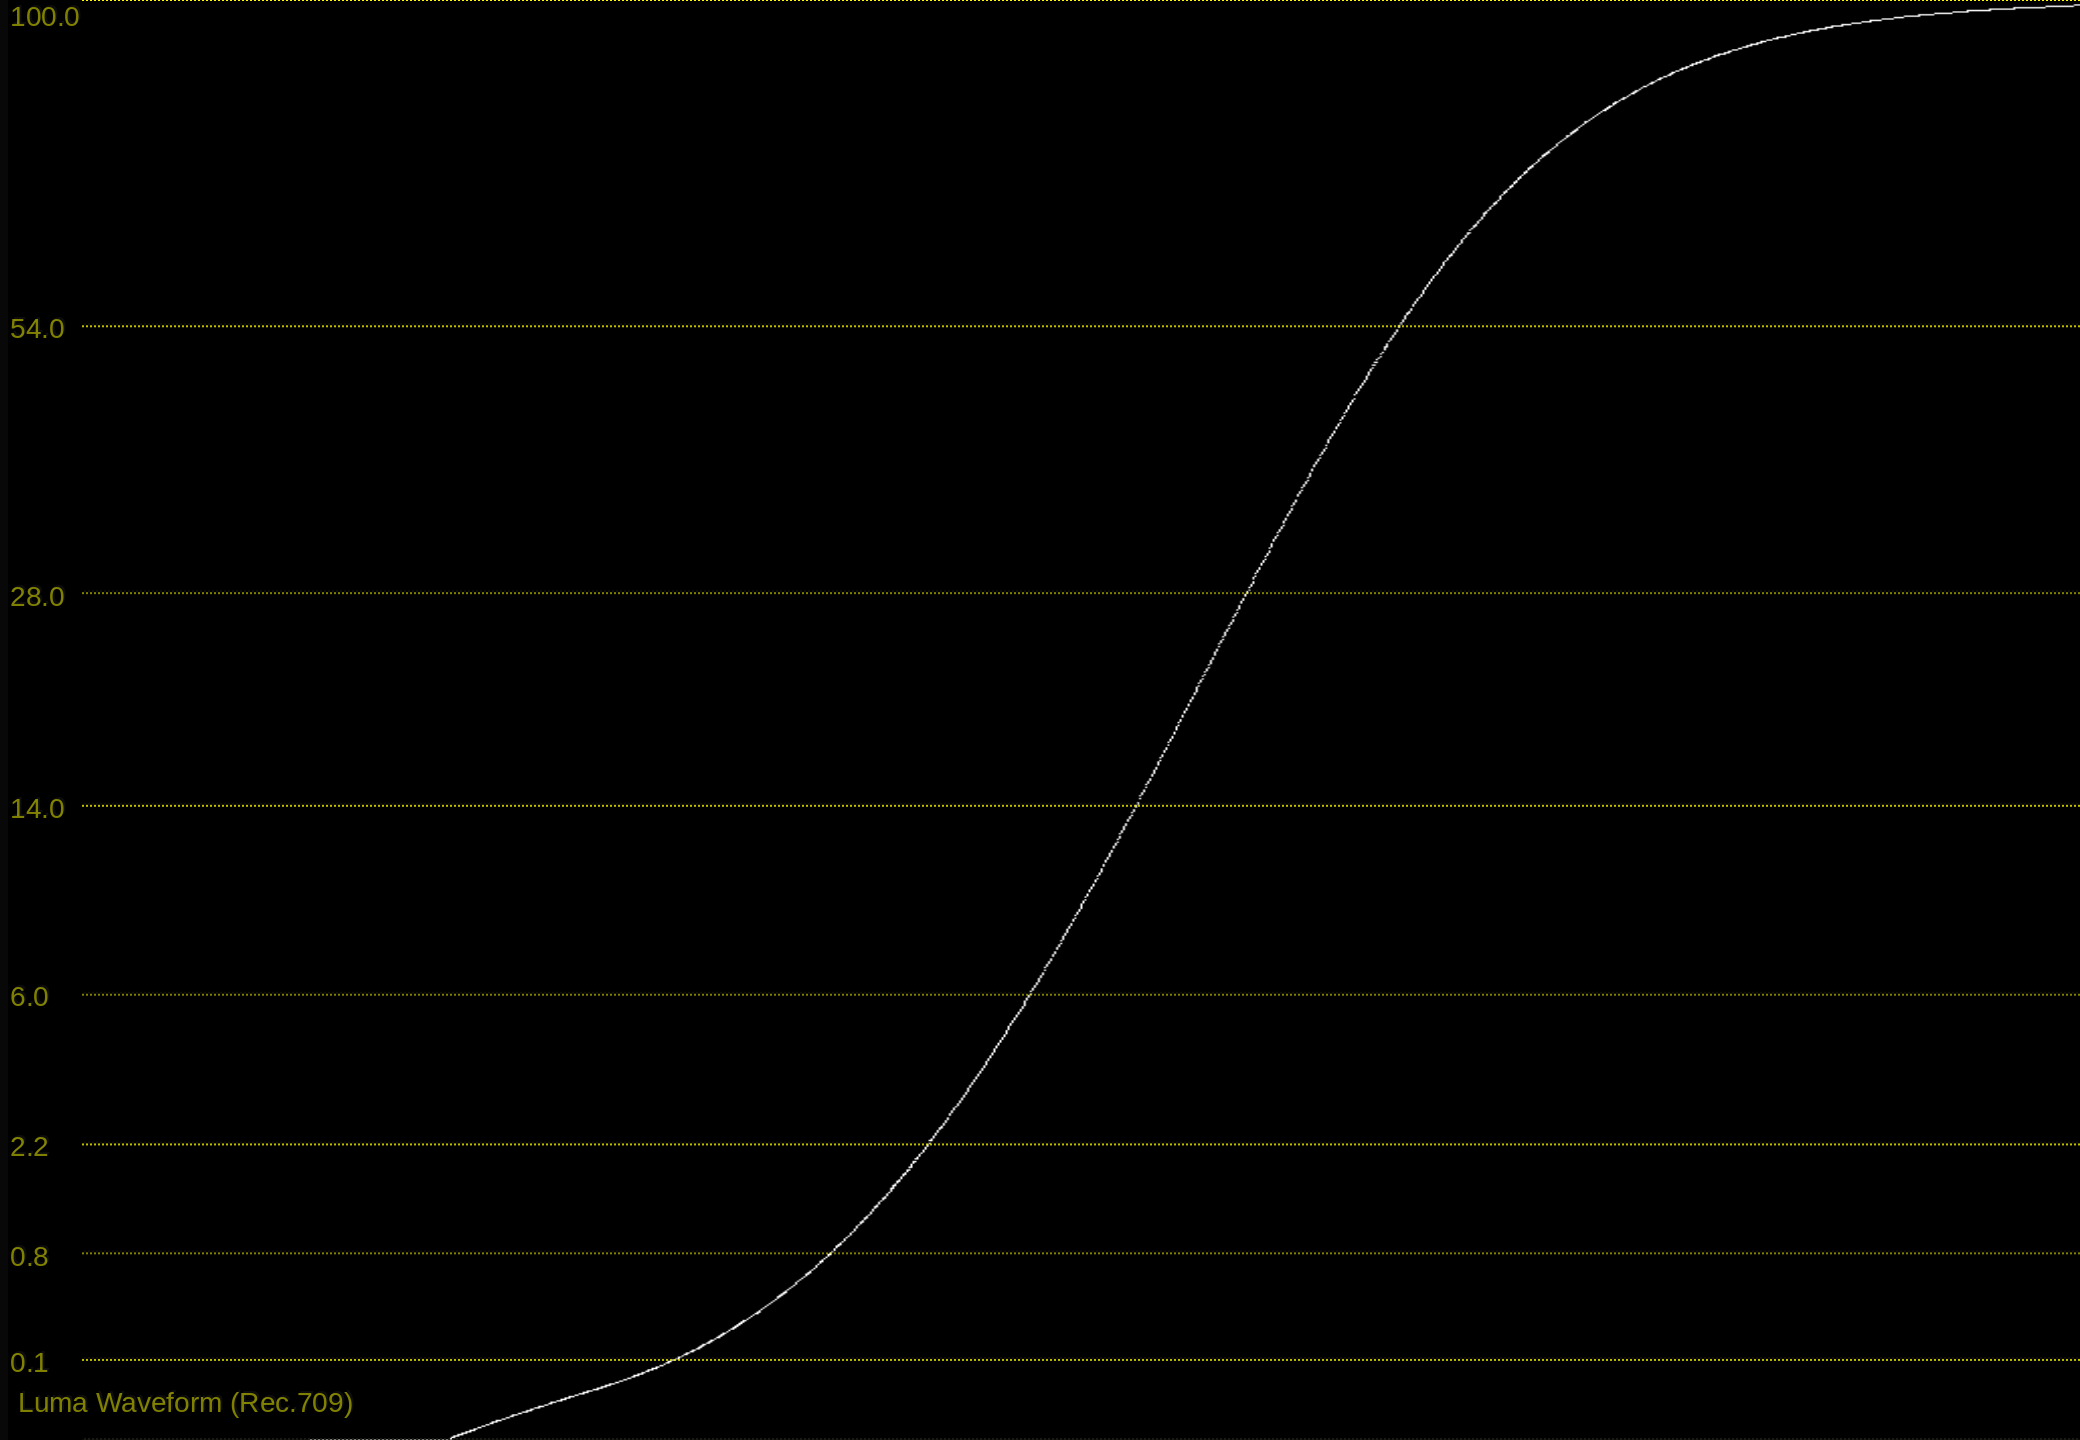
The MM-SDC tonescale hit 1.0 quite early. With this new one ACEScct 1.0 output is 0.998 and with ACEScct 1.46799 the output is 0.9999. The toe t1 value should probably be a bit higher. But it’s all very close…
Yes, and Jed figured out all this with his tonescales. So here’s a variant that now adjusts the exposure and the peak luminance also for closer match to MM-SDC. The exposure should be a match.
It adds a new parameter w1 that can be pre-computed and was derived in same fashion as in MM-SDC using Linear Regression. This parameter determines how quickly the curve hits the peak luminance.
where do your destination values in the linear regression desmos come from.
I think it is unwise to scatter the origins of your constants in separate place.
Also it is a bit strange to have an analytical model be driven by an approximation to unknown data points.
I would try to express what those values should do and model that instead directly
Agreed. Personally I’d like the curves to hit peak luminance at ACEScct 1.0 (or around 10 stops above mid grey) but this isn’t doing exactly that but that’s what I tried to hit with those numbers. I’m equally unsure how Jed derived his numbers.
Looking back at my tonescale models colab, I realize I did not describe well my thinking behind what scene-linear value we decide to map to peak display value. I’ve added a bit more description on this topic there, but in short:
For all 3 of the tonescale models I shared in that colab, the scene-linear value to peak display value mapping roughly follows the following table:
L_p
value
100
35
600
65
1000
75
4000
100
The regression fits you see linked in the colab code are to find a function of L_p that roughly fits these values through the tonescale function, so that we can smoothly vary L_p and get an “interpolated” result that makes sense. FYI there are also a few variations of tonescale functions which allow you to explicitly specify this mapping (at the expense of mathematical complexity), in the tonescale functions colab I posted earlier.
I don’t believe this is the only valid approach though. I think @daniele suggested in one of the meetings last year to have a constant peak white mapping, perhaps based on the peak value of the log space used for grading (ACEScct in the ACES system, I guess). There are pros and cons to each approach that should probably be considered.
Edit: removing the term “luminance”, because this discussion really has no consideration of color information.
Yes, agreed on all points (sorry for the confusion). In my post above I’m only talking about m. I’m using different names for the variables, but the models I built are exactly as you describe:
pre-tonemap multiply adjusts position of grey (overall image exposure)
post-tonemap multiply adjusts position of peak / max value (HDR/SDR scaling and peak value position)
Additionally (in case it is not clear) all of the tonescale models that I built are driven with one user parameter (L_p), which in turn drives the variables of the tonescale function. The tonescale functions generally have the following variables:
pre-tonemap multiply
pre-tonemap power function (only in the “dual contrast” tonescale model)
post-tonemap multiply
post tonemap power function for “contrast” and surround compensation
I still think that tone scale match between SDR and HDR should be driven by w and not m. m shall be used to map any number (in my first suggestion it is inf+) onto the top end of the output scale. We can trivially change it to 1.0 in ACEScct or 128 or whatever… Not sure if this is an important factor now. It barely changes the appearance of the curve.
I think it should be possible to hit the display peak without having to create crazy scene values. I don’t know whether fixed limit or a variable range is better, but the limit(s) should be decided. It’s of course possible to match exactly what MM-SDC candidate uses right now and just go with that.