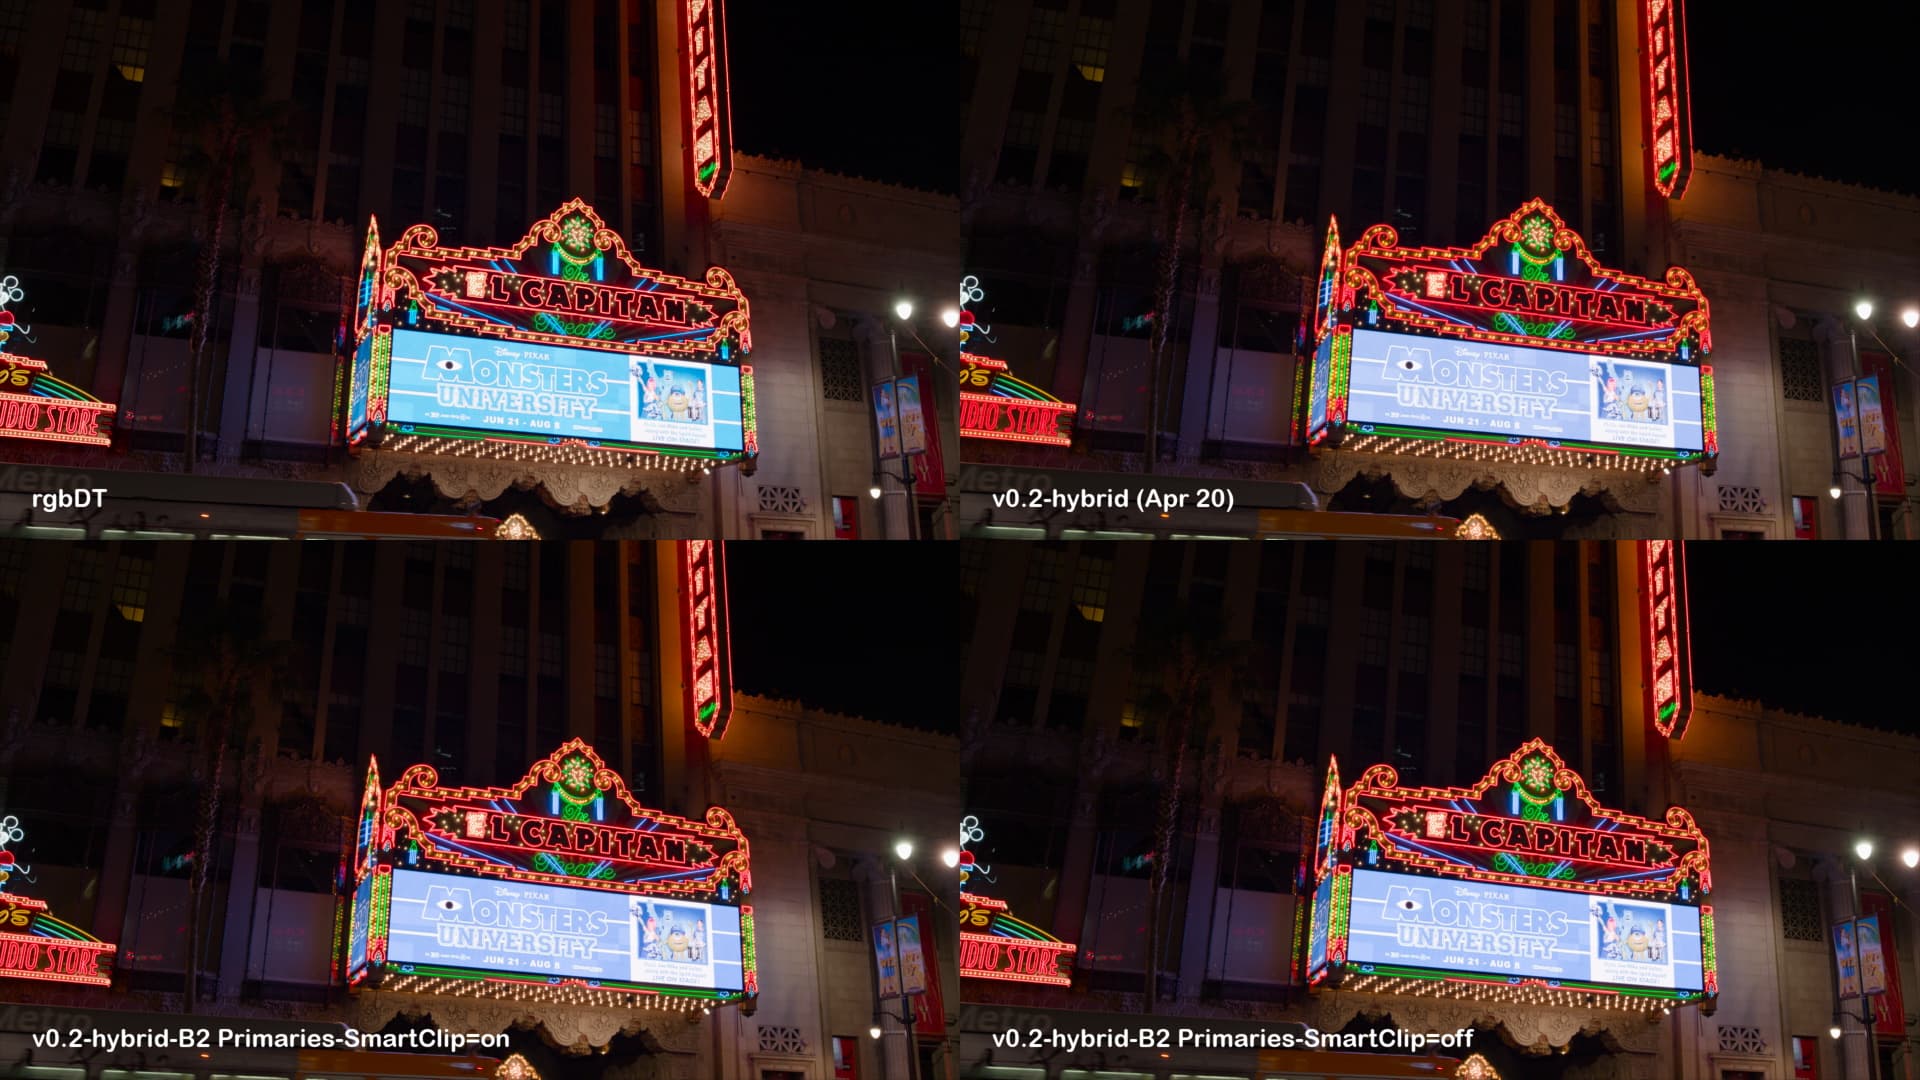
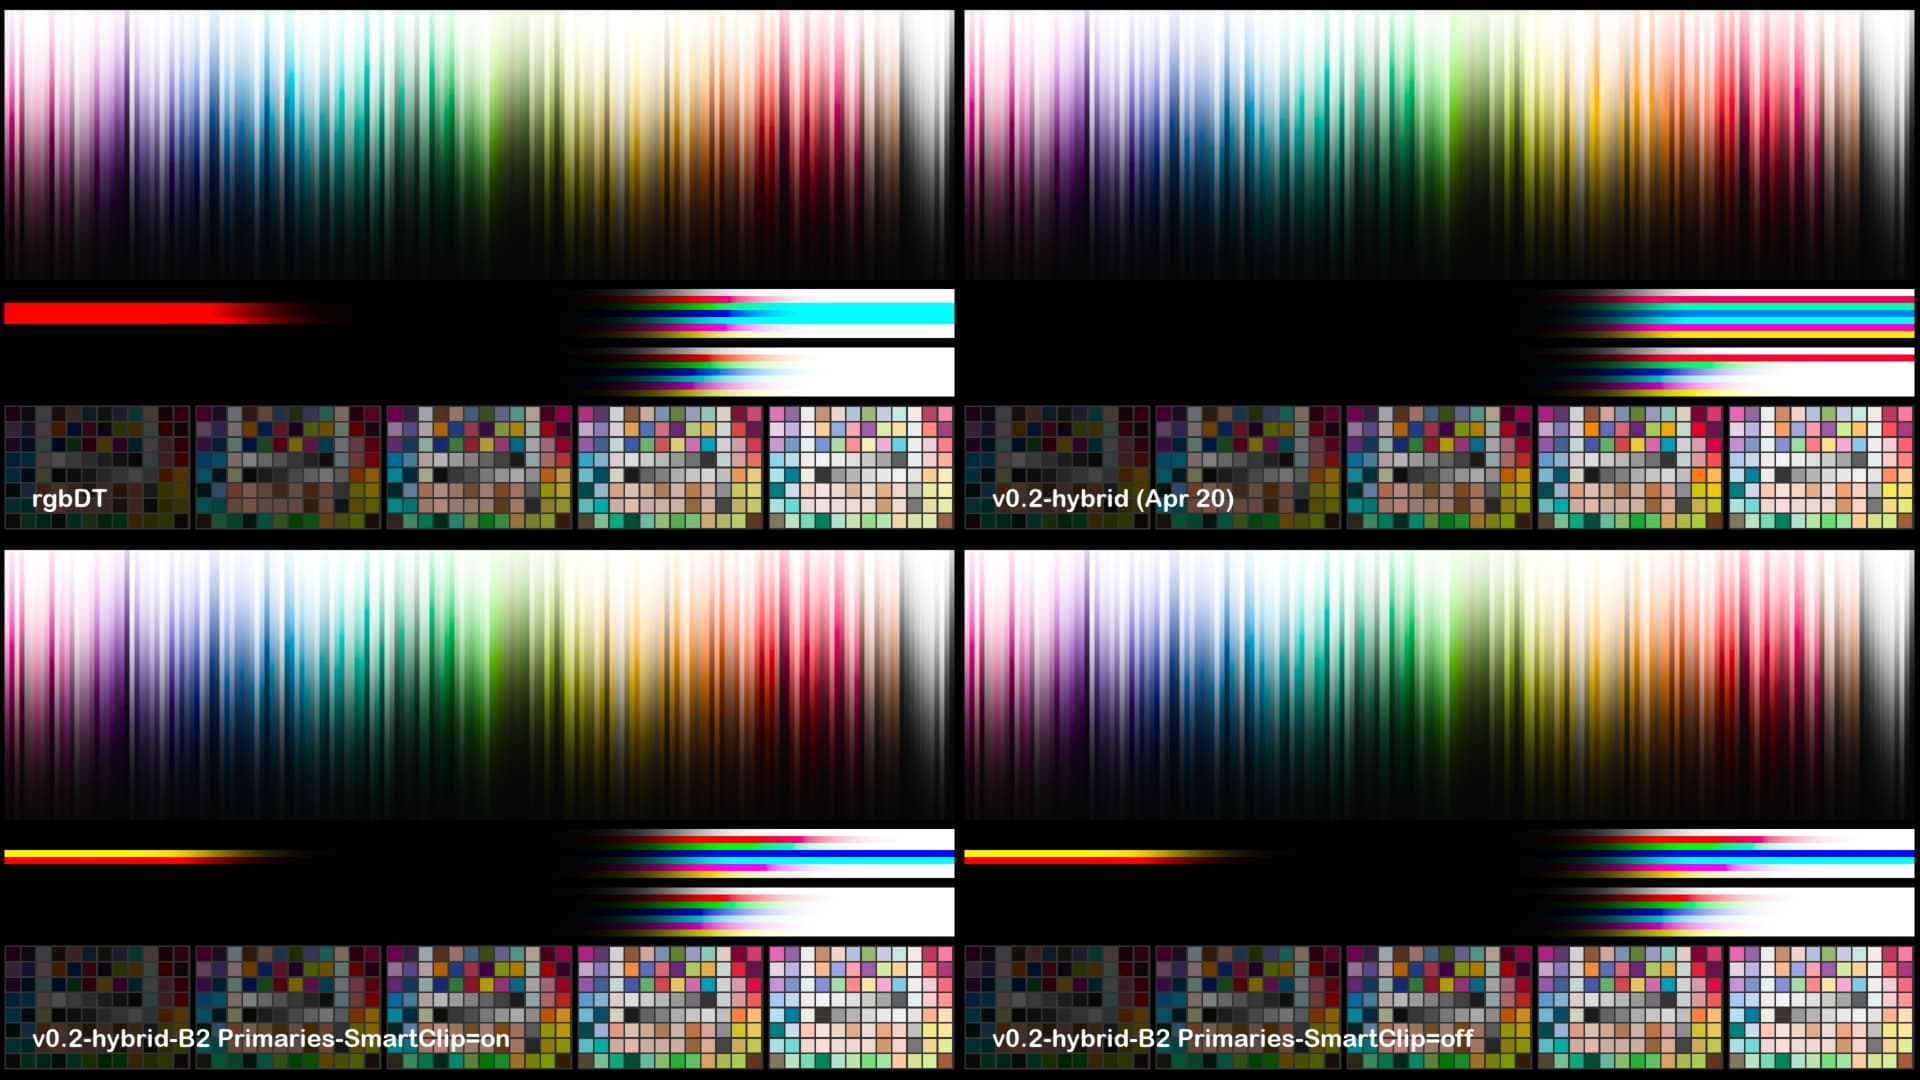
In last week’s meeting (April 20), I presented a hybrid rendering that reused an algorithm from a prerelease version of ACES (specifically v0.2). This transform was hastily kludged together using the MM Spring Dual Contrast tone scale model that is currently being used in the other two candidates and a “hue restore” algorithm that was the key component of ACES v0.2. This algorithm adjusts the middle component of the post-tone mapped RGB triplet in order to restore the ratio of values relationships from the pre-tonemapped RGB triplet.
Right now, the algorithm only exists in CTL, which as we know is slow and not great for interactive development work. I have enlisted @alexfry to assist me with his Nuke wizardry to generate us a Nuke node with parameters for rendering primaries and the two toggle options I explain below.
Rendering Primaries
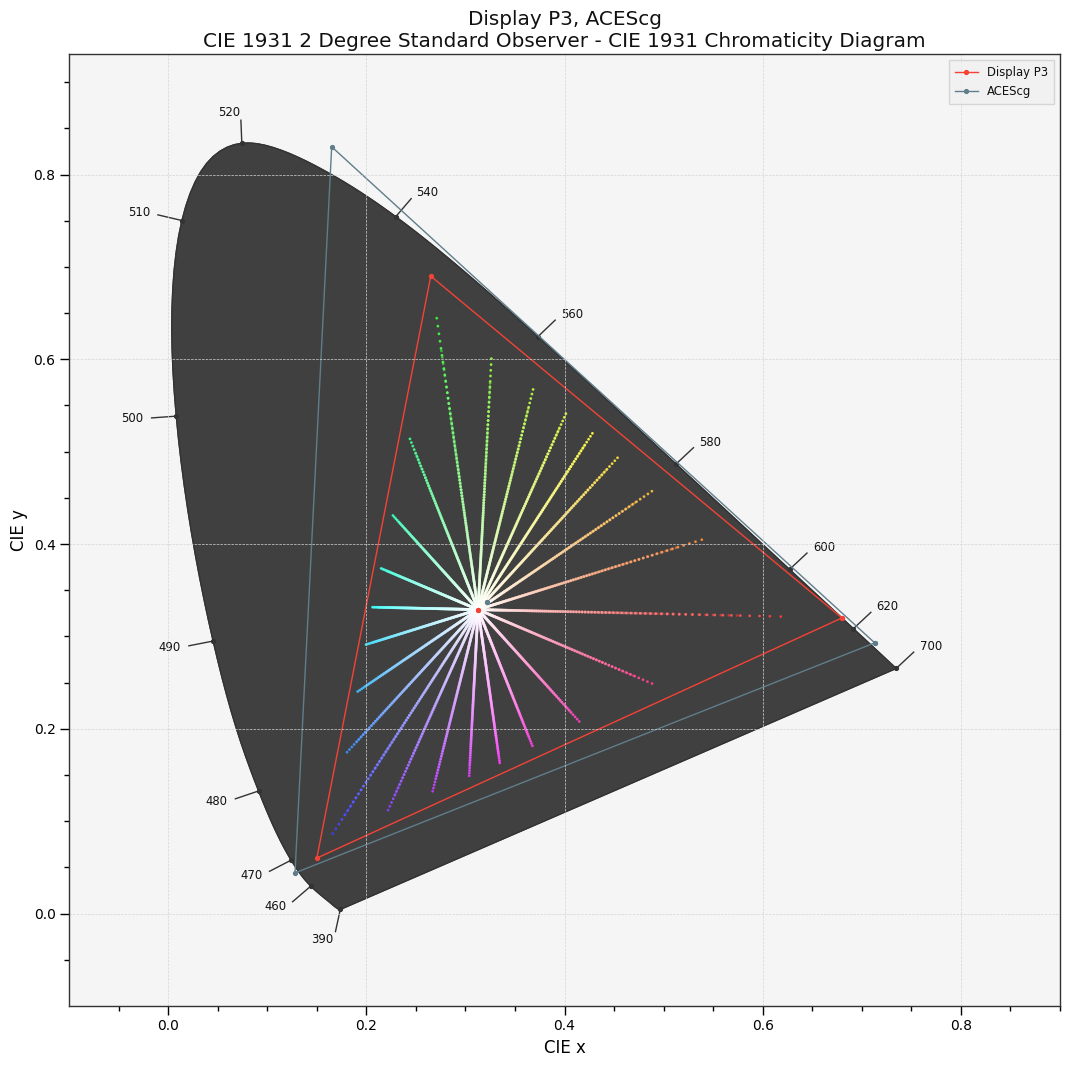
In the version I showed on Wednesday, I had not yet experimented with the effect of changing the rendering primaries - but even using AP0 as the rendering space, was getting pretty reasonable results.
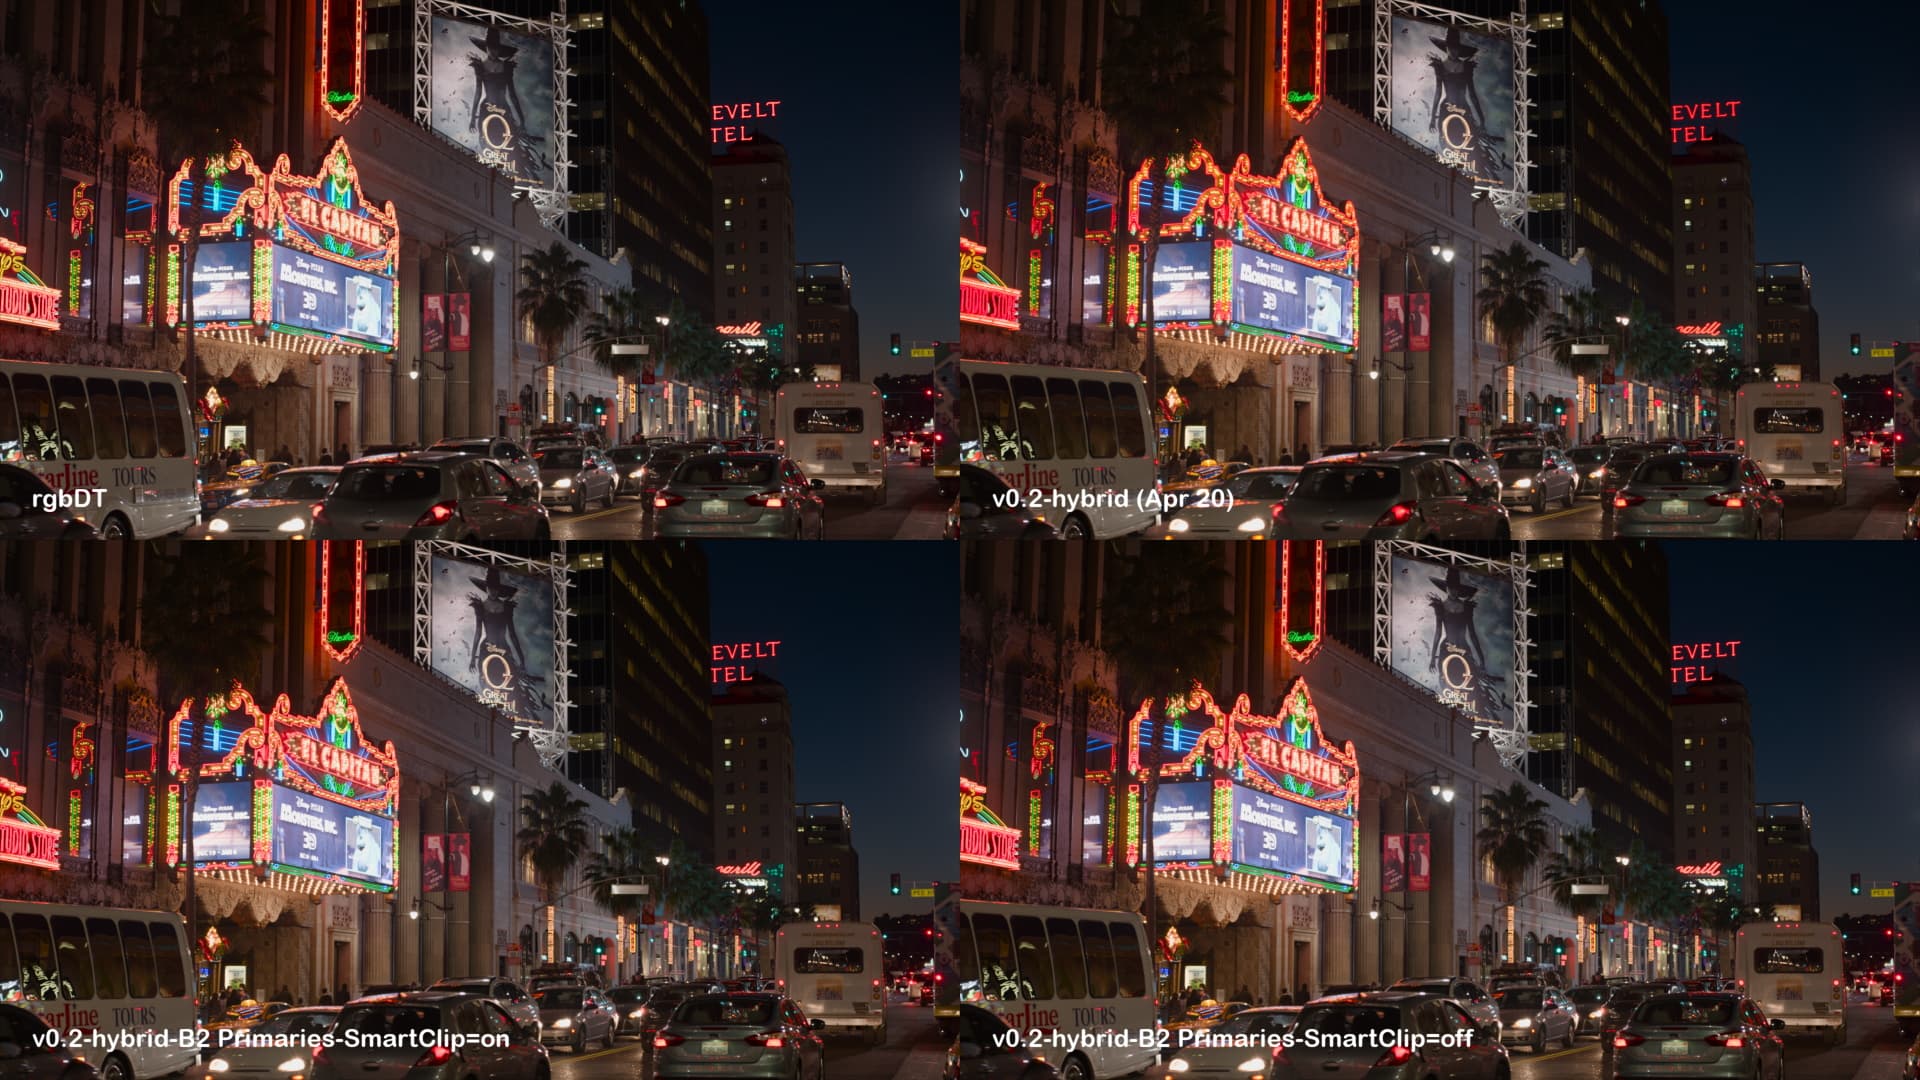
As mentioned in the meeting, the most obvious excursion from other models was that bright saturated reds were clipping, specifically in the P3 ramps of the ACES synthetic chart. I traced this down to the fact that those ramps were P3 and as we know the P3 red is actually outside the spectrum locus and also AP0.
I tried a few modified rendering primary sets, starting with a minimal expansion of AP0 and ultimately expanding it a few more iterations. I did this extremely unscientifically and was truly just typing in random values. (There is surely room for more intelligent fine-tuning to be done here if we determine this approach to have any promise… )
In this process I also moved the blue primary over away from the vertical axis, but not so far as rgbDT or ARRI WideGamut. This decision, too, was completely arbitrary and but didn’t seem to egregiously break anything, so I kept it there for now.
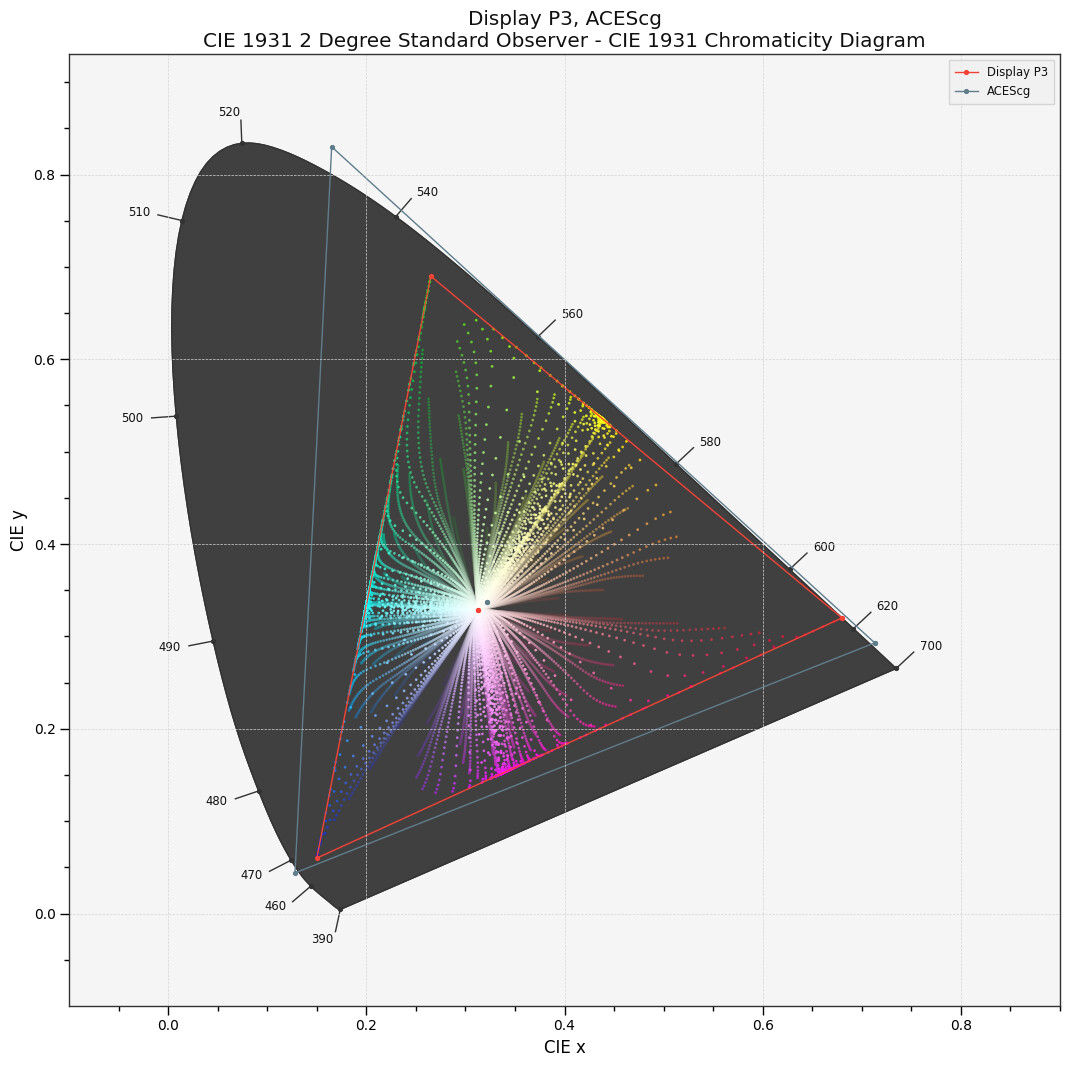
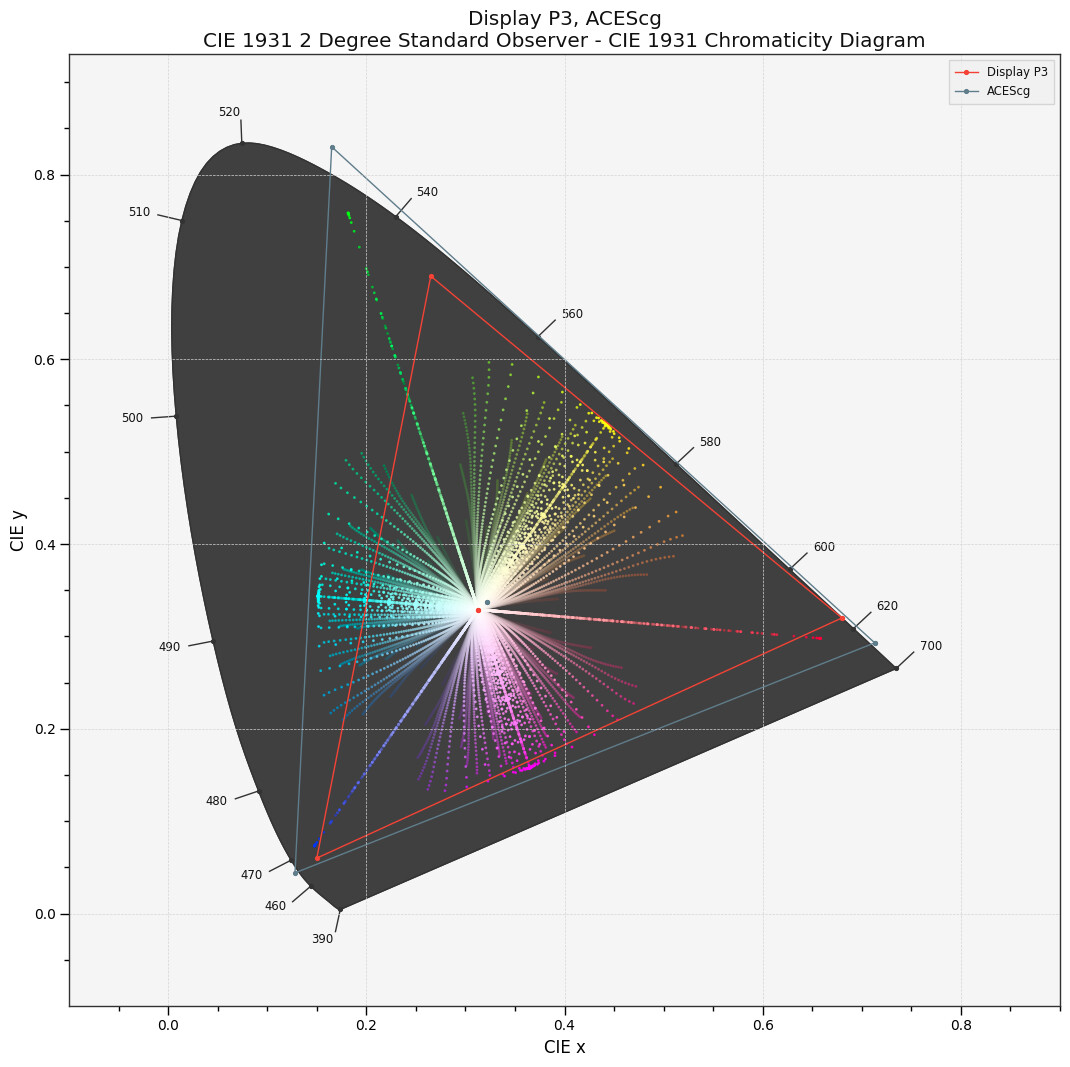
Here is a plot showing the primaries I used in the renders that appear later in this post - labeled as “B2”.

And the right two images show the effect of moving the primaries to enclose P3 red on the P3 ramps (the P3 ramps are the second set of horizontal ramps across the middle of the image). Note that the red in top right is staying full red up to a max ACES value, whereas in bottom right, it fades to white like the other P3 primary/secondary ramps do. Also, moving the primaries outside of the ACES primaries leads those ramps to desaturate too (except blue and cyan, which needs further investigation…)
Choice of which RGB values to perform restore with
Negative values can exist in ACES images. Also, the process of converting from AP0 to some rendering primary set, it is possible for negative values to be created out of previously positive values. As of now, there is a clamp of negative values prior to the application of the tone scale. It is currently unclear the impact such an operation may have on complete invertibility (though a round-trip of output>ACES>output should still be possible). There is a switch in the code as to whether the ratio restore uses the pre-clamped values or the post-clamped values as the “pre-tonemapped” RGB to which the post-tonemapped RGB are manipulated to match. This needs further testing but will be easier to see the effect once “Nukified”.
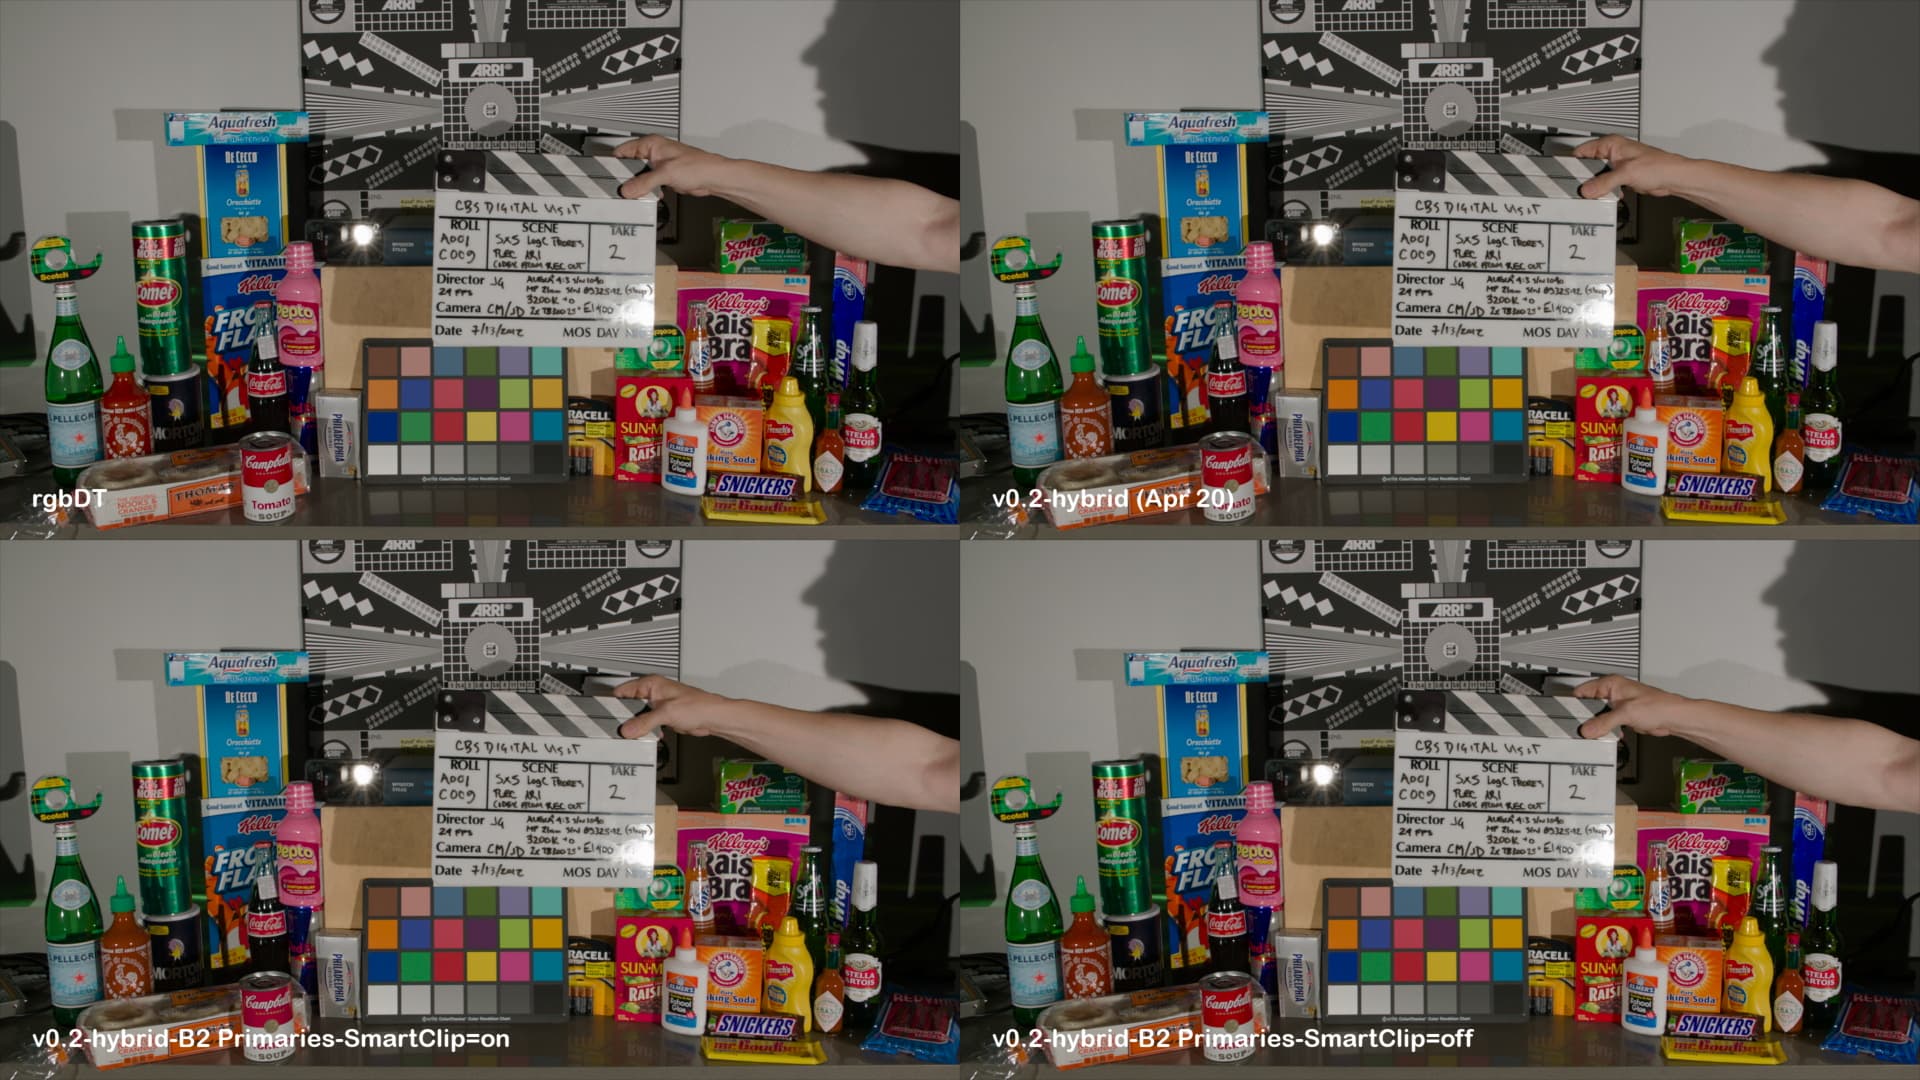
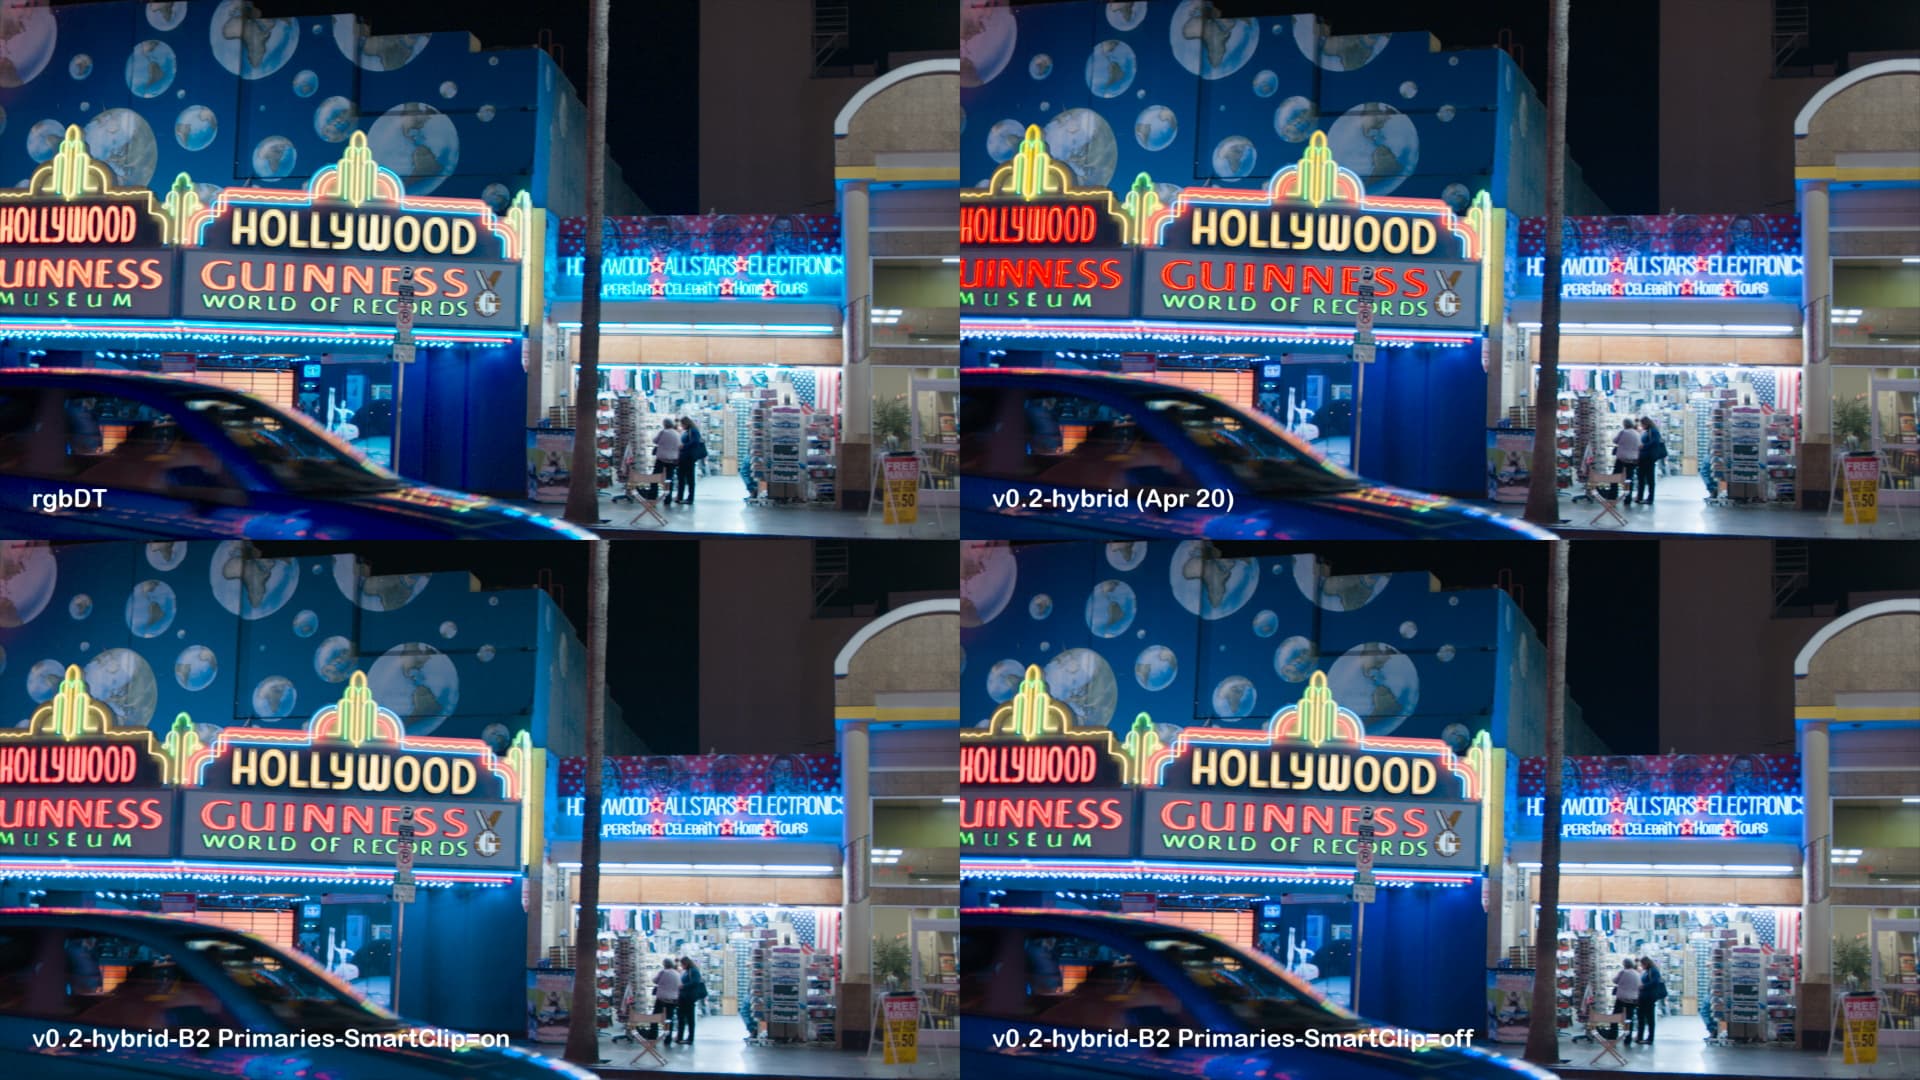
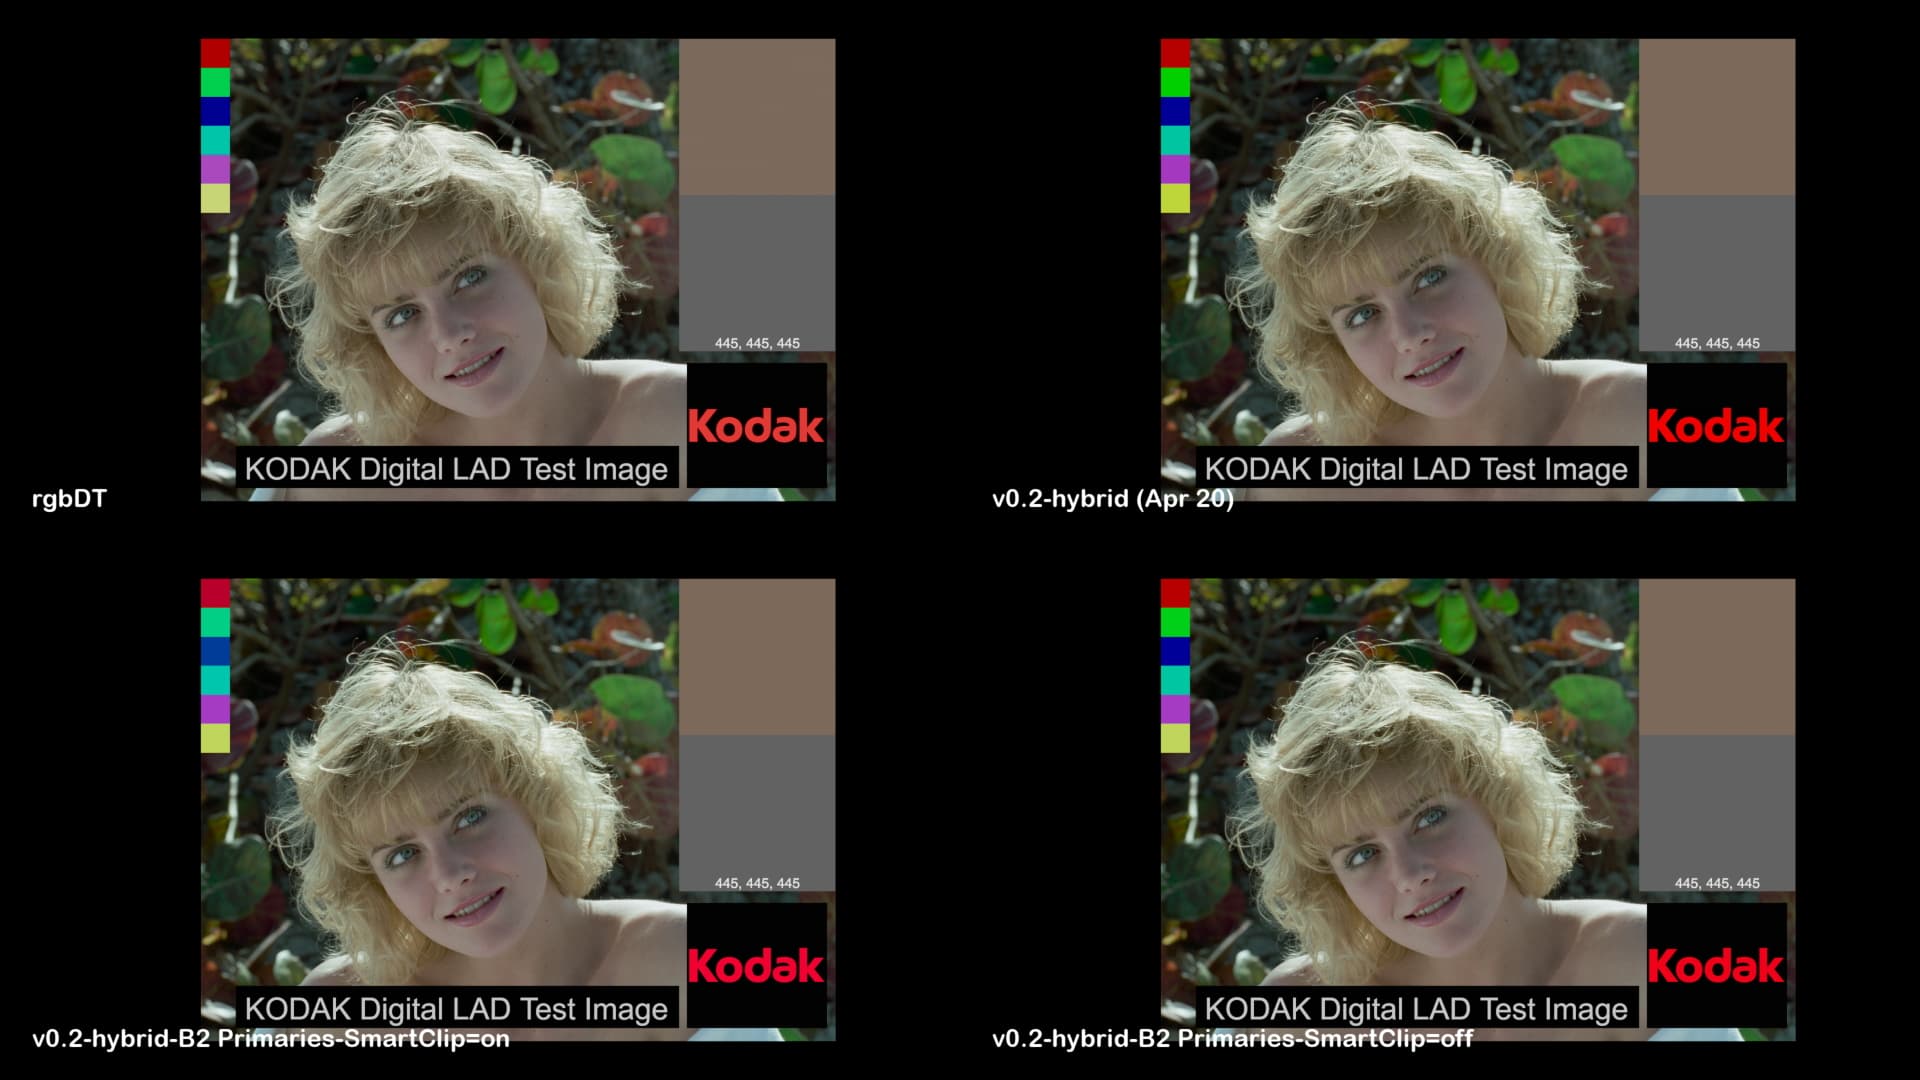
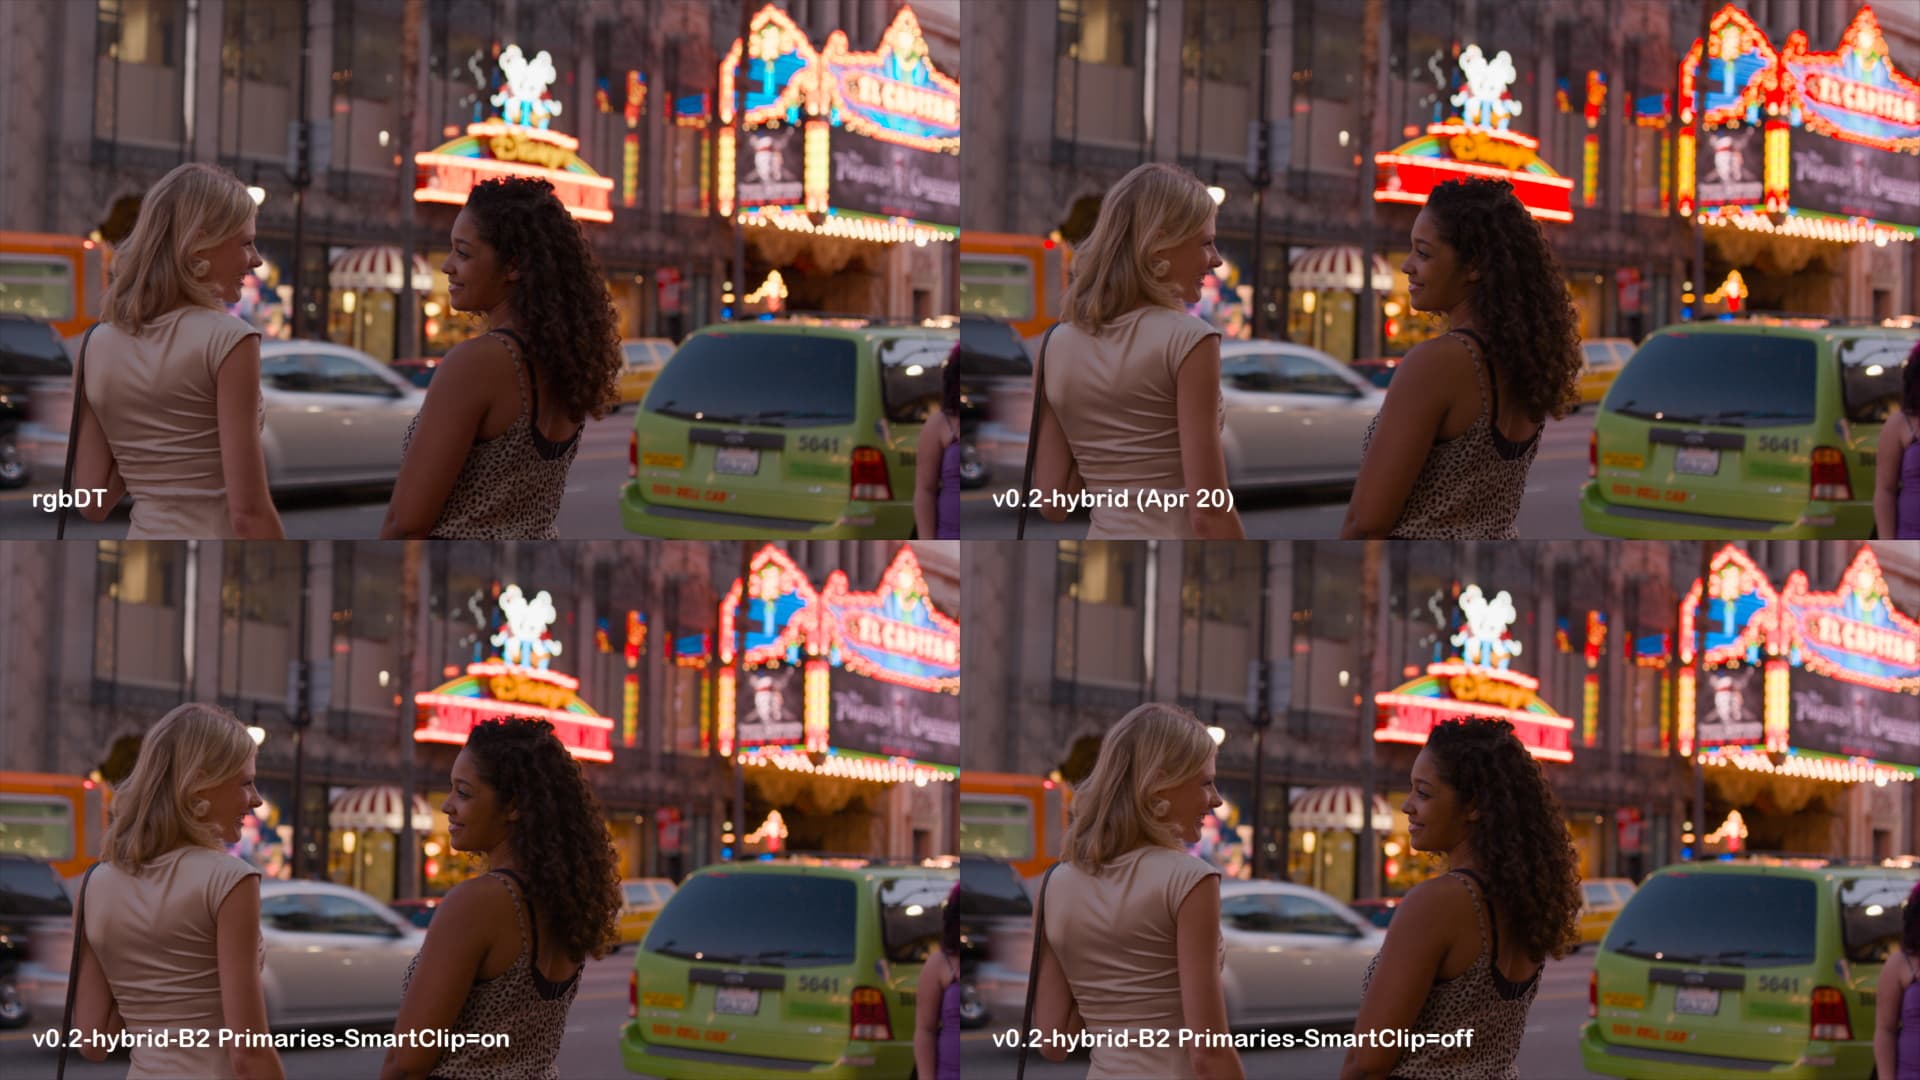
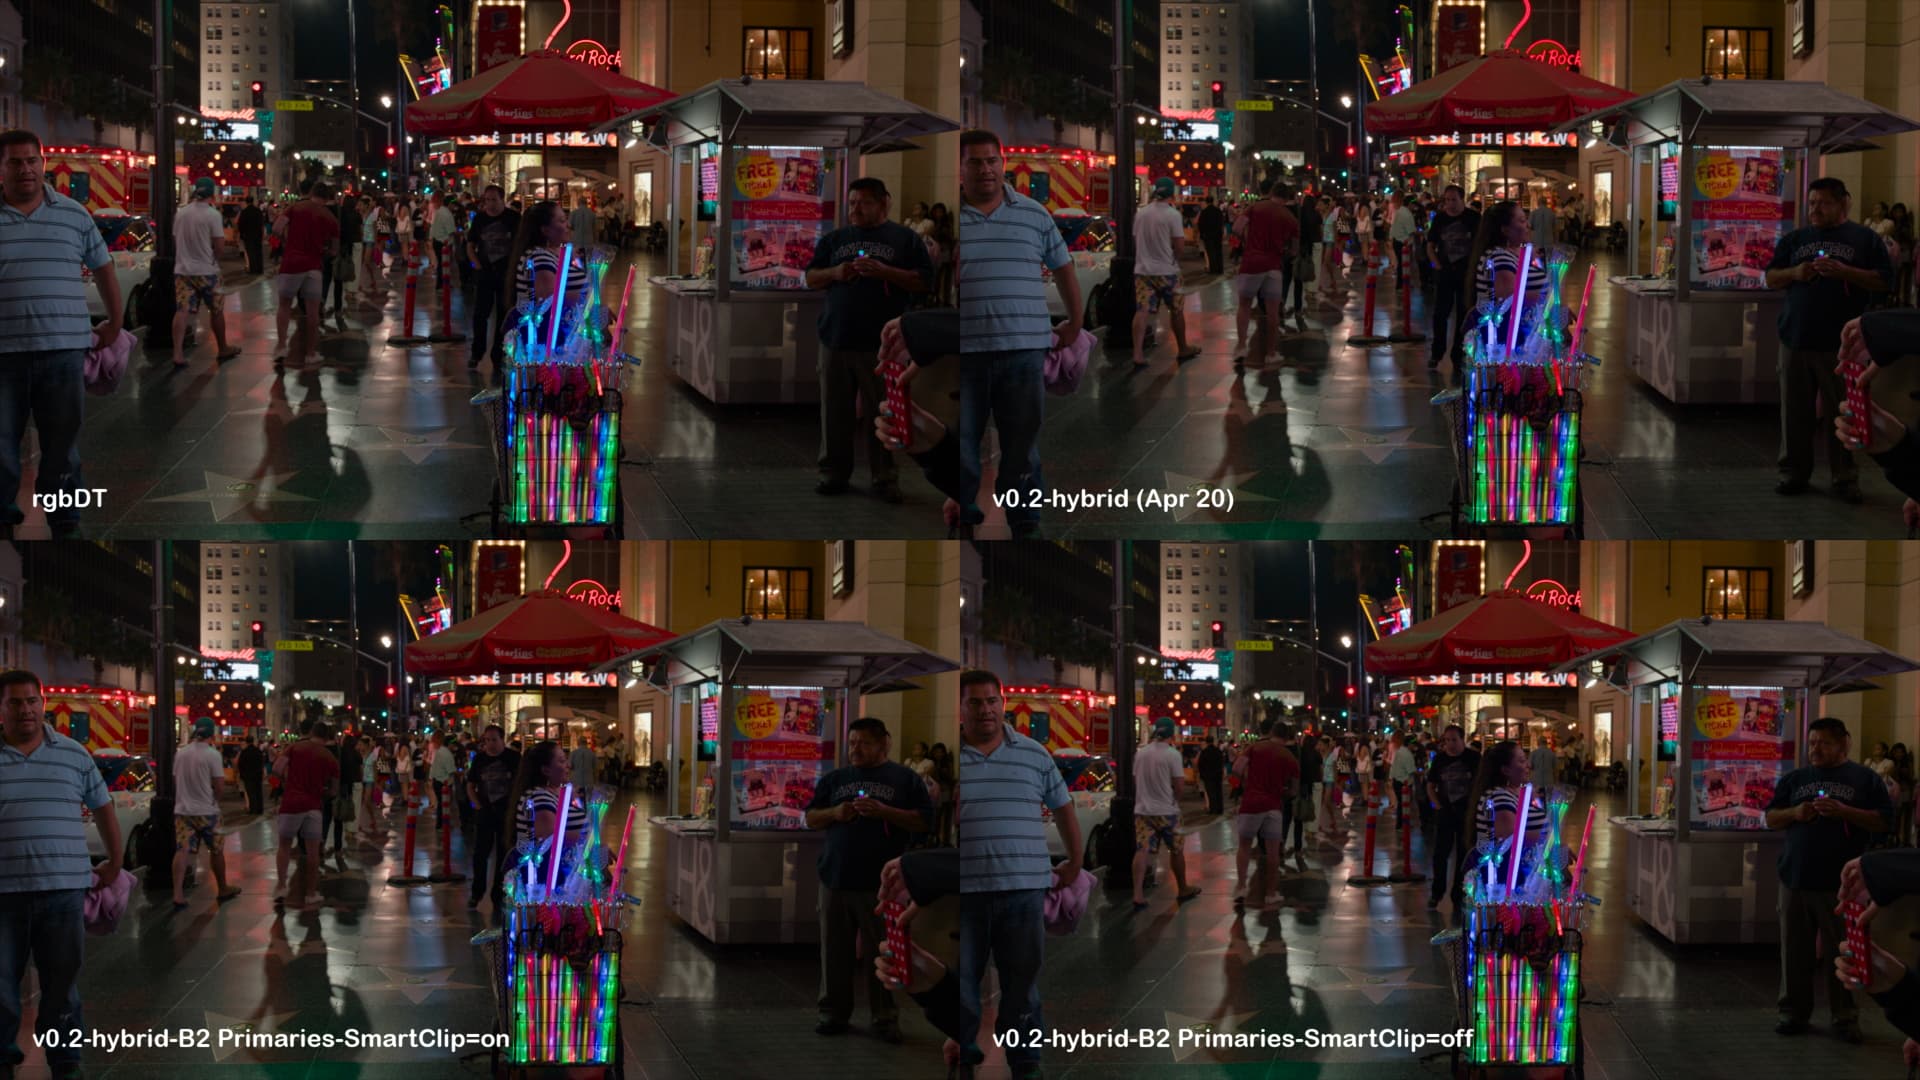
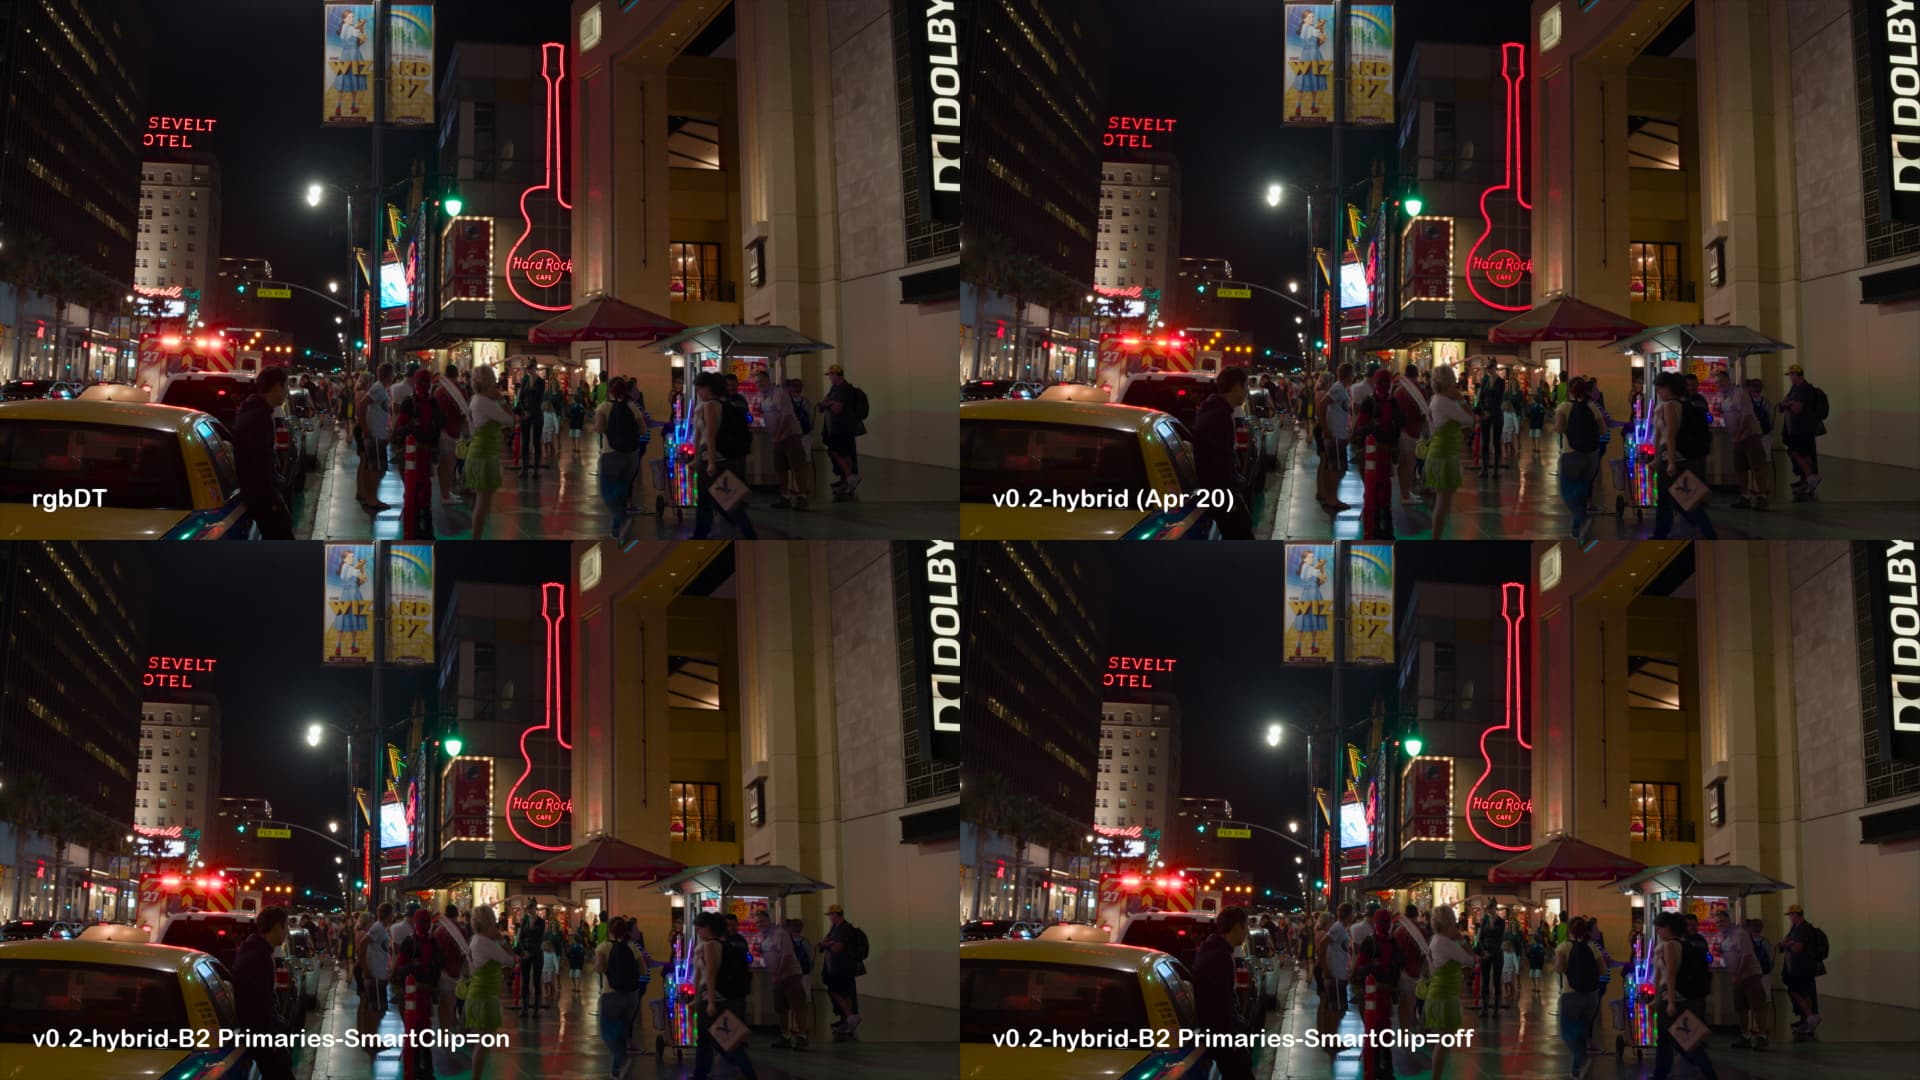
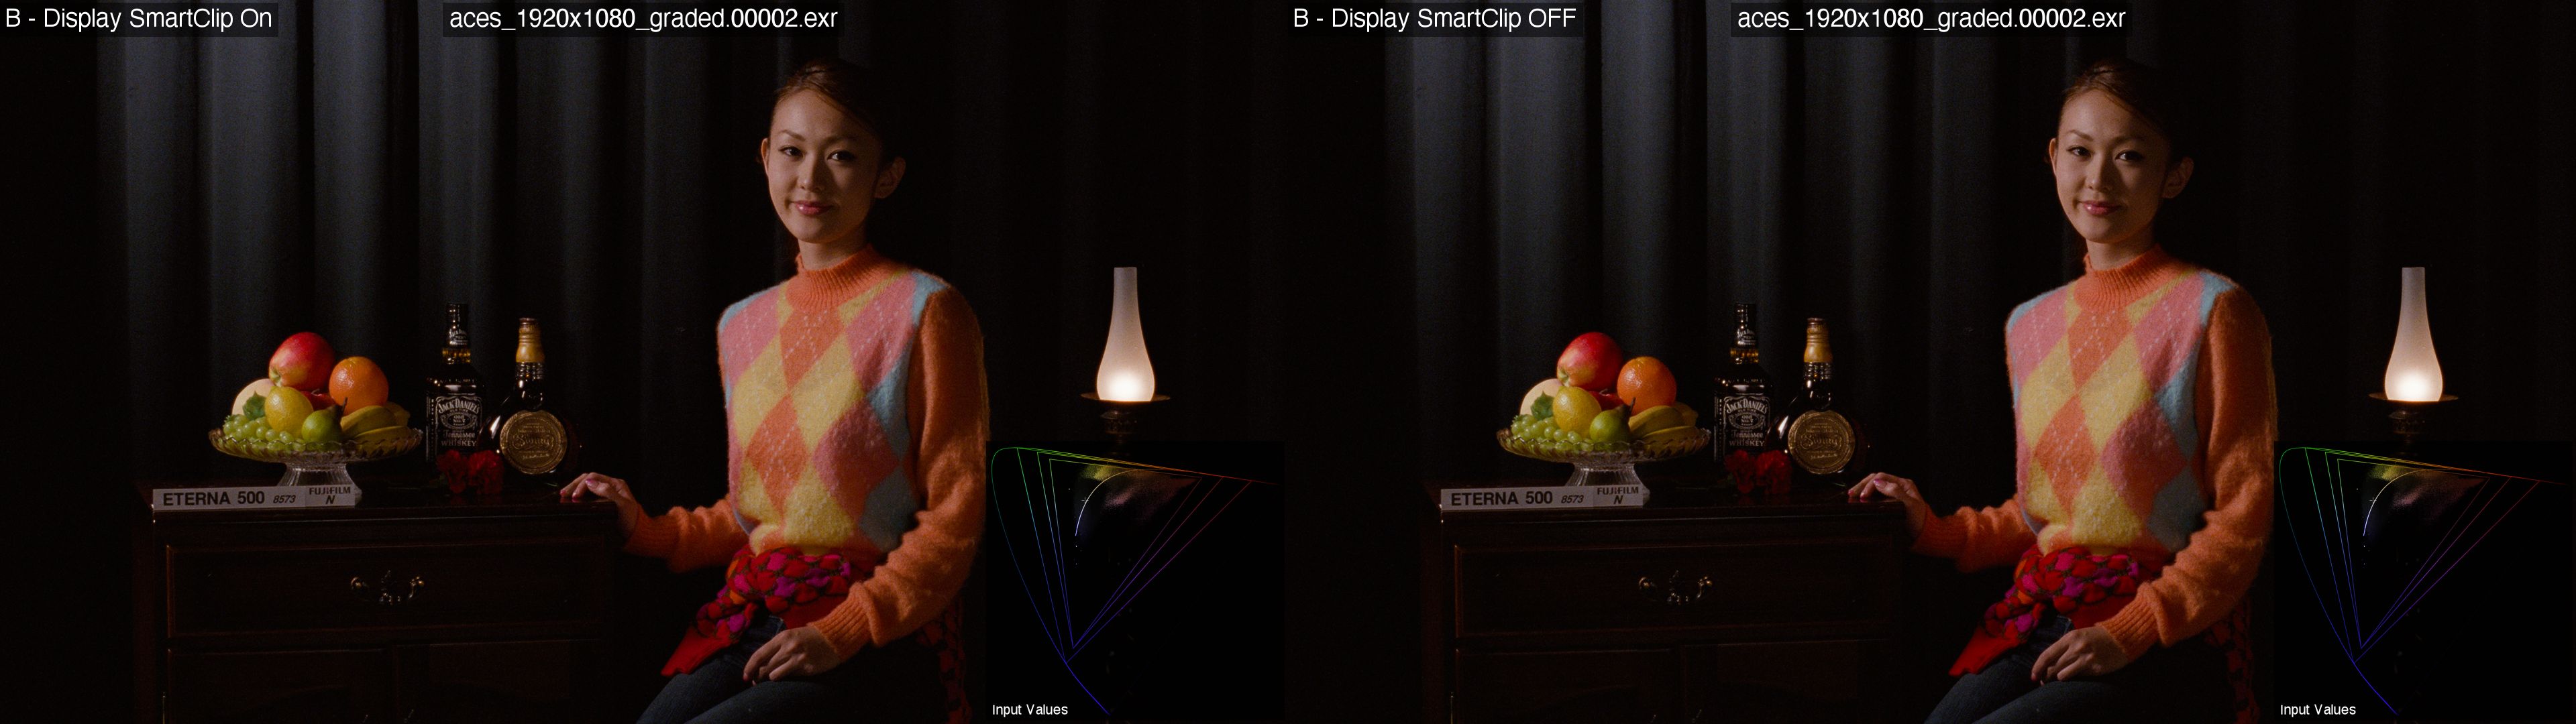
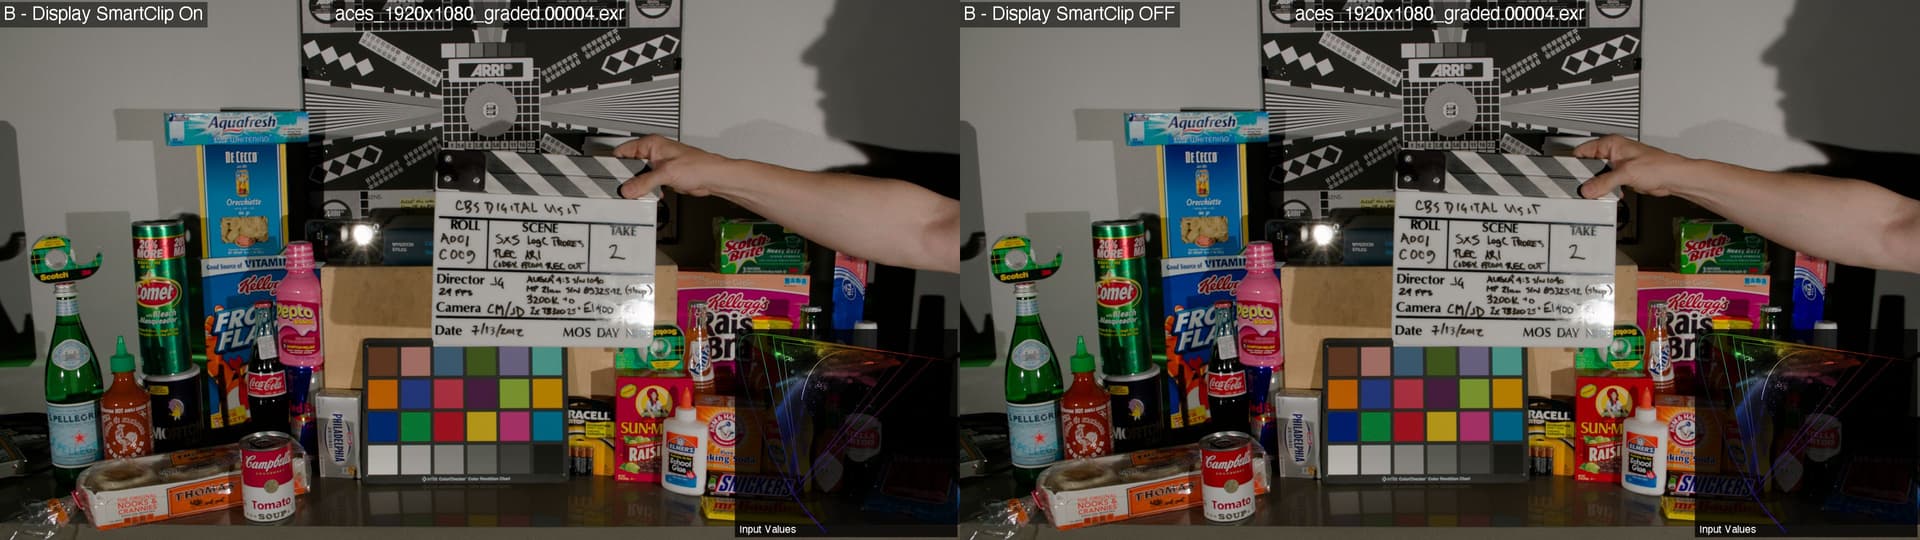
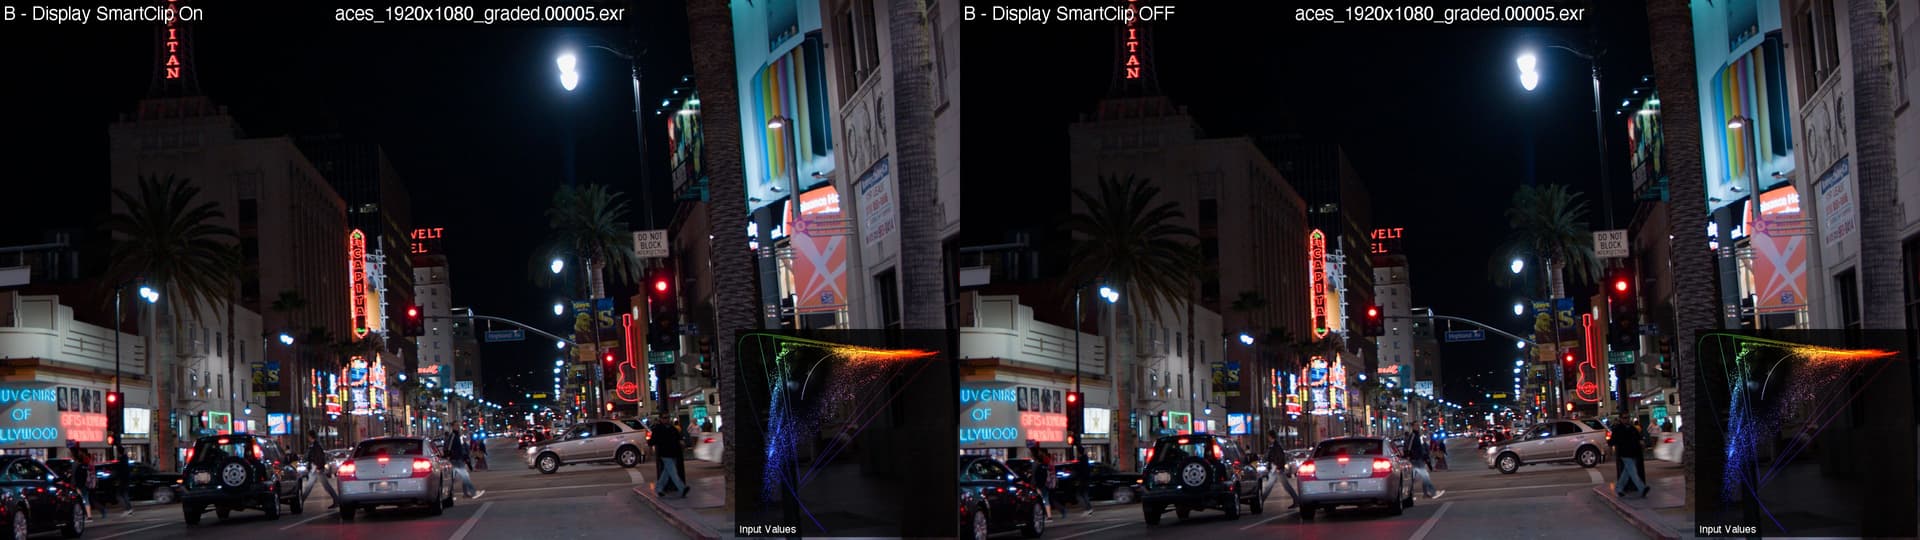
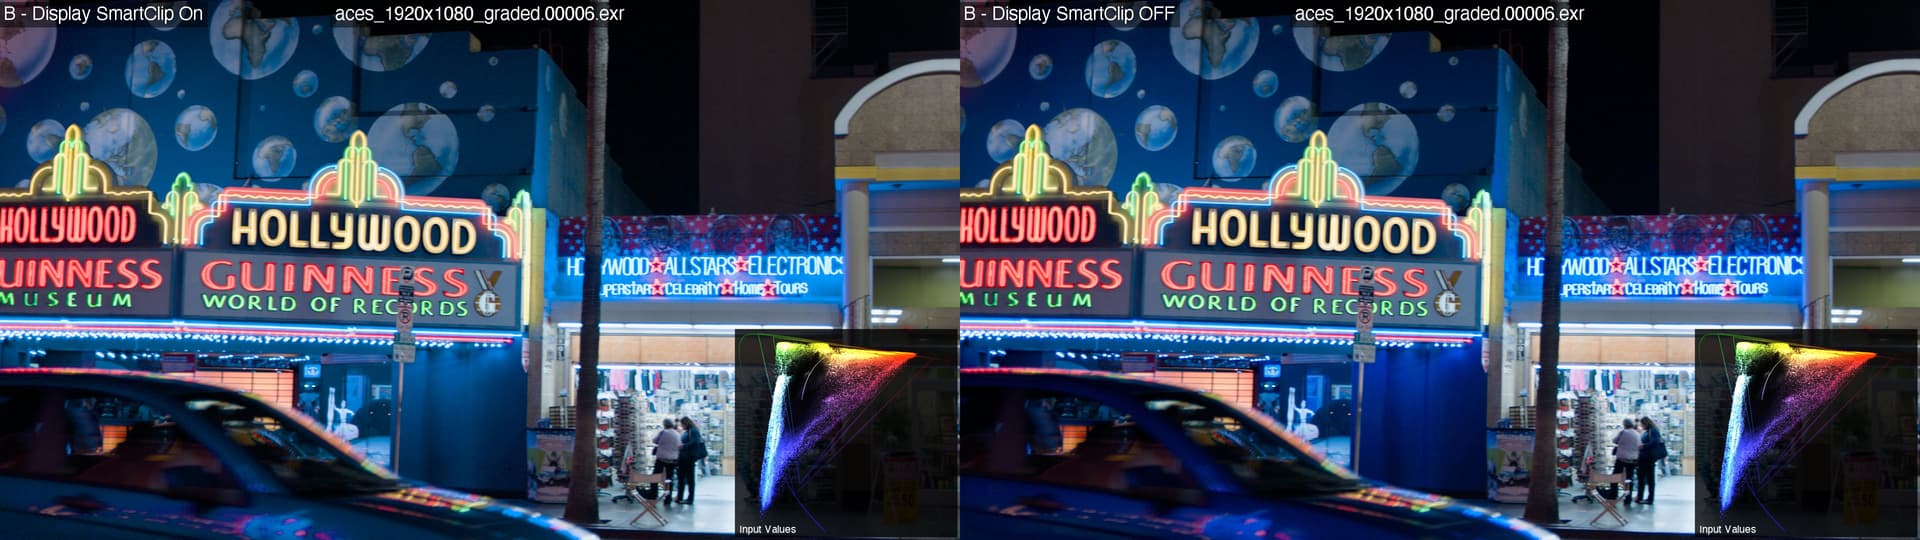
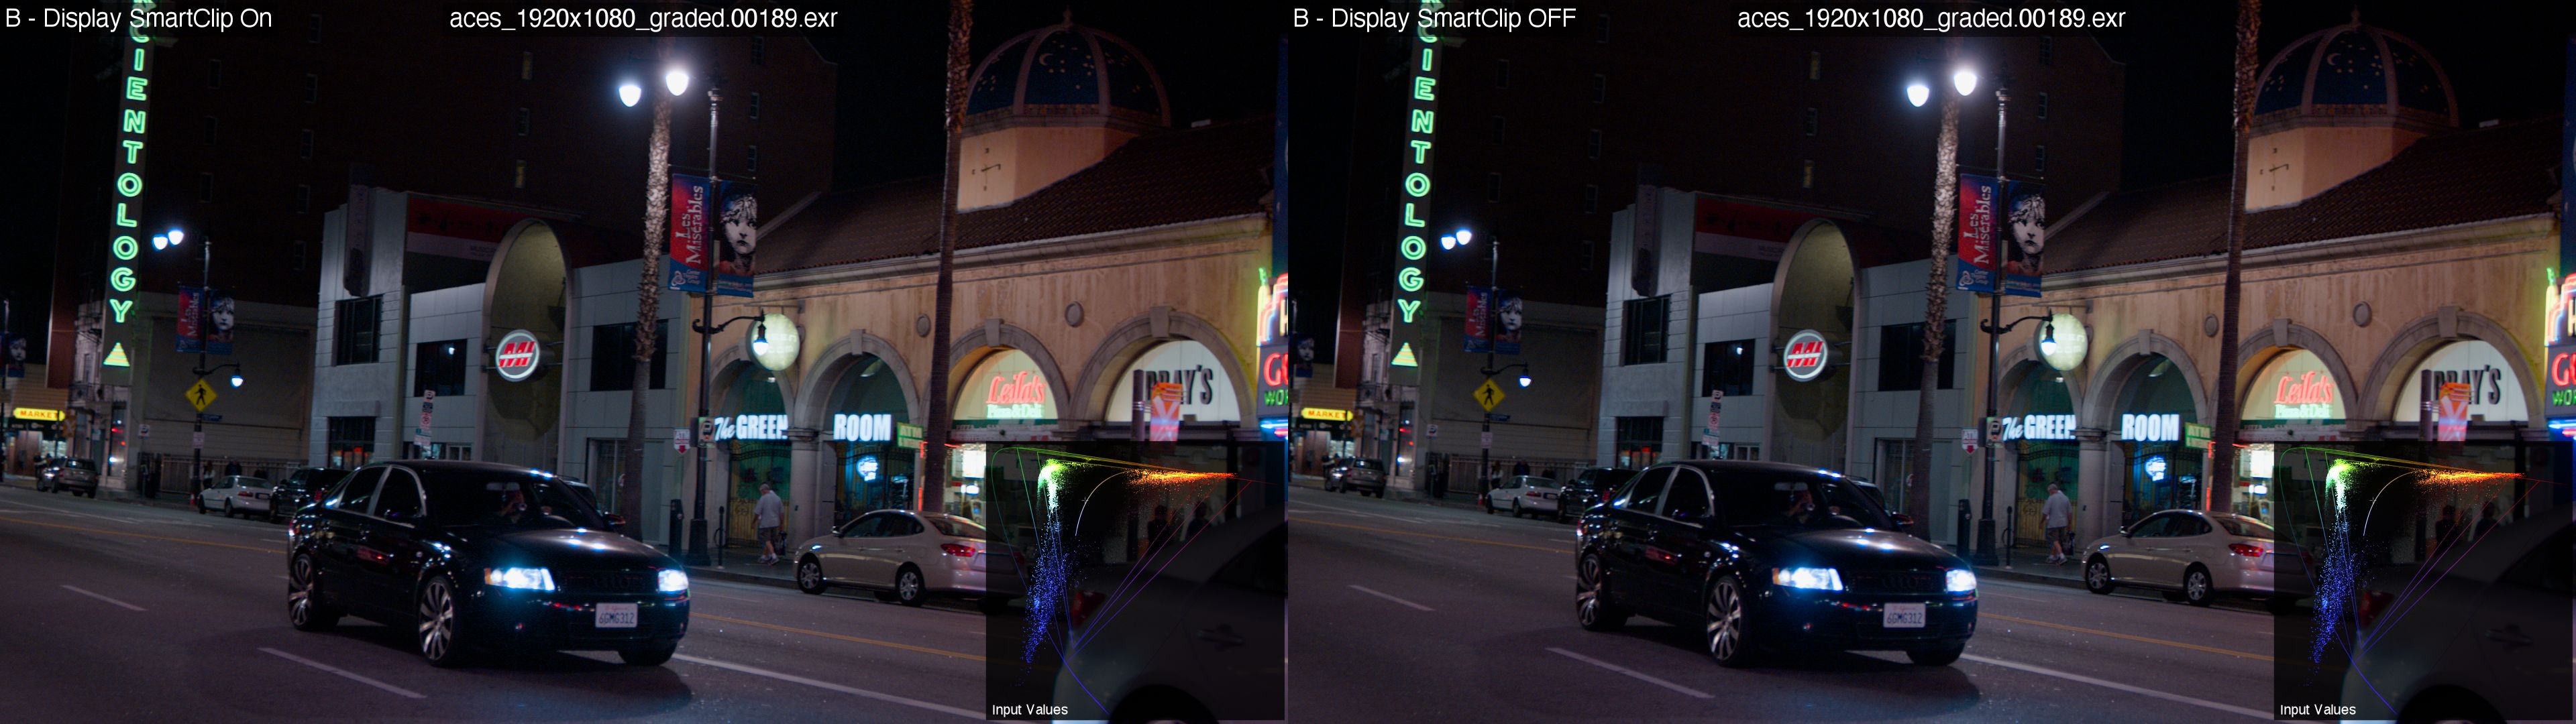
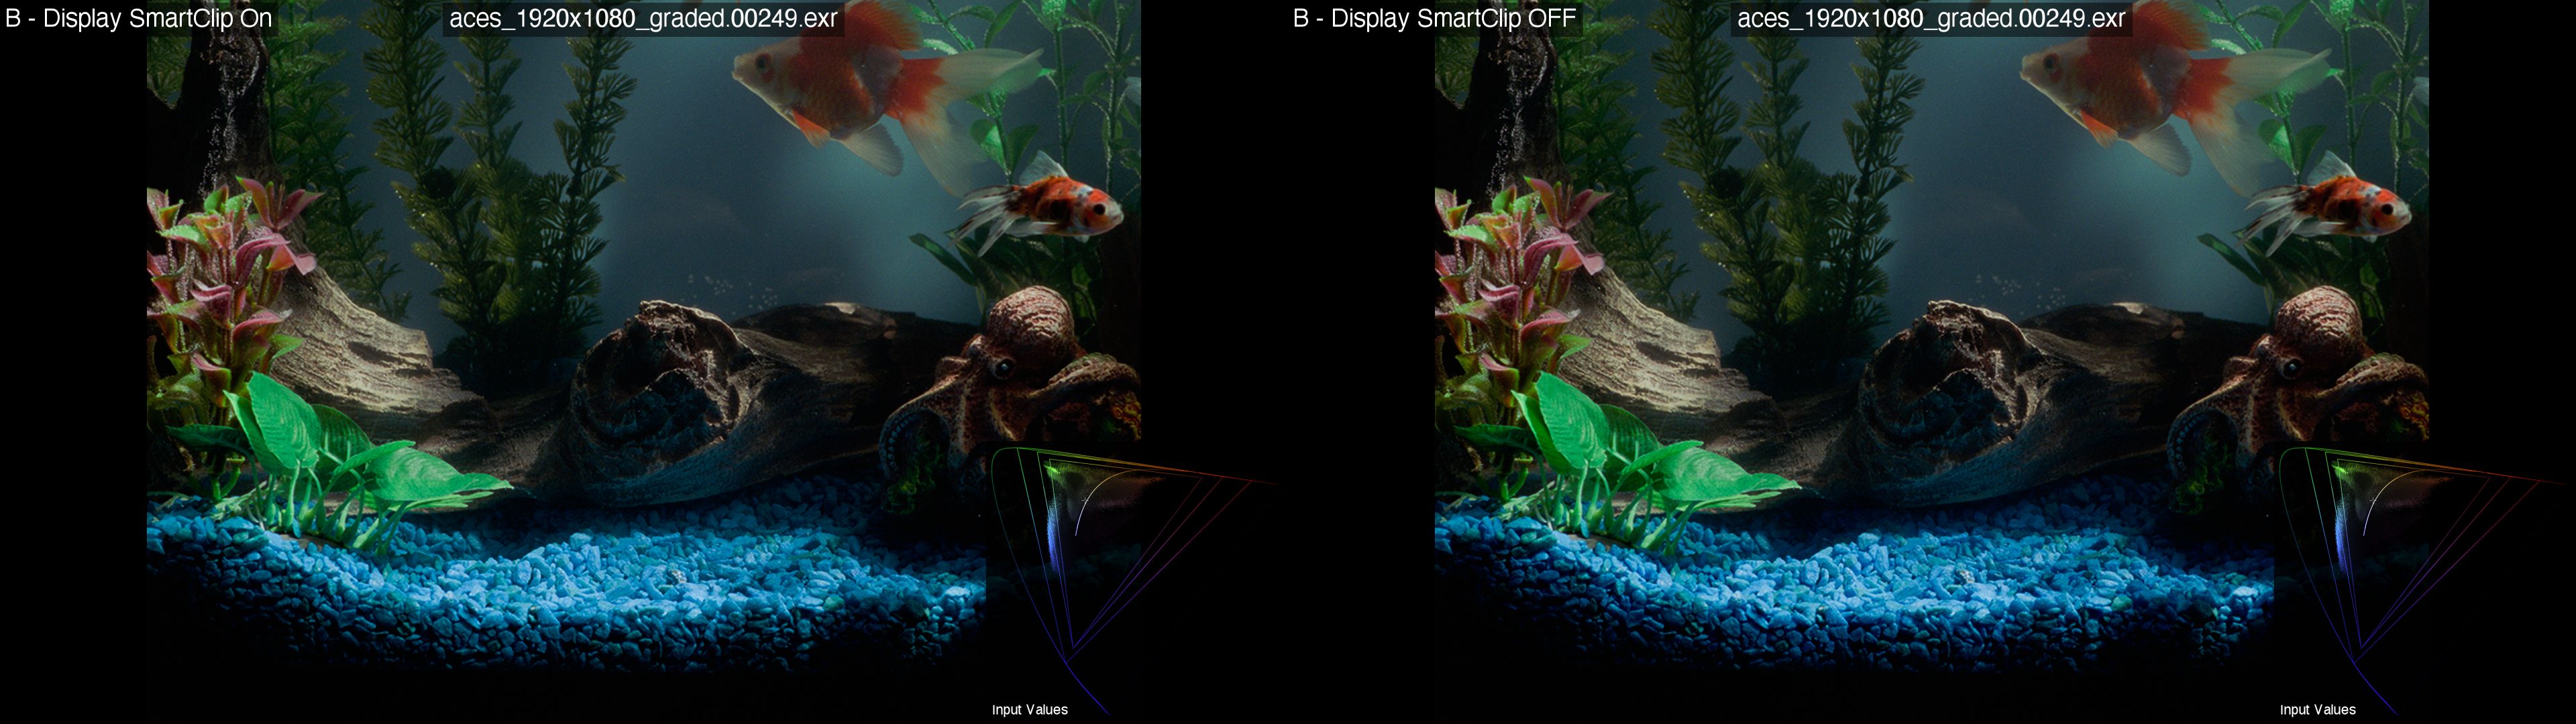
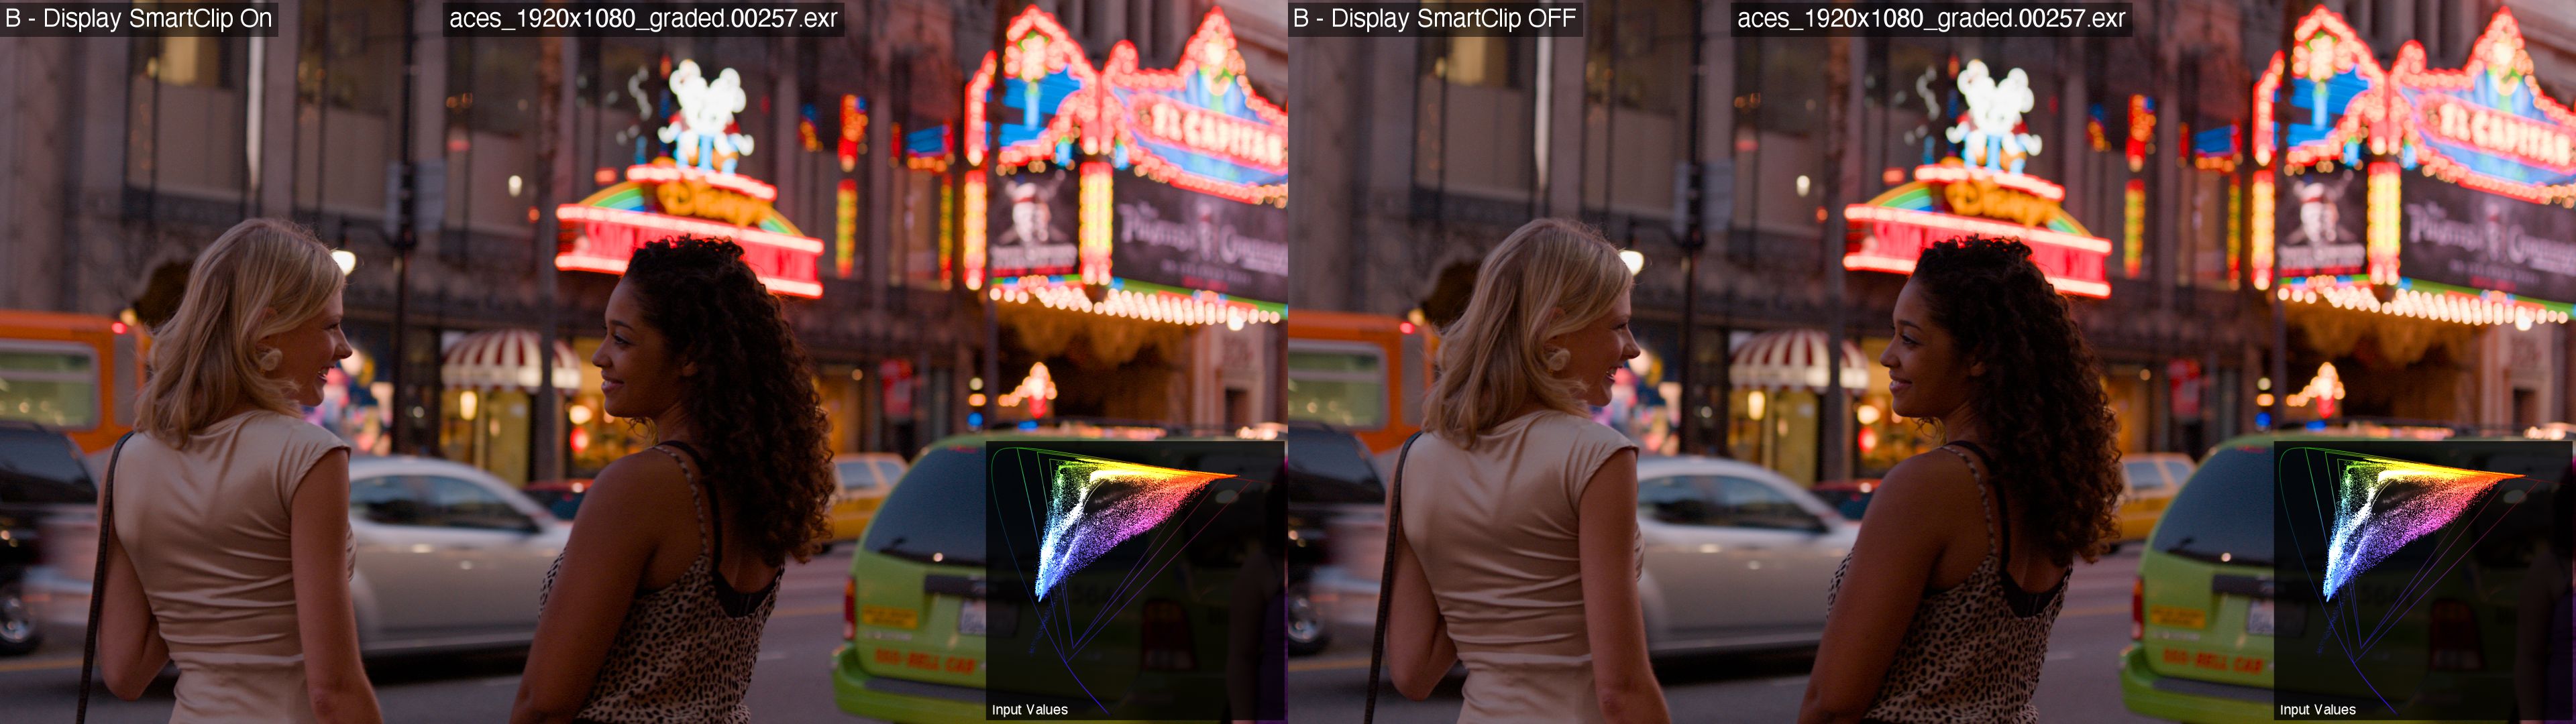
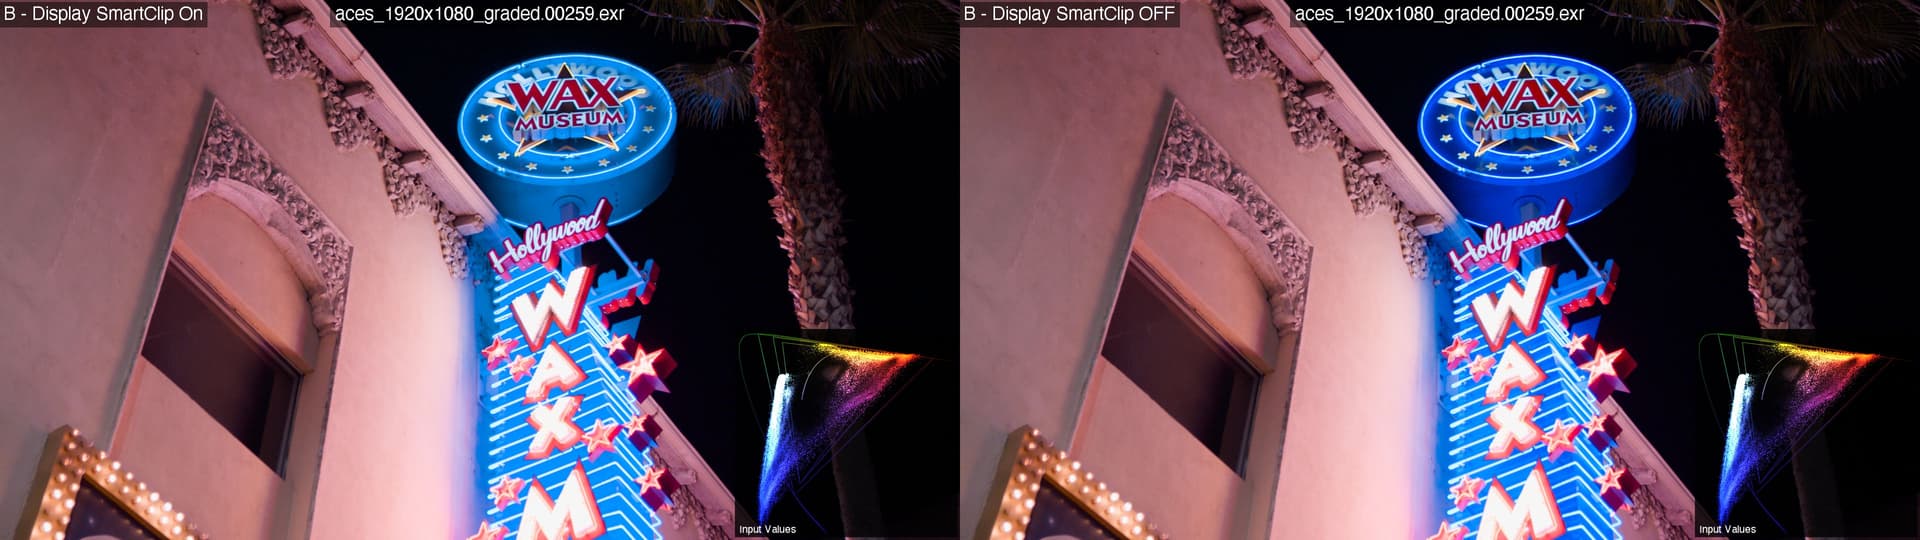
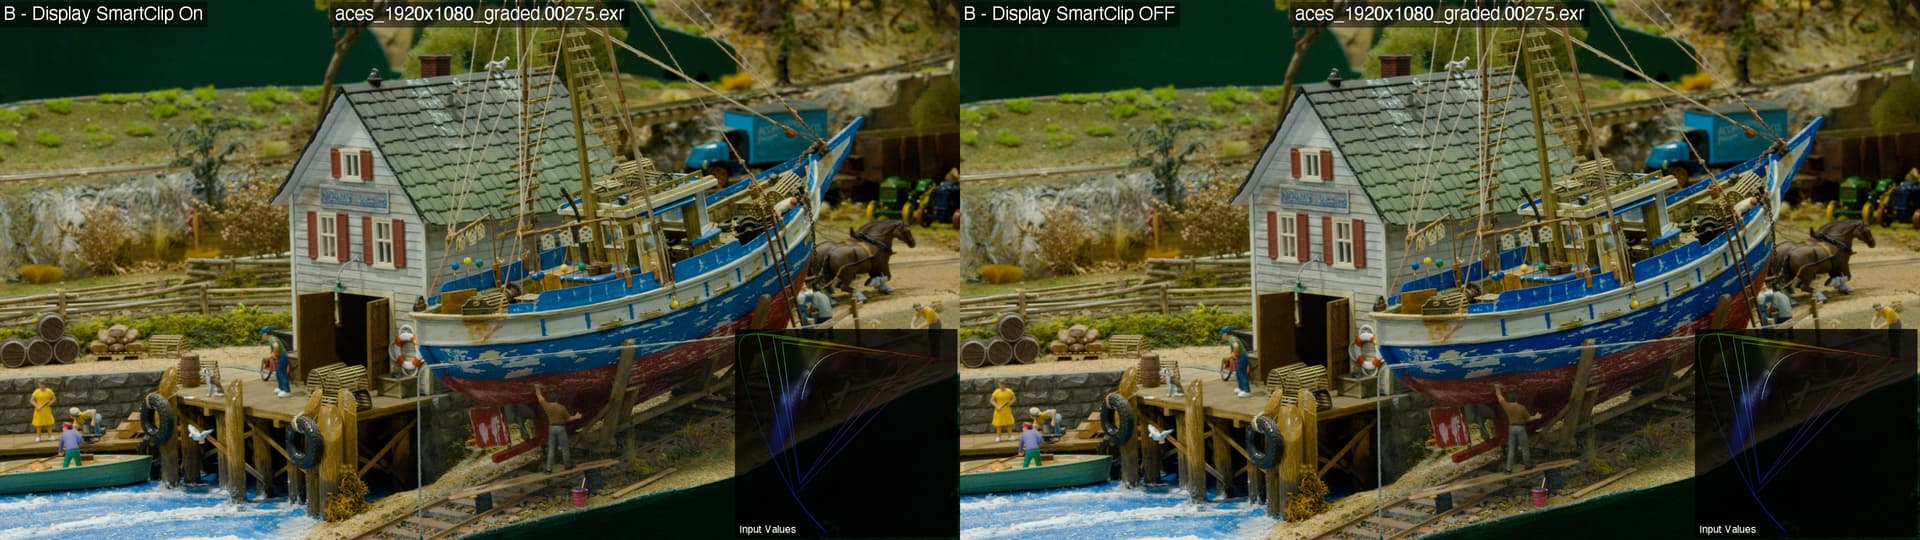
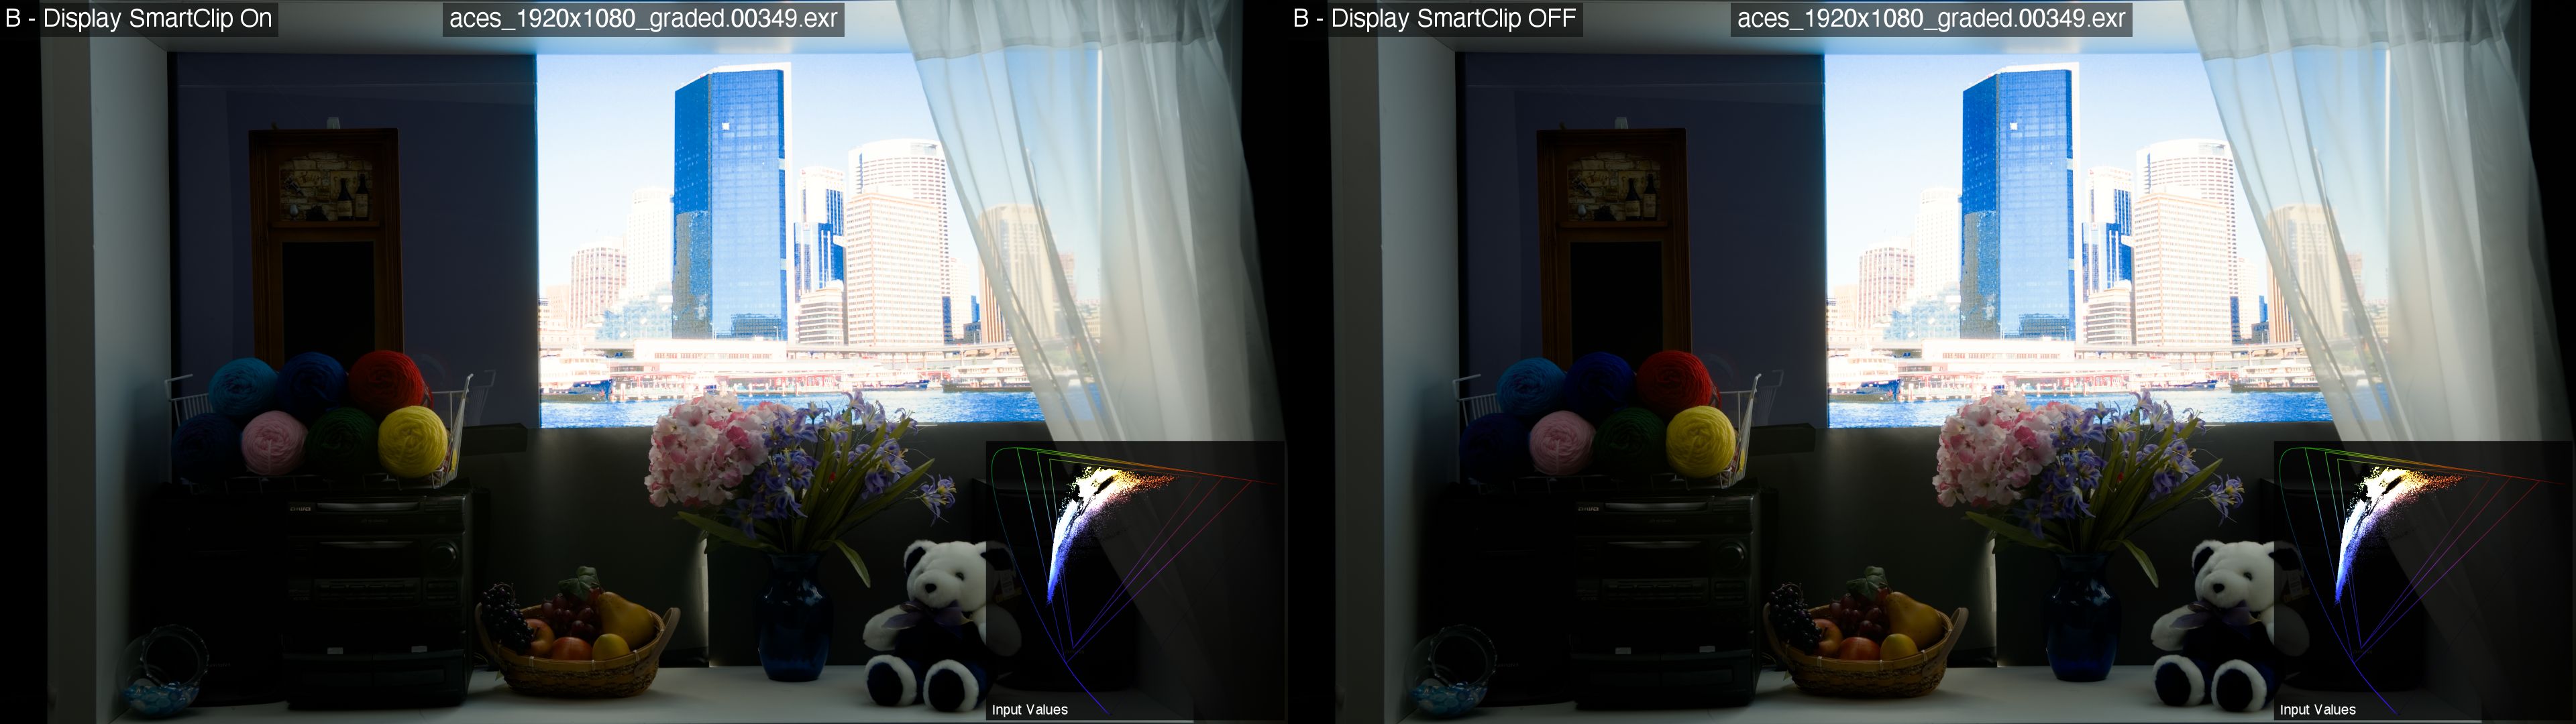
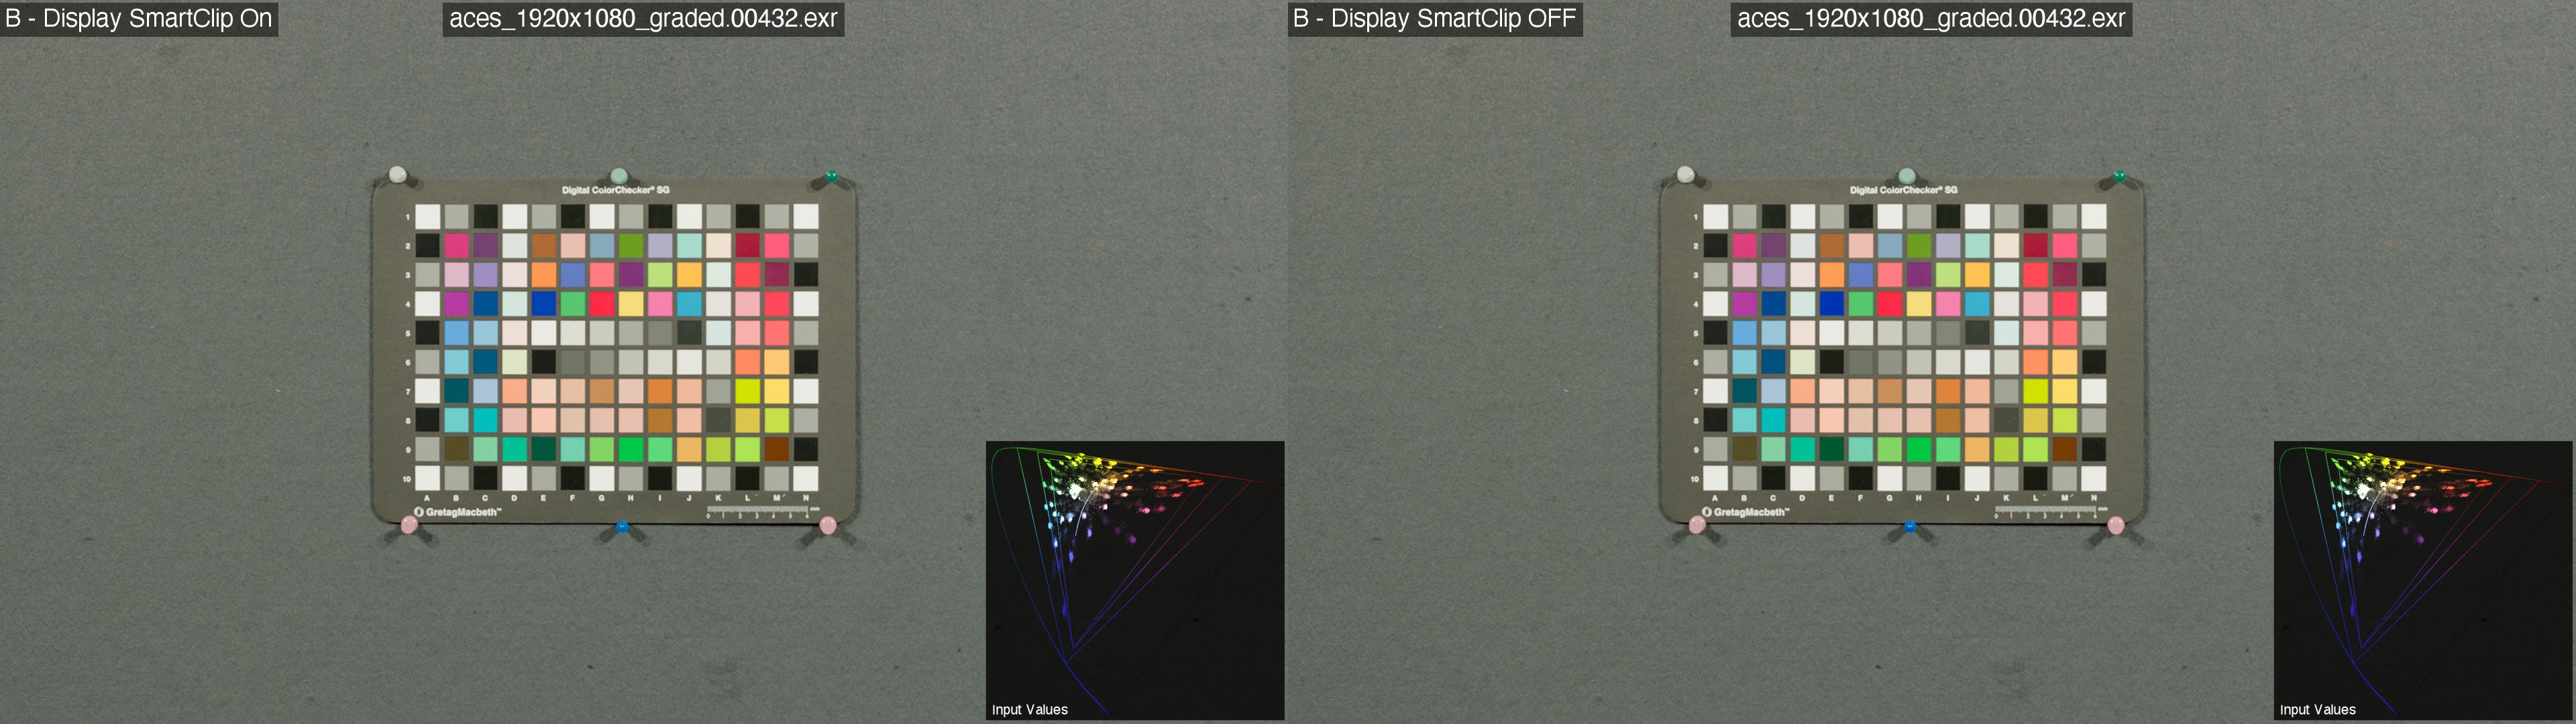
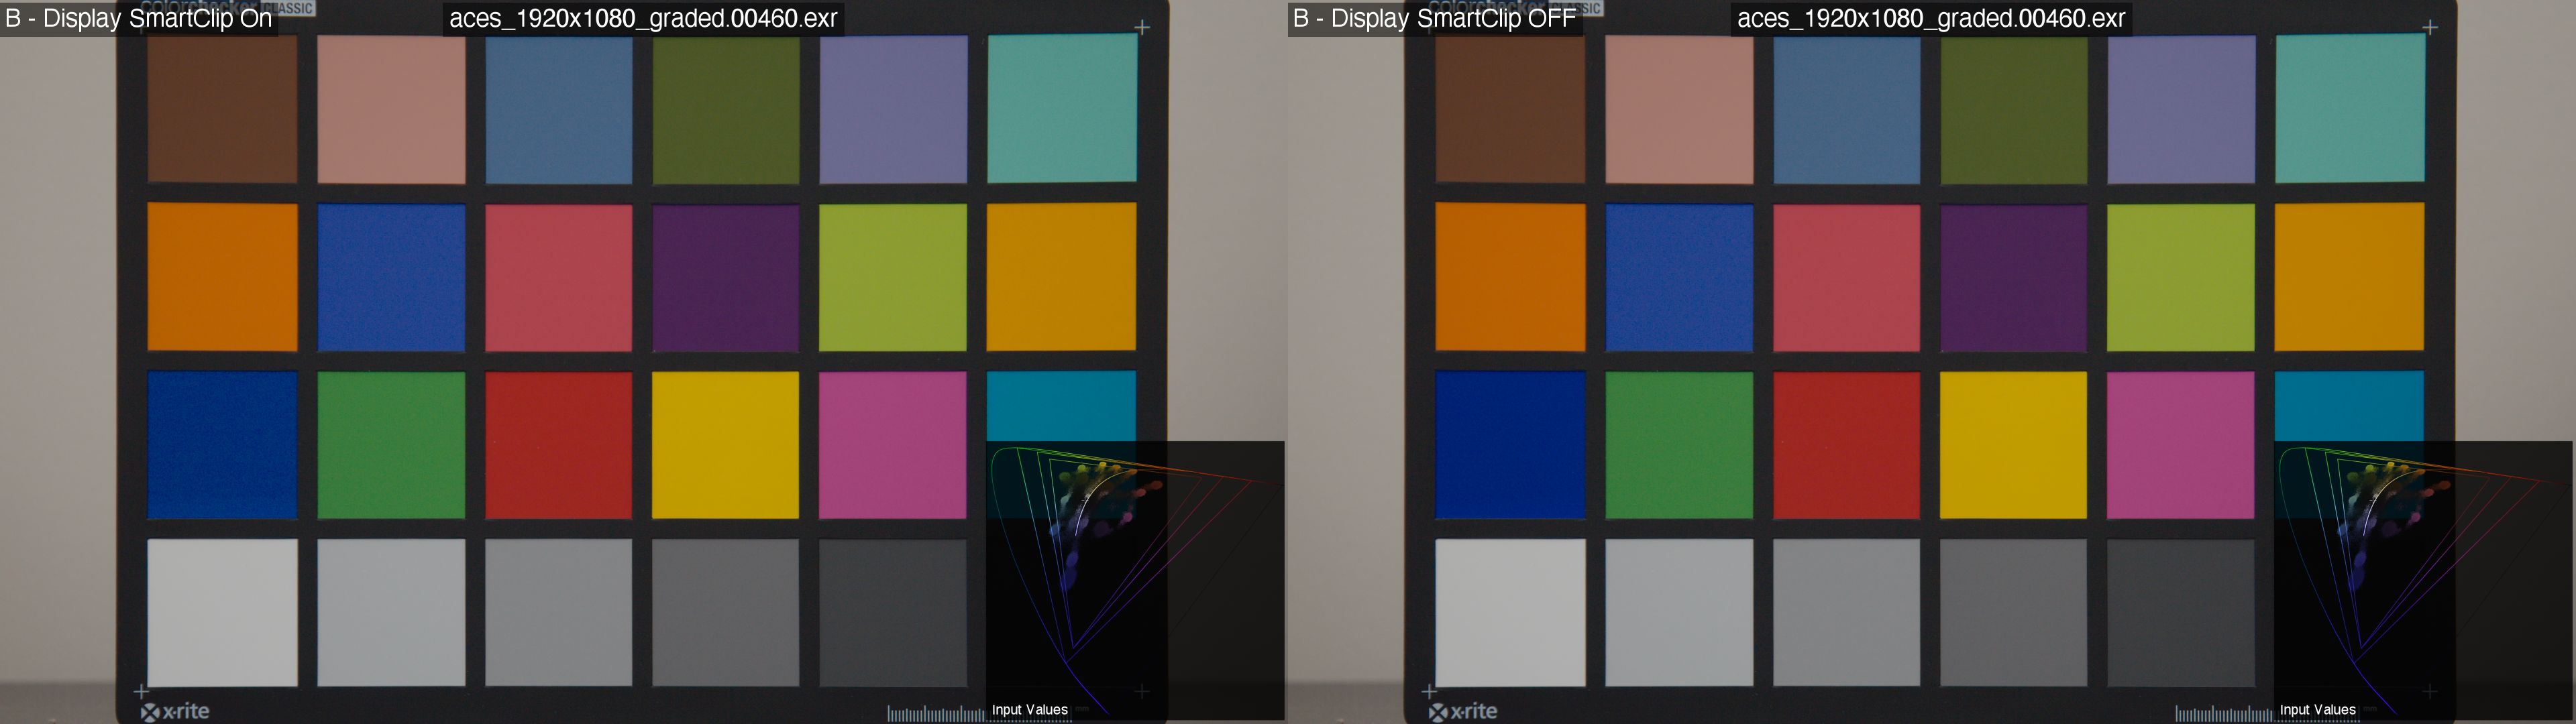
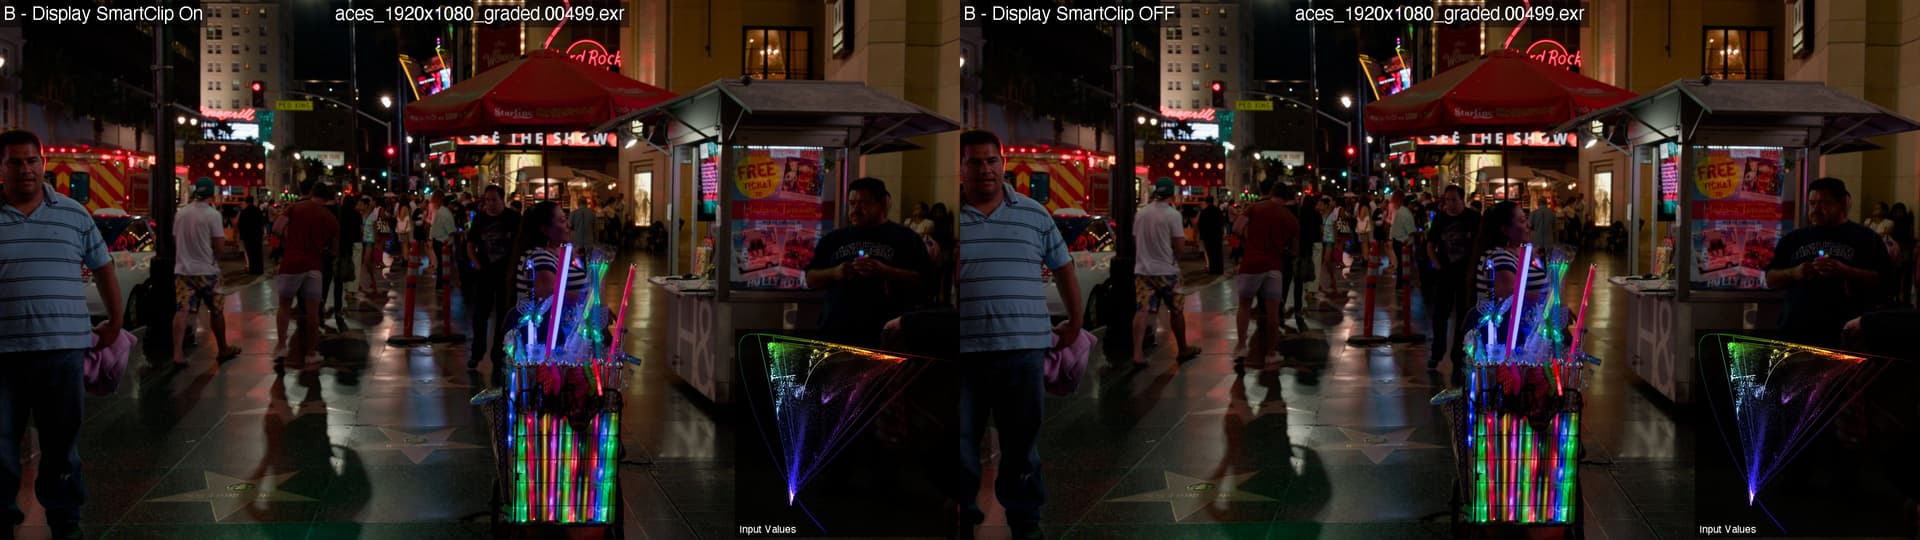
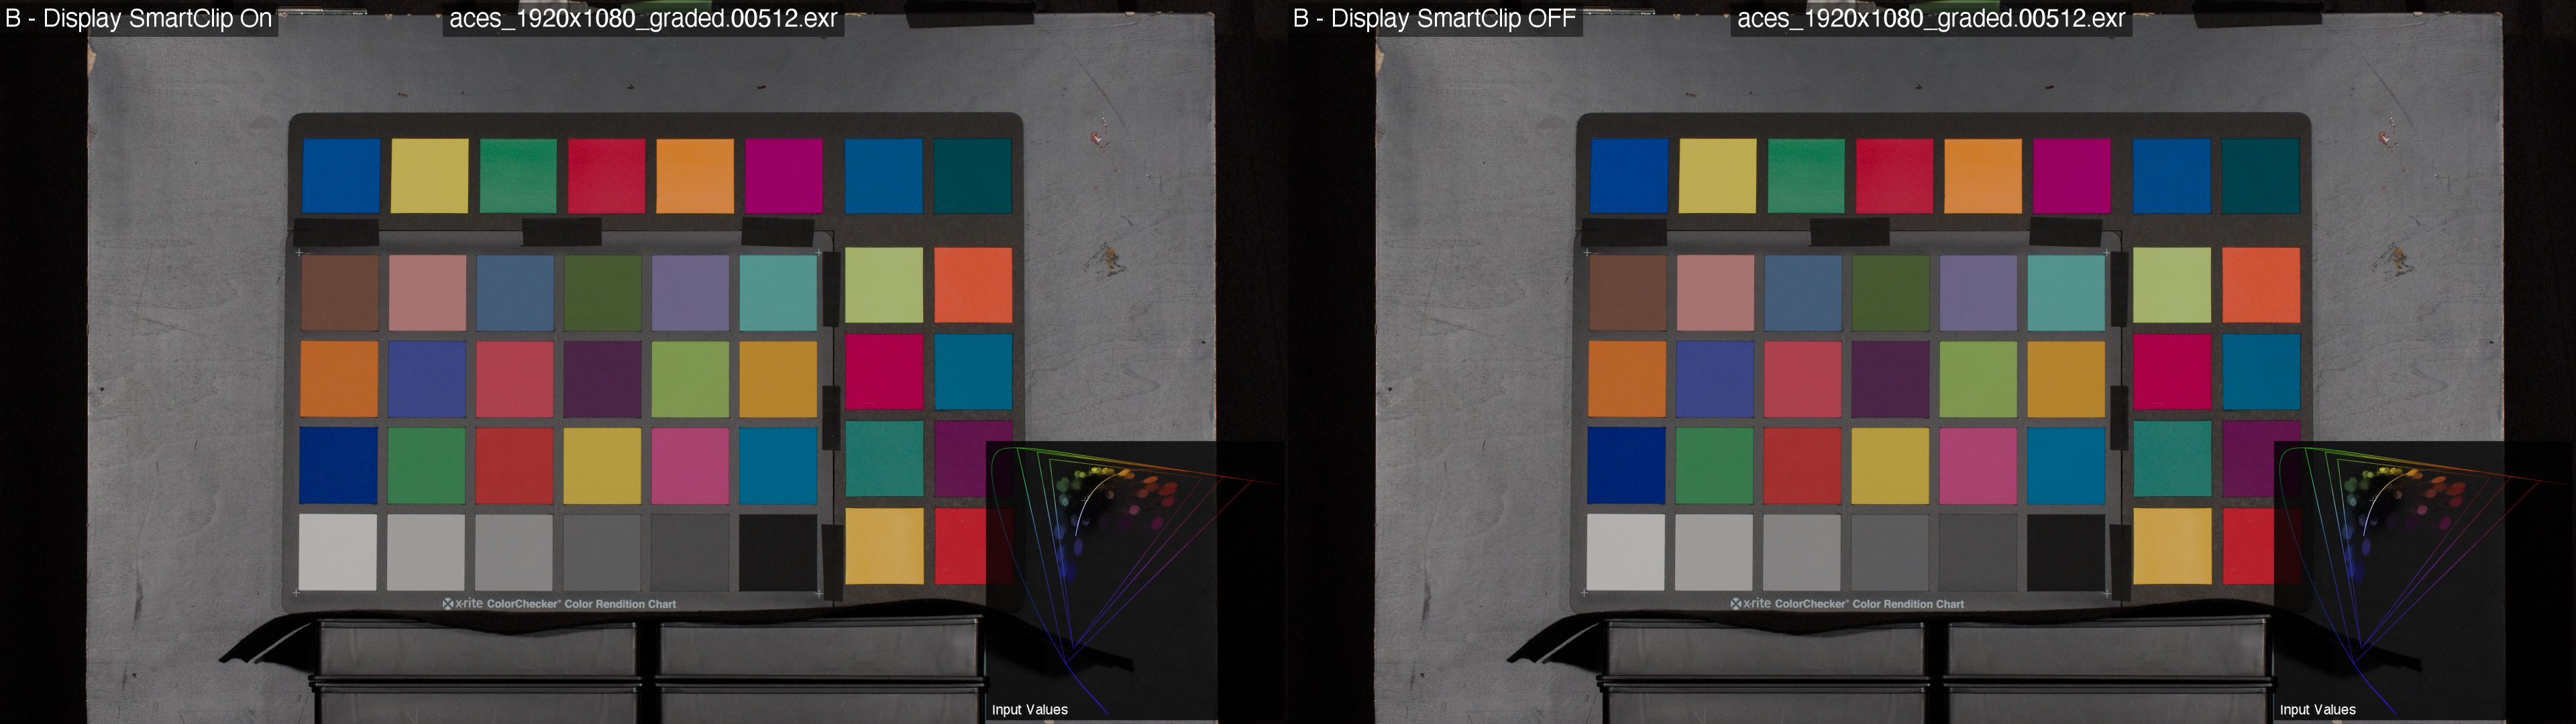
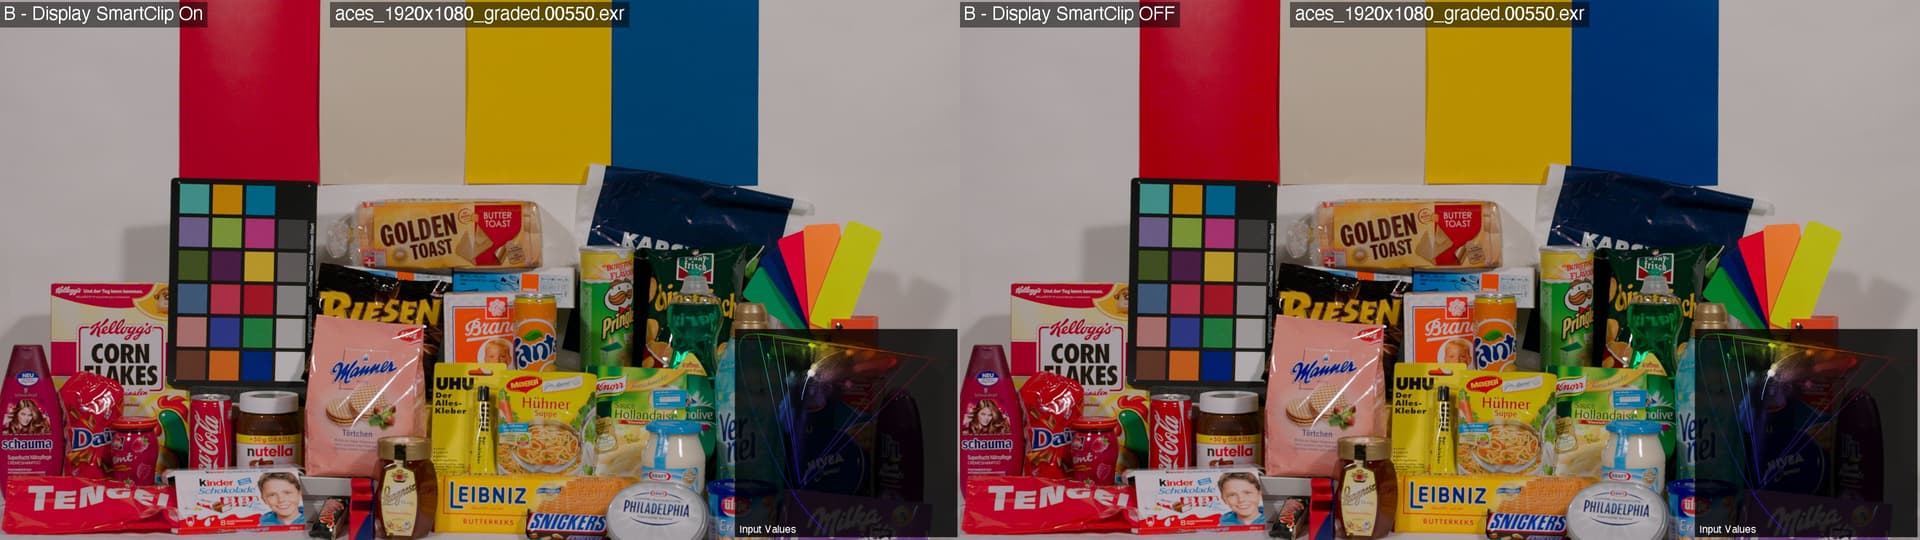
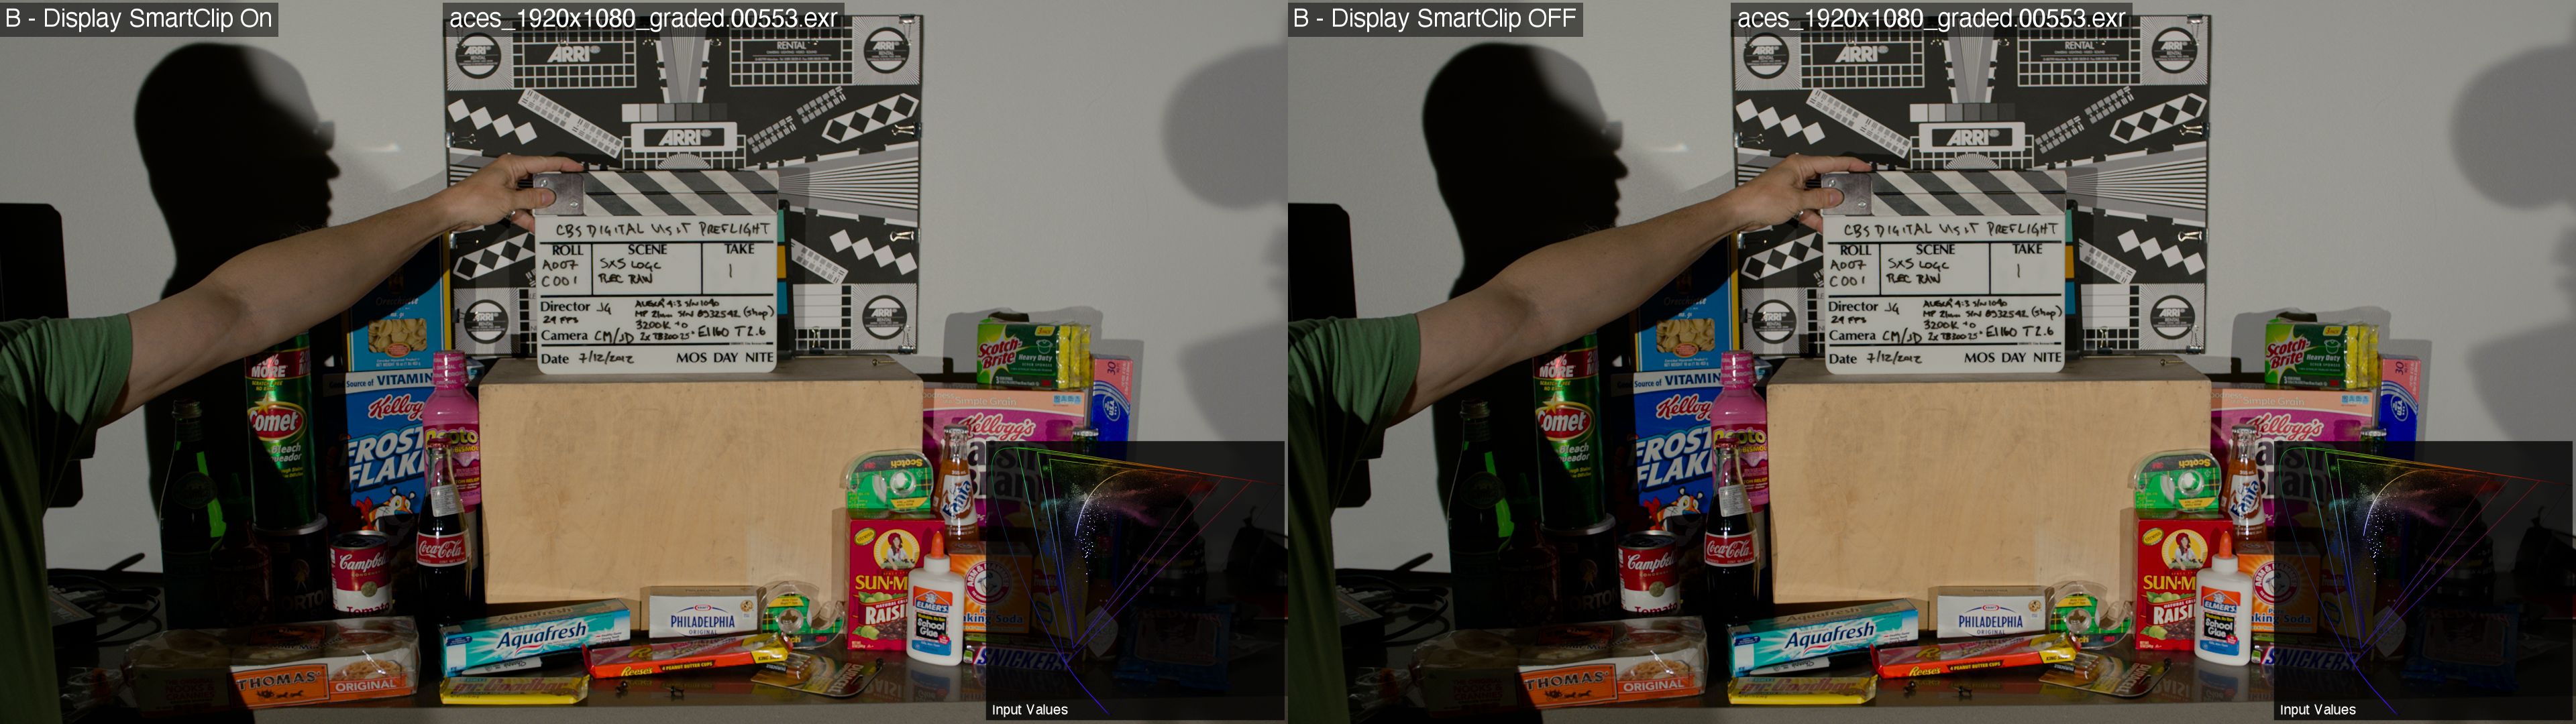
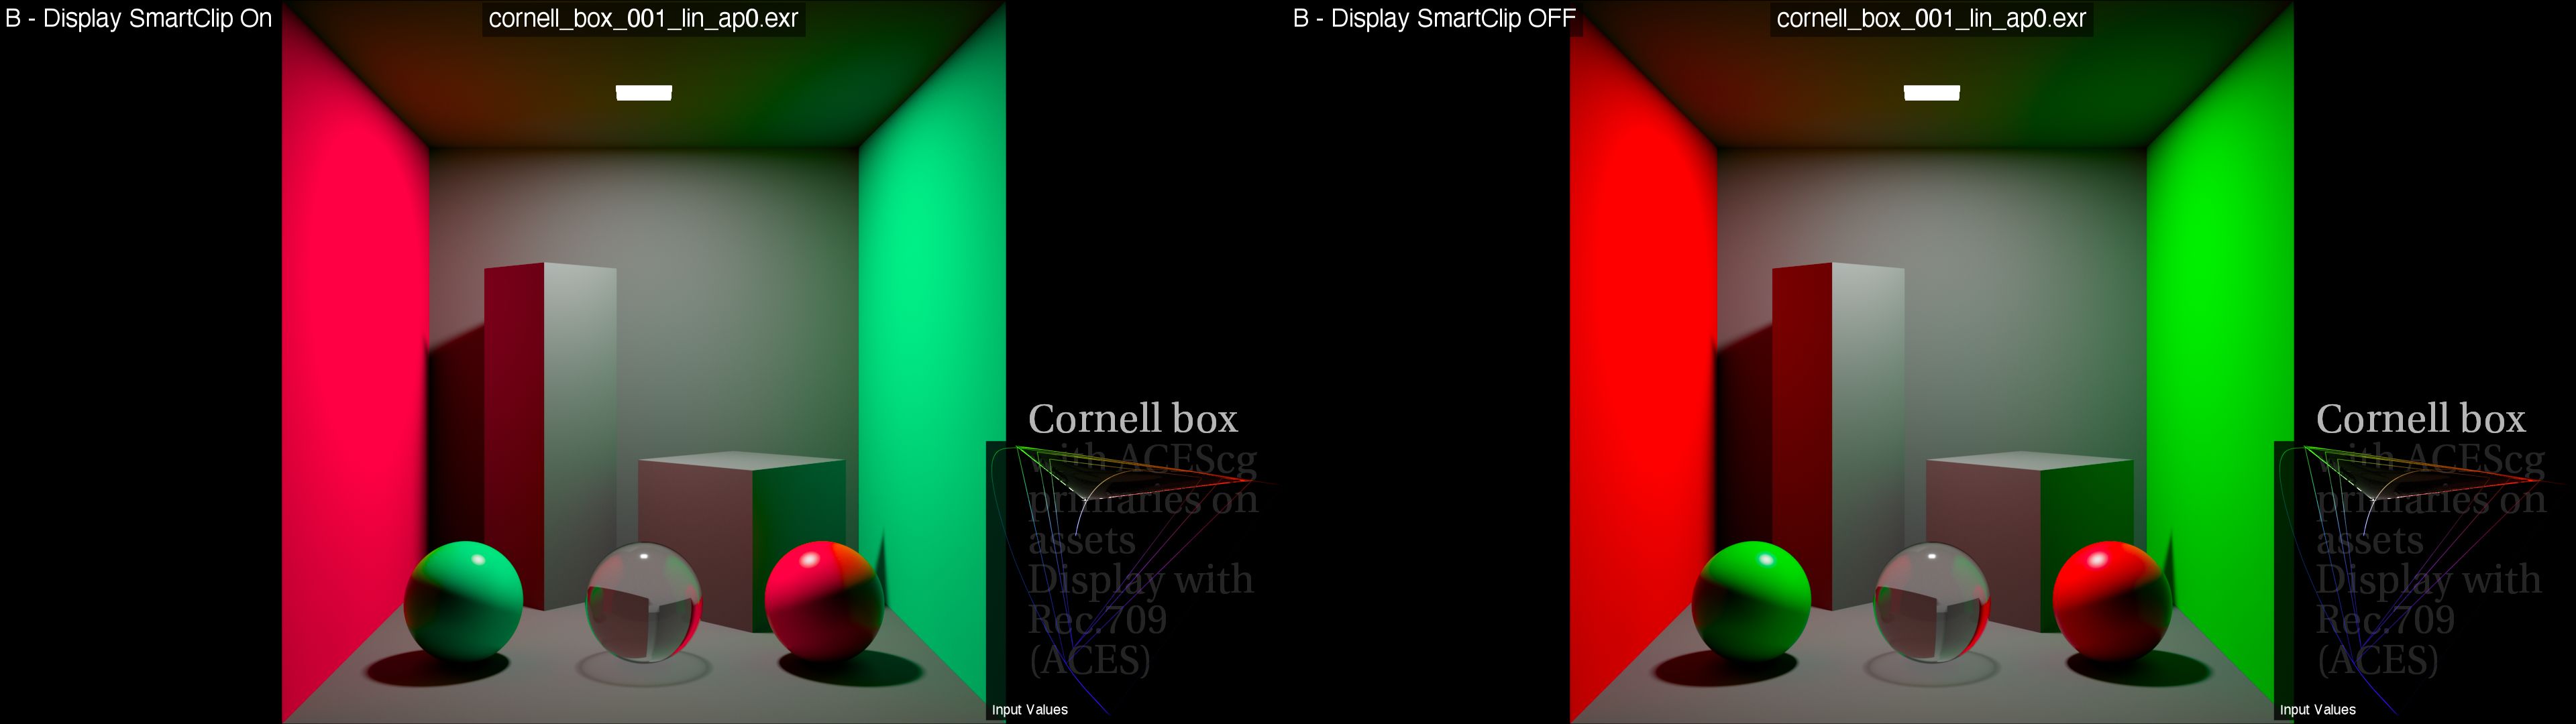
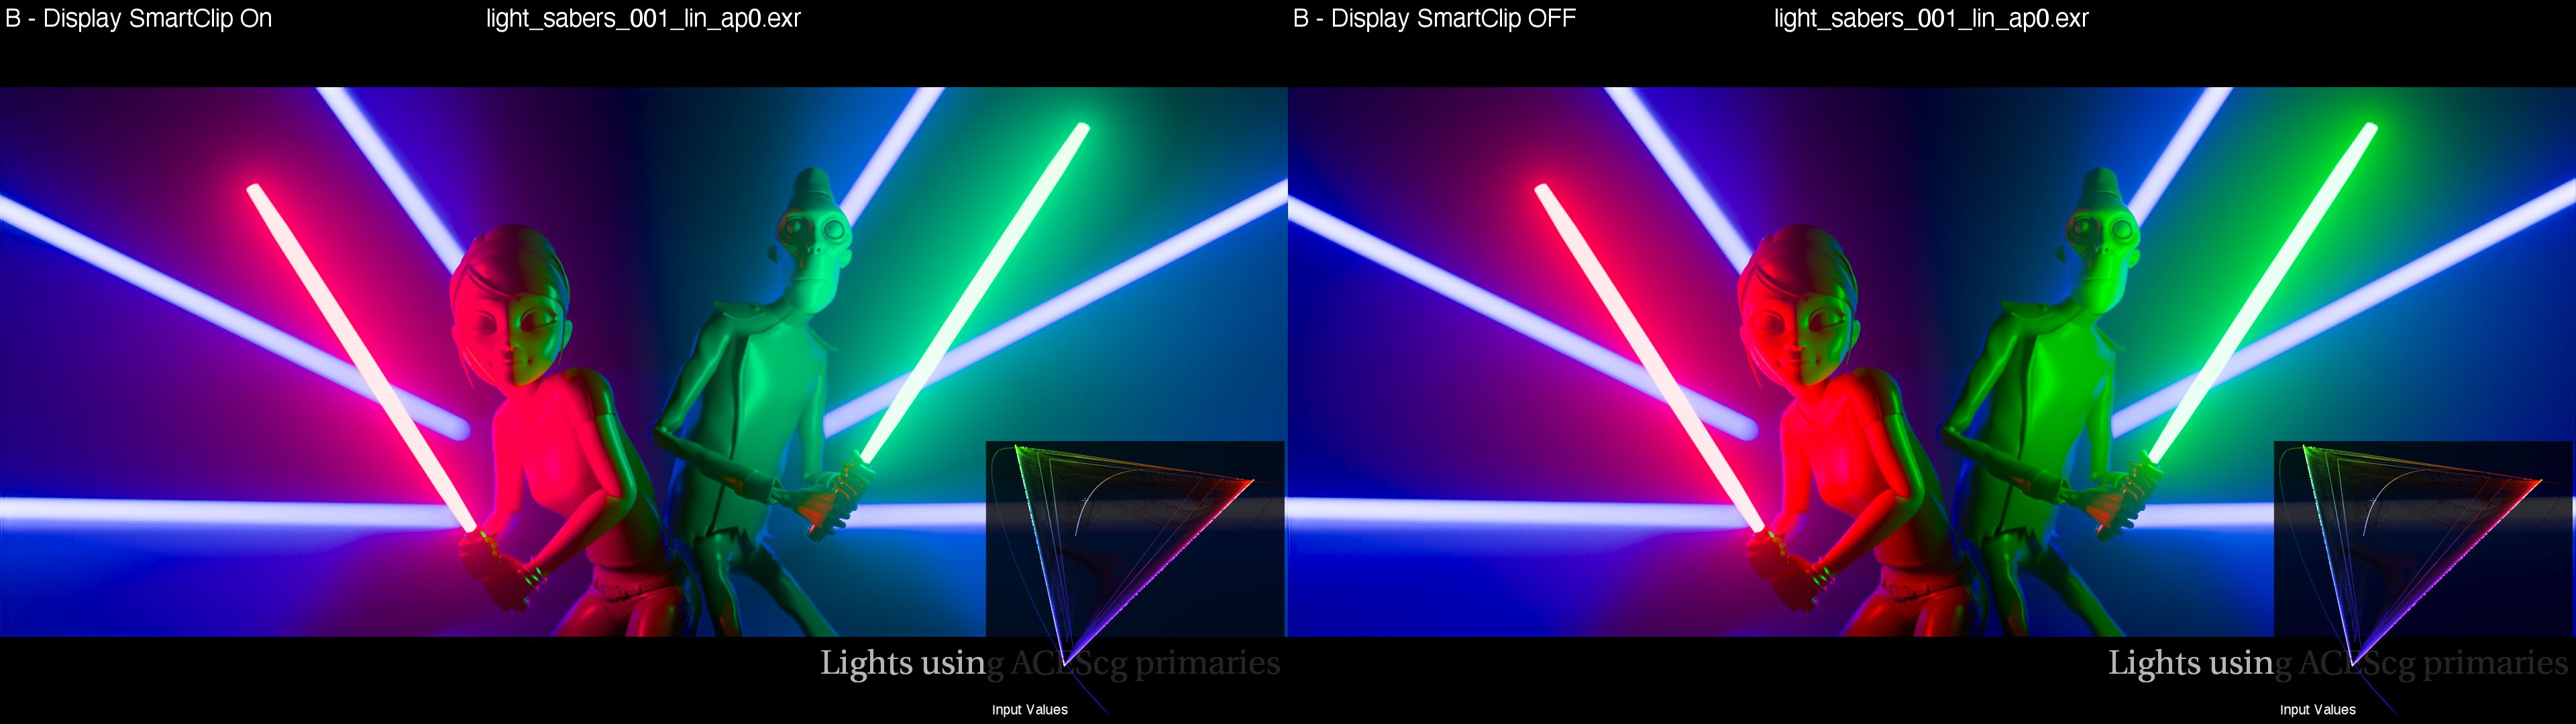
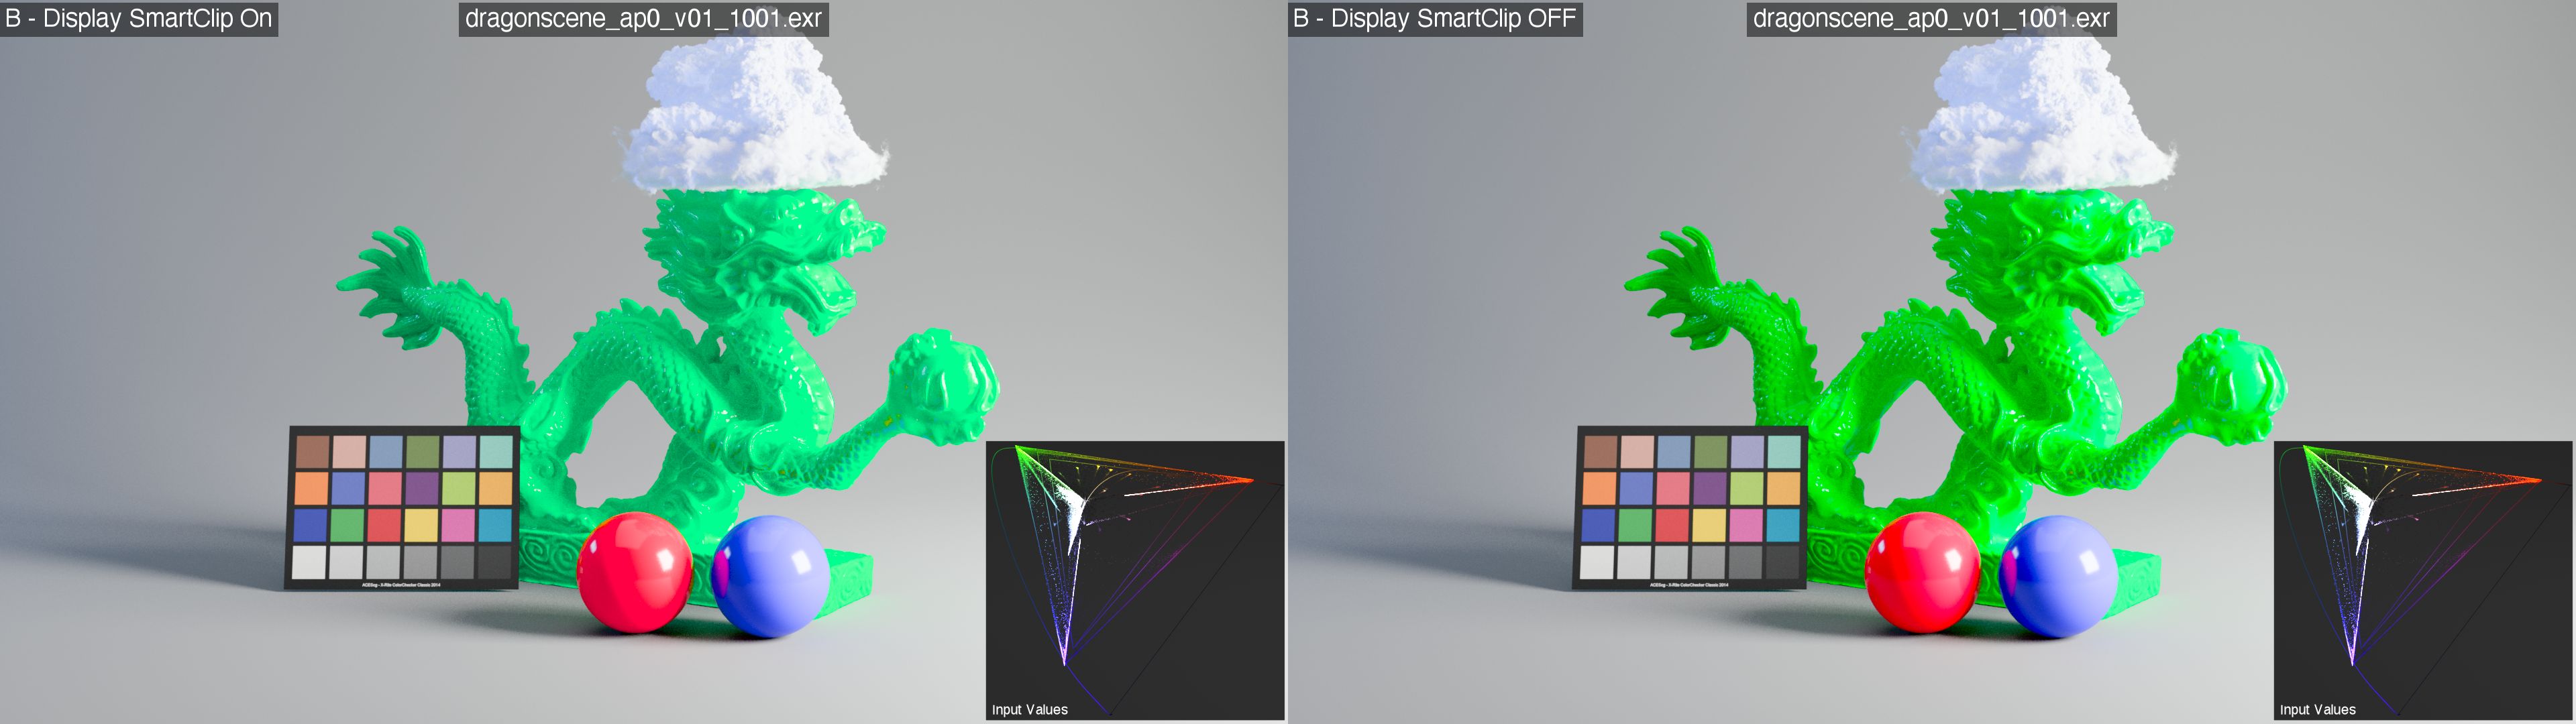
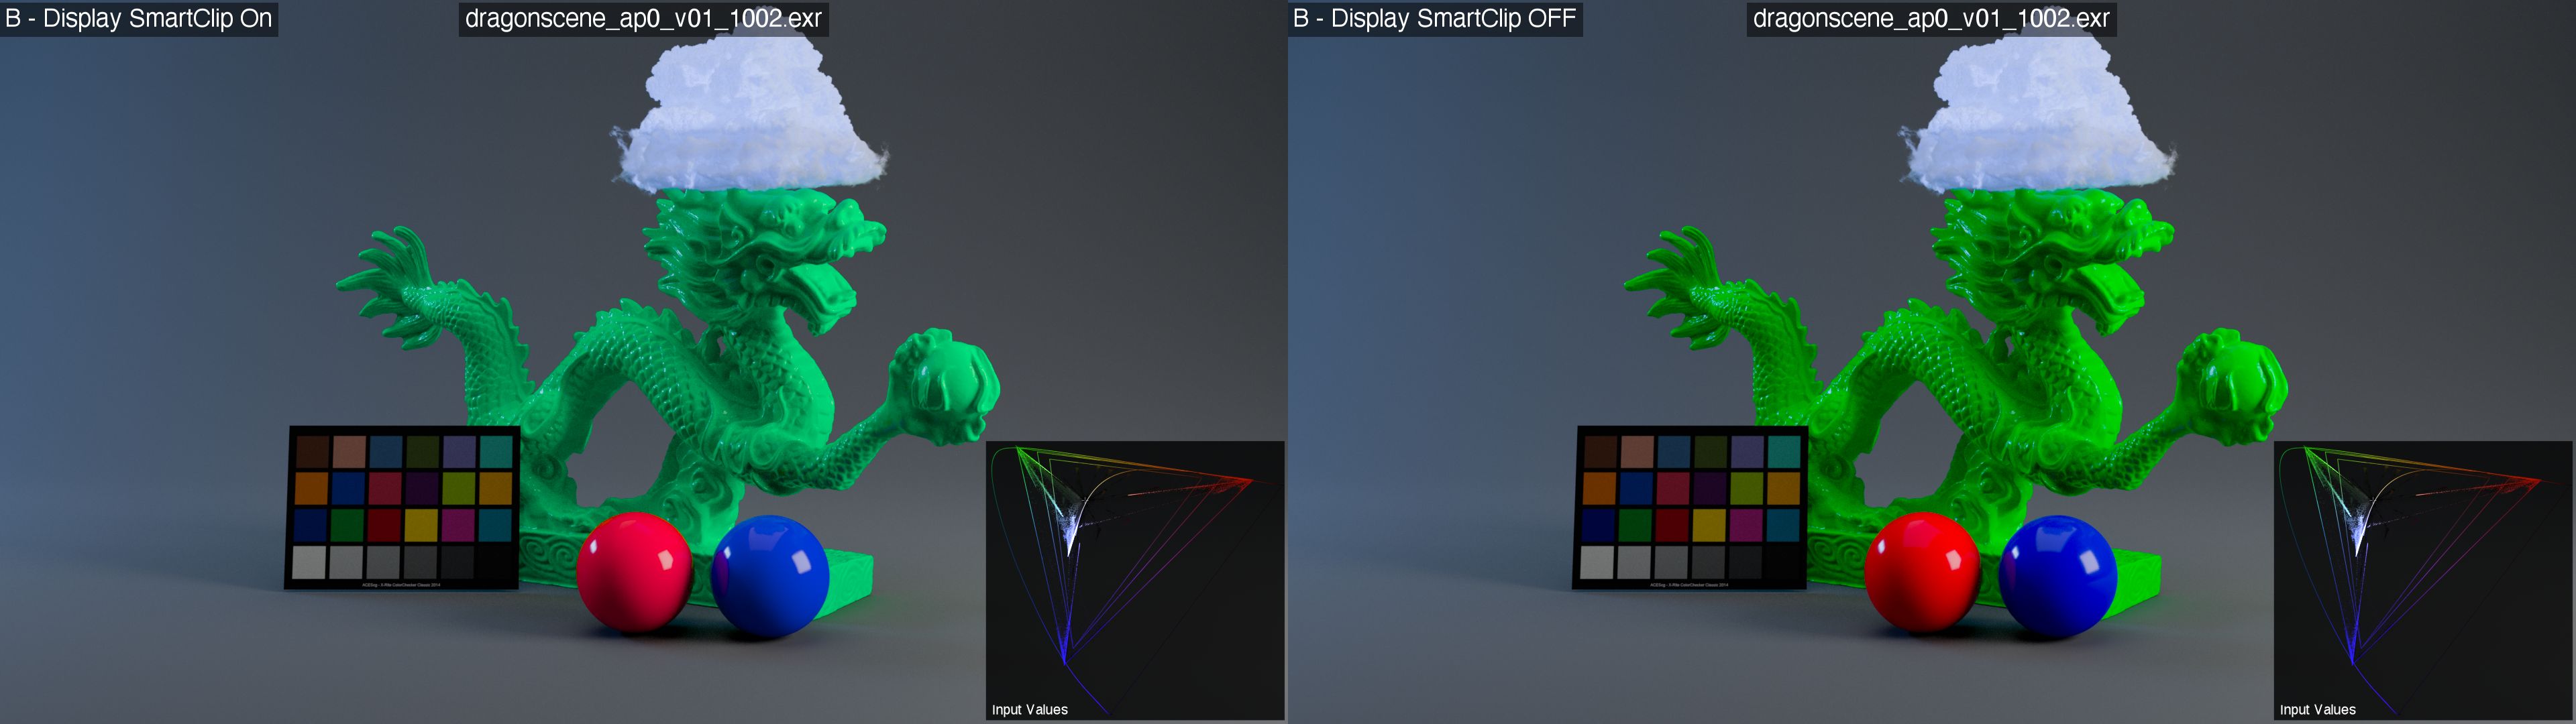
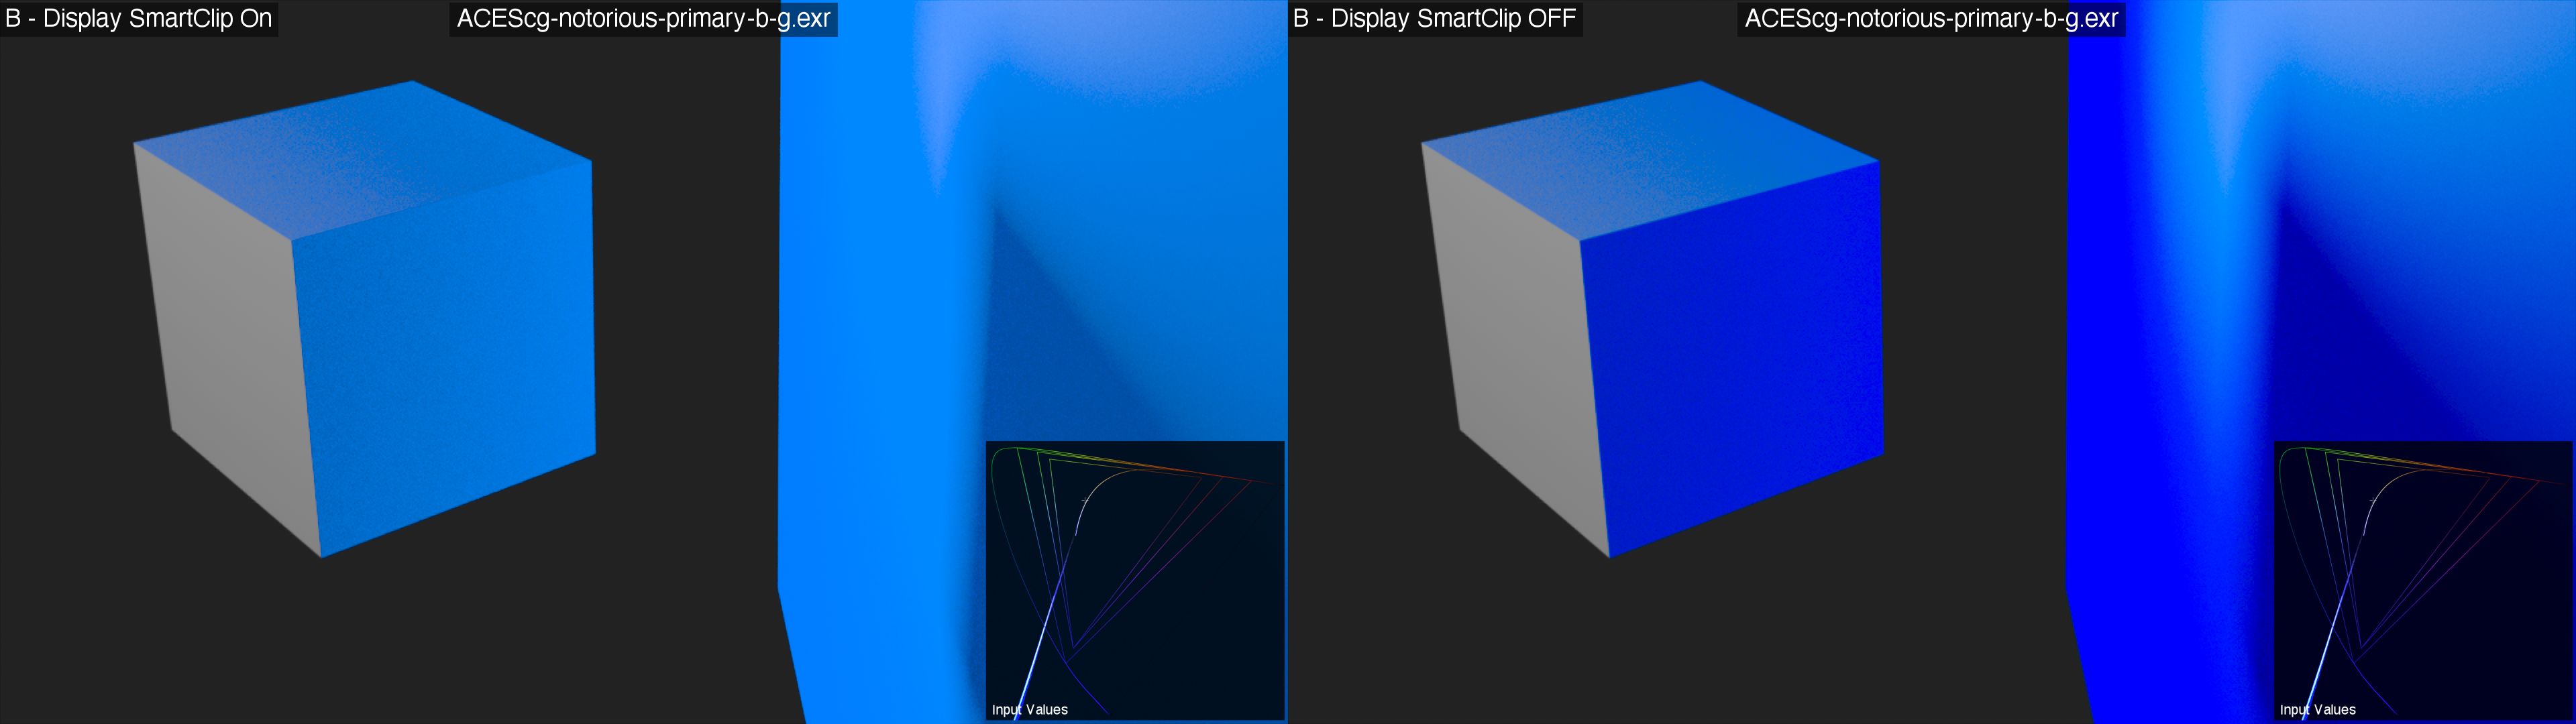
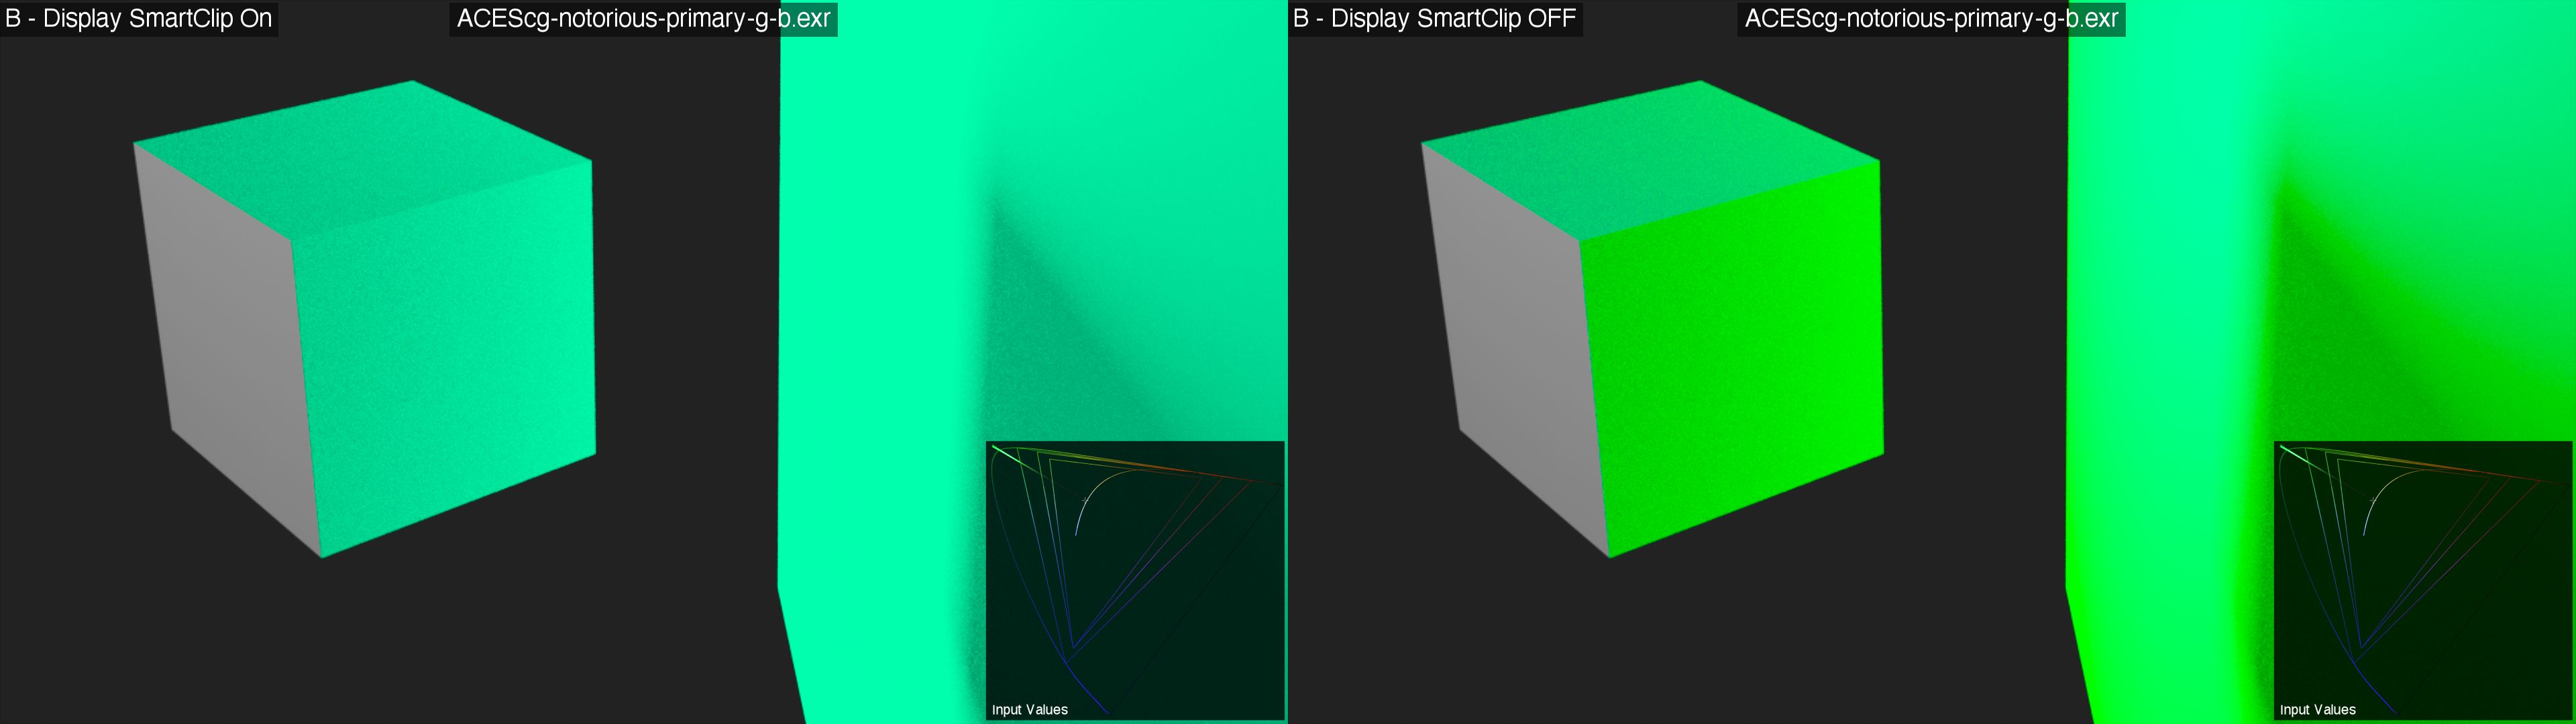
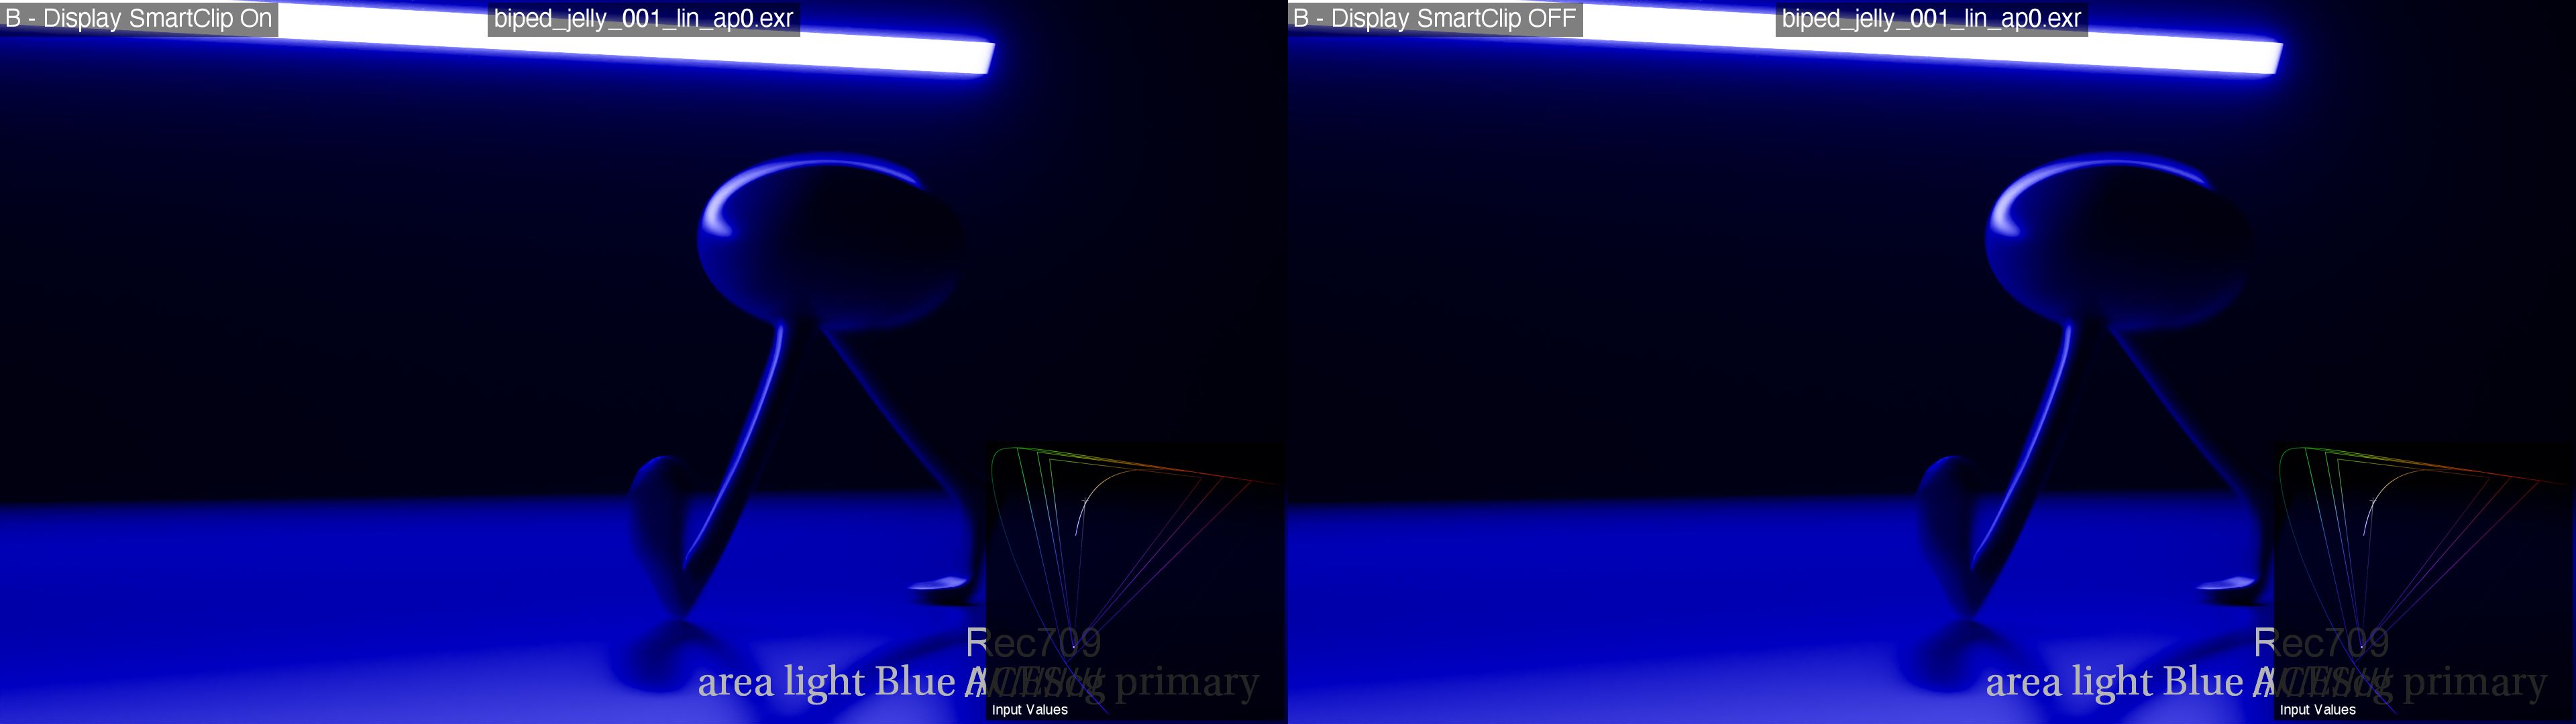
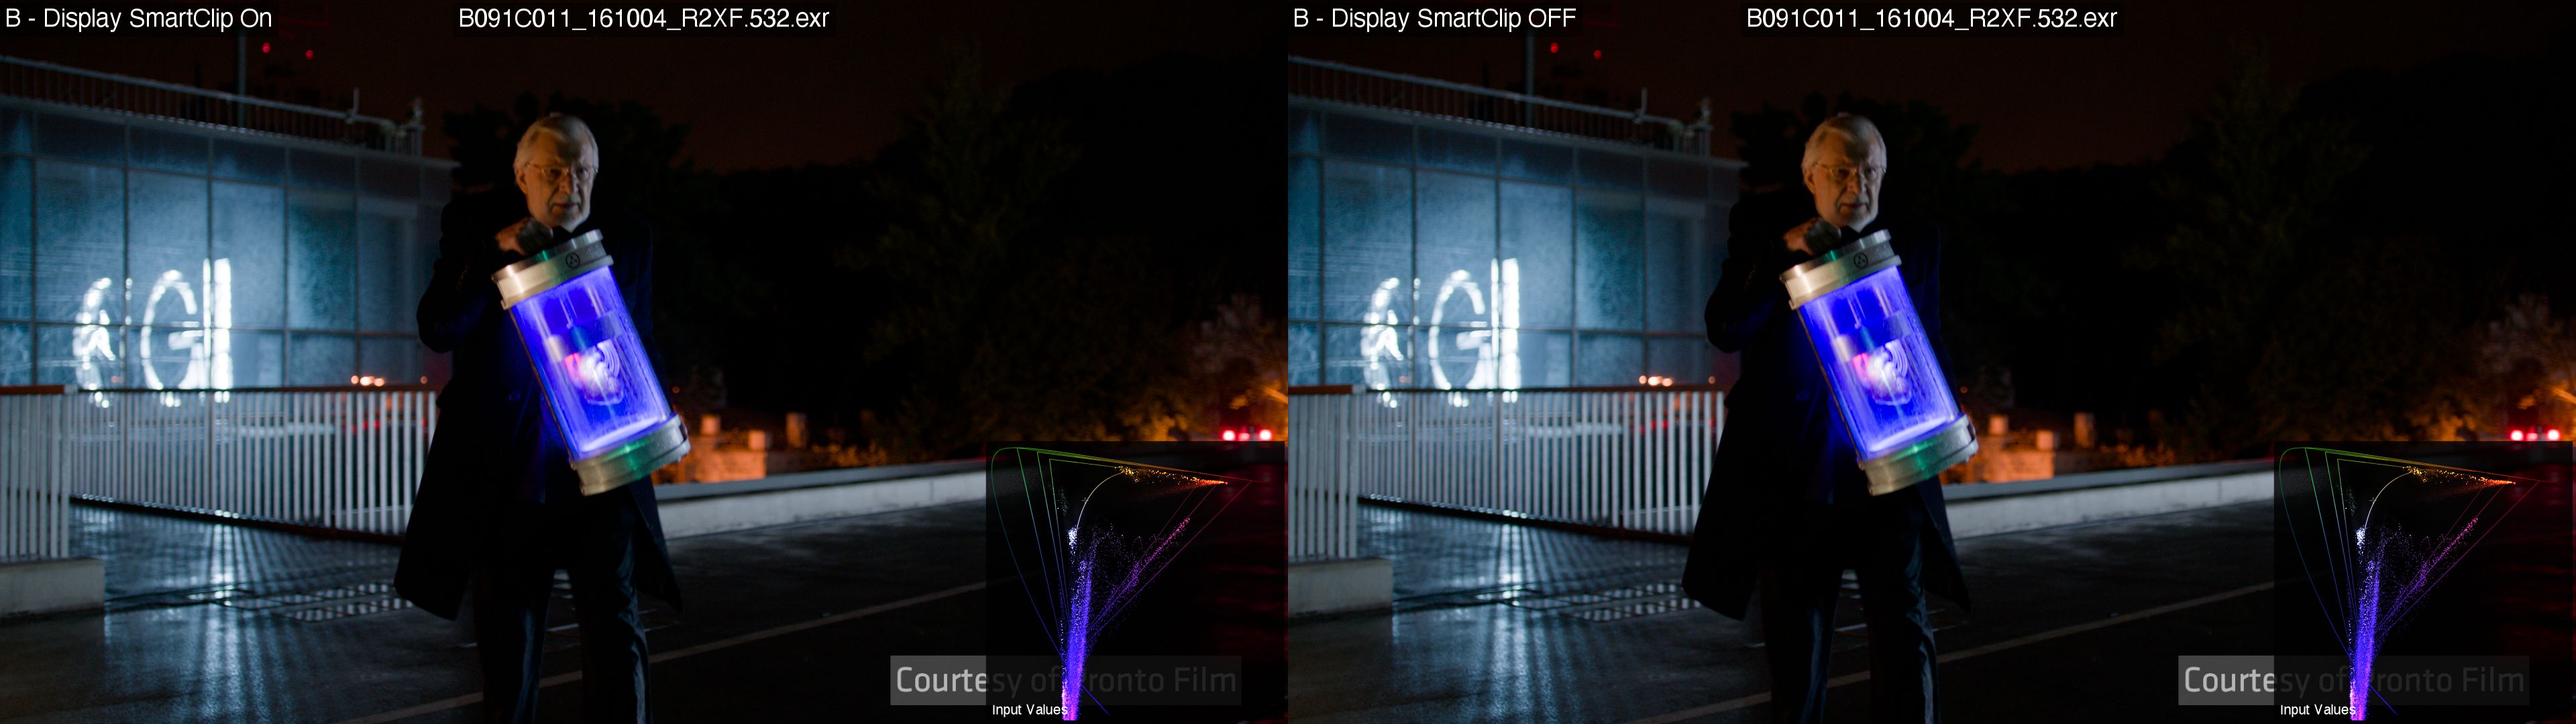
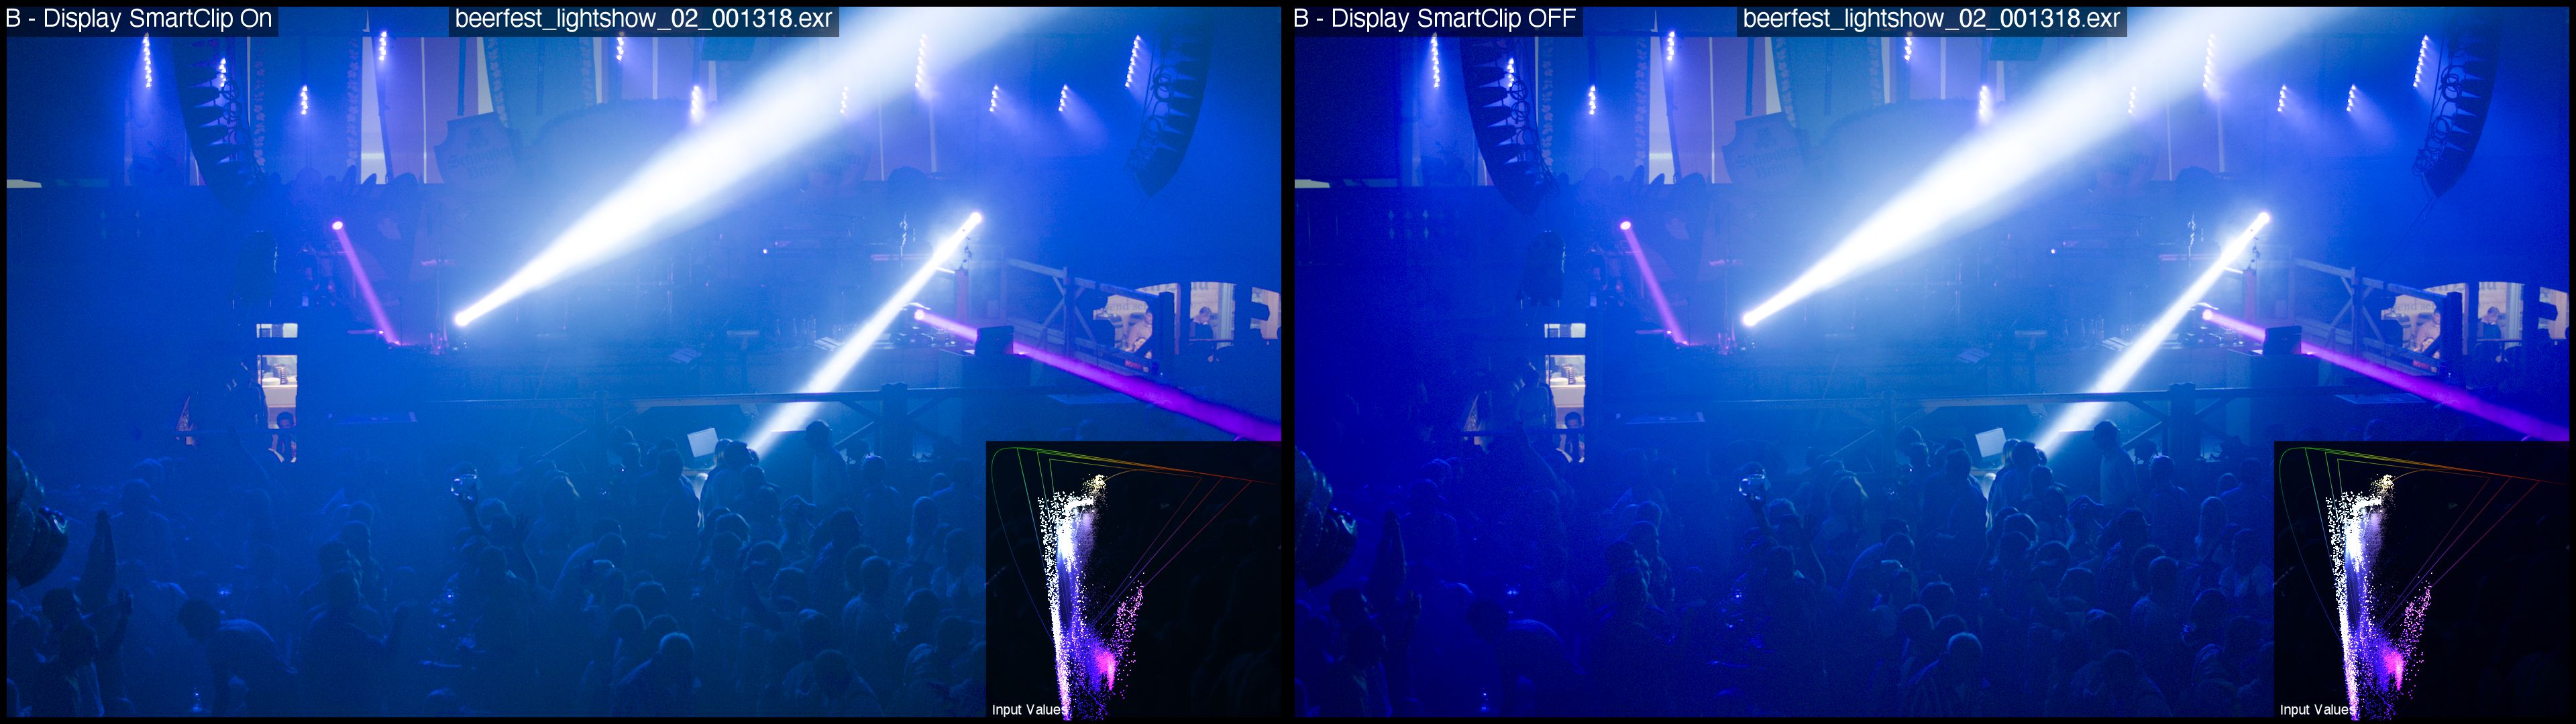
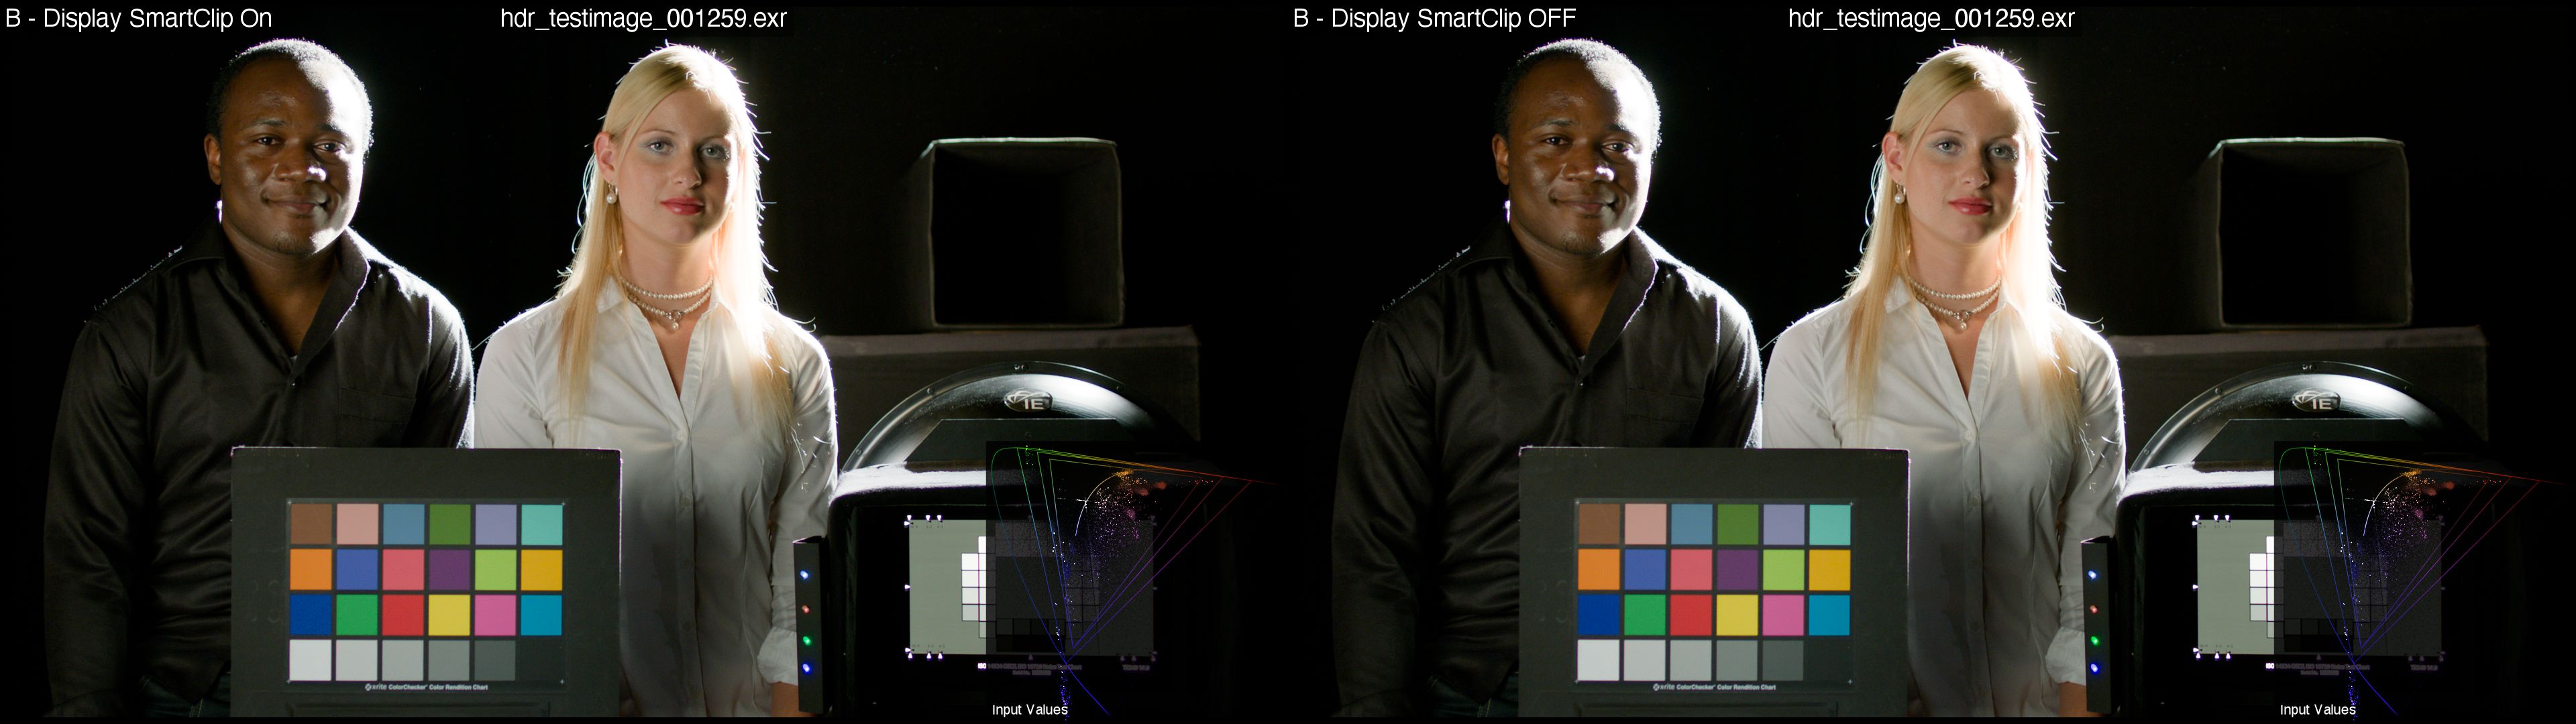
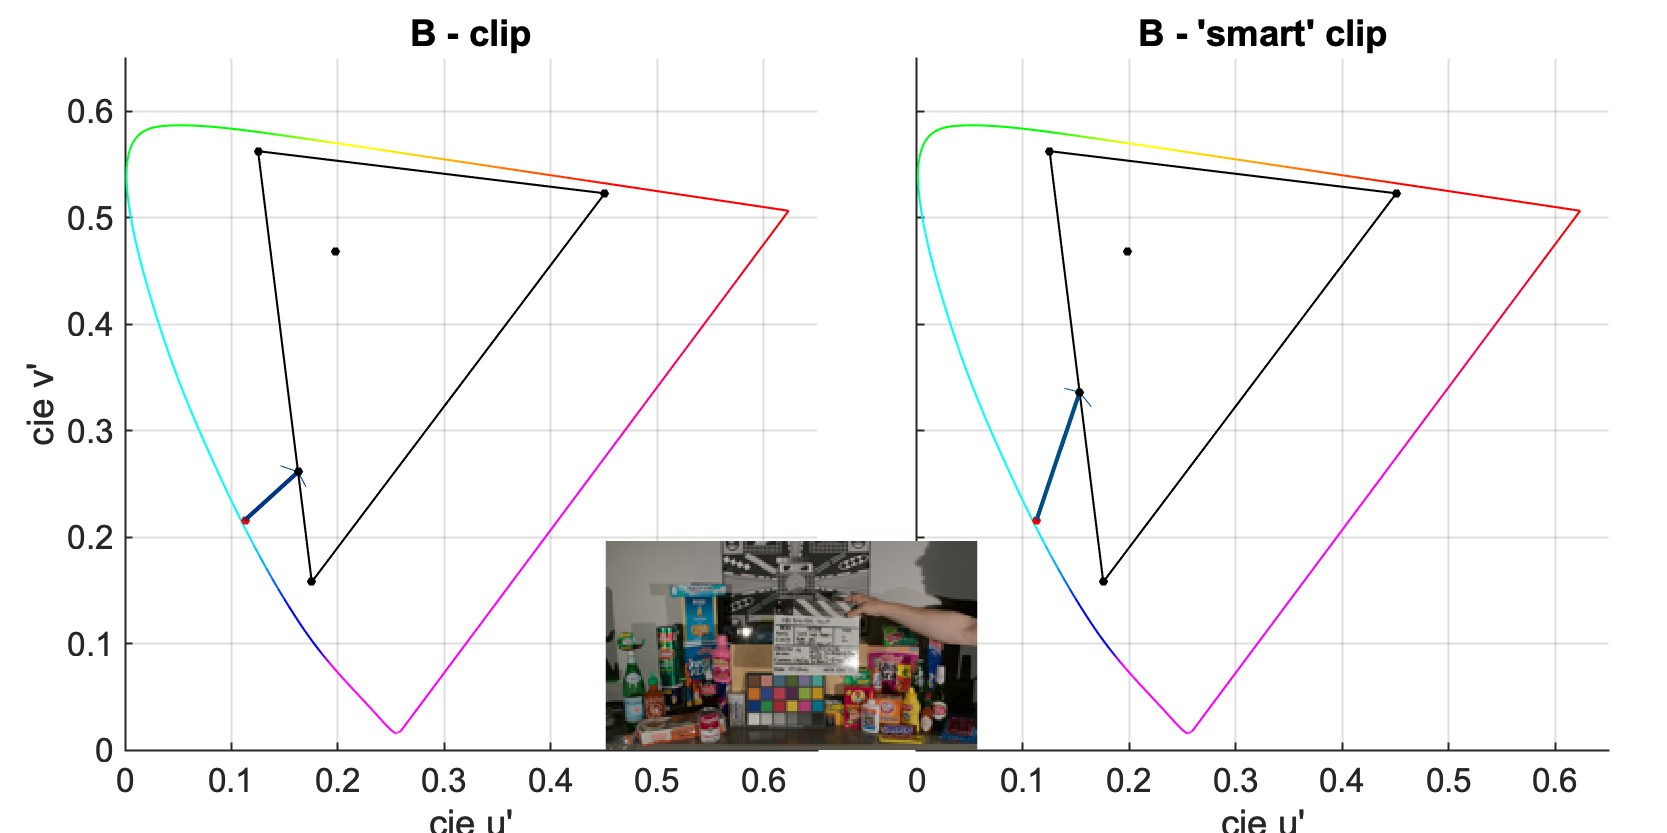
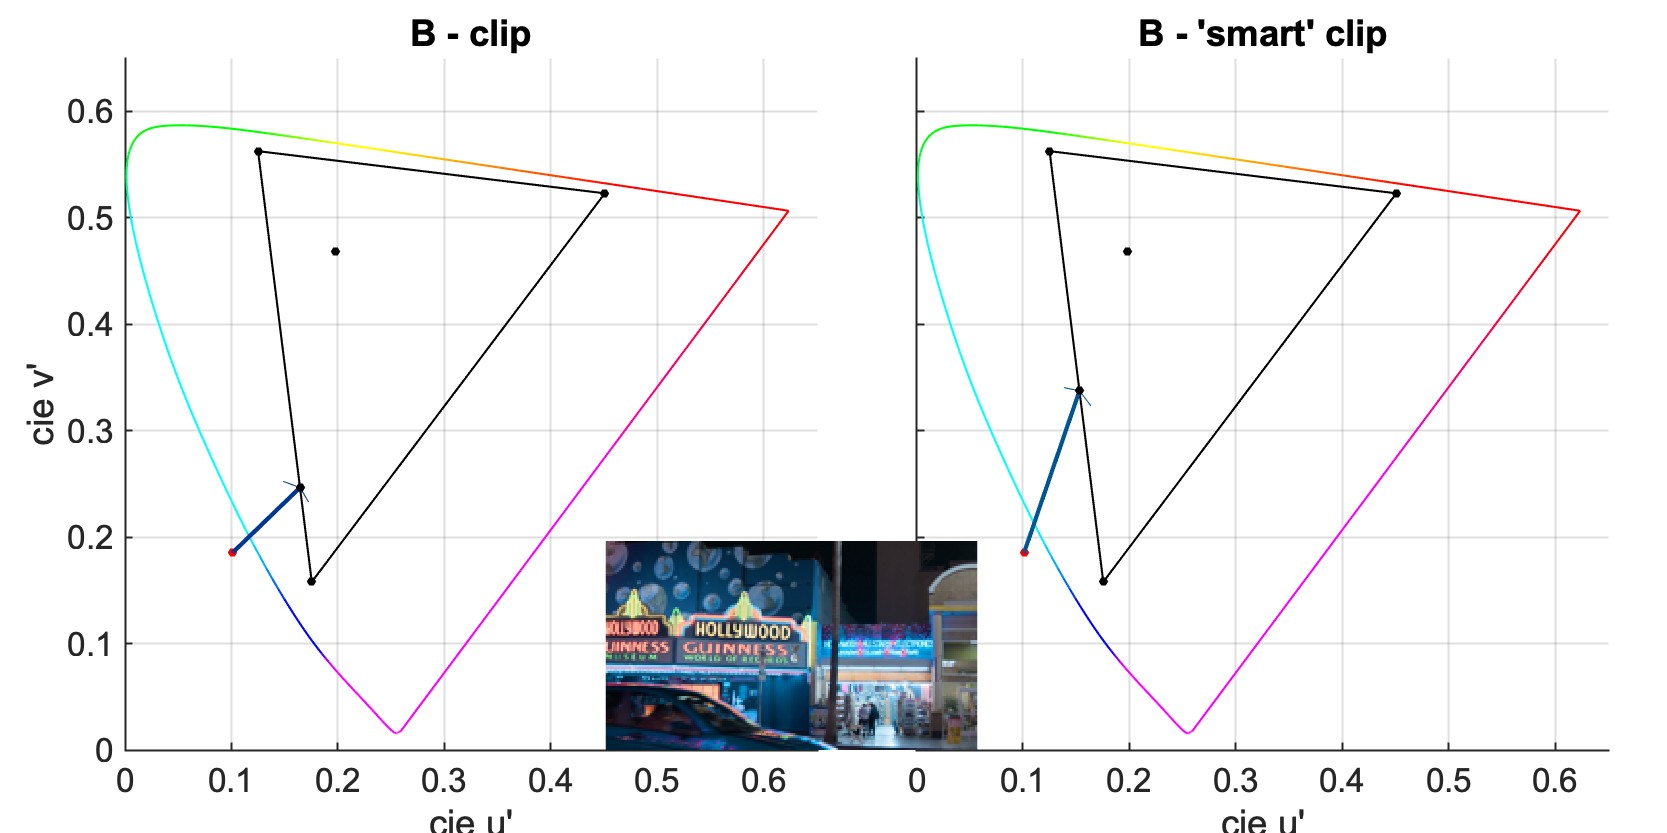
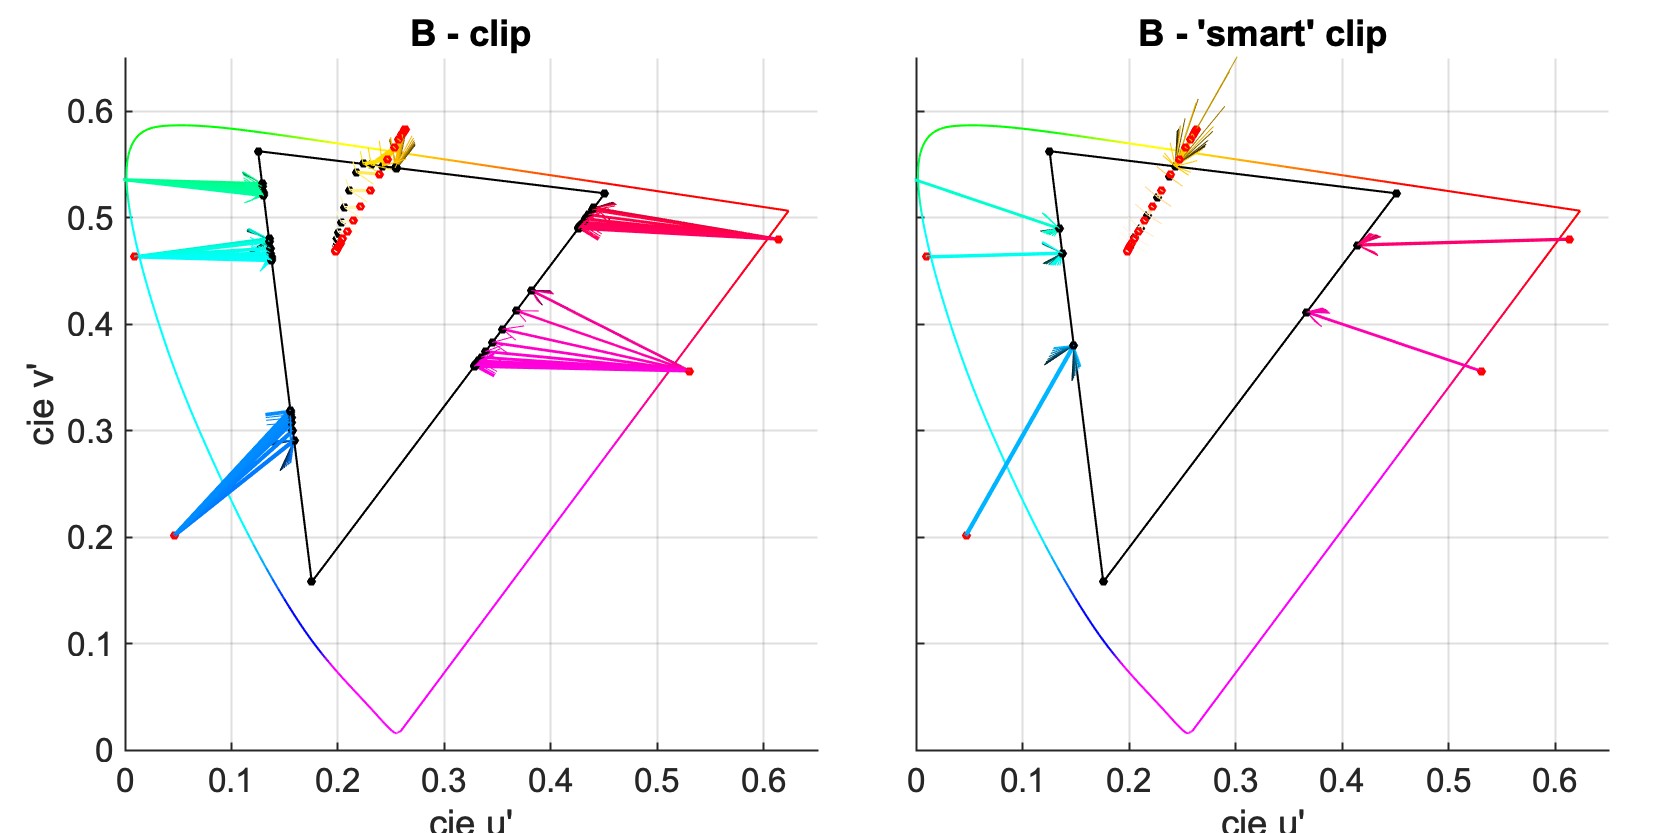
Simple Clip vs “Smart” Clip
After the tonemapping and ratio restore, the RGB values are converted to display RGB and prepared with the inverse EOTF of the display. In the process of matrixing to the display RGB primaries, many values can be out-of-gamut. Not surprisingly, the method by which OOG colors are brought in to the display gamut boundary can have a big impact on the perceived hue or gradation of color.
With normal “simple” clipping, chromaticities along the edge of the gamut triangle tend to move directly in toward the gamut boundary, in a direction of travel almost perpendicular to the edge of the triangle. Values near or outside the corners between edges, tend to clip in to the primary corner.
A “smart clip” uses the same ratio restore algorithm (previously used in the tonemapping operation) and “restores” the ratio of the clipped RGB values. The effect of this is that values clip in toward the gamut boundary in a direction of travel toward the white point on the chromaticity diagram.
Which one of these methods is “correct” is subjective. These two versions are compared in the contact sheet images below. This, and all gamut-mapping for OOG values at display is obviously a huge area of very difficult decisions.