Whilst I havn’t been able to bolt it into a complete DRT yet, I have been able to make this plot.
J = 5.0
M = 0 → 100
h = 0 → 360 in 32 bands
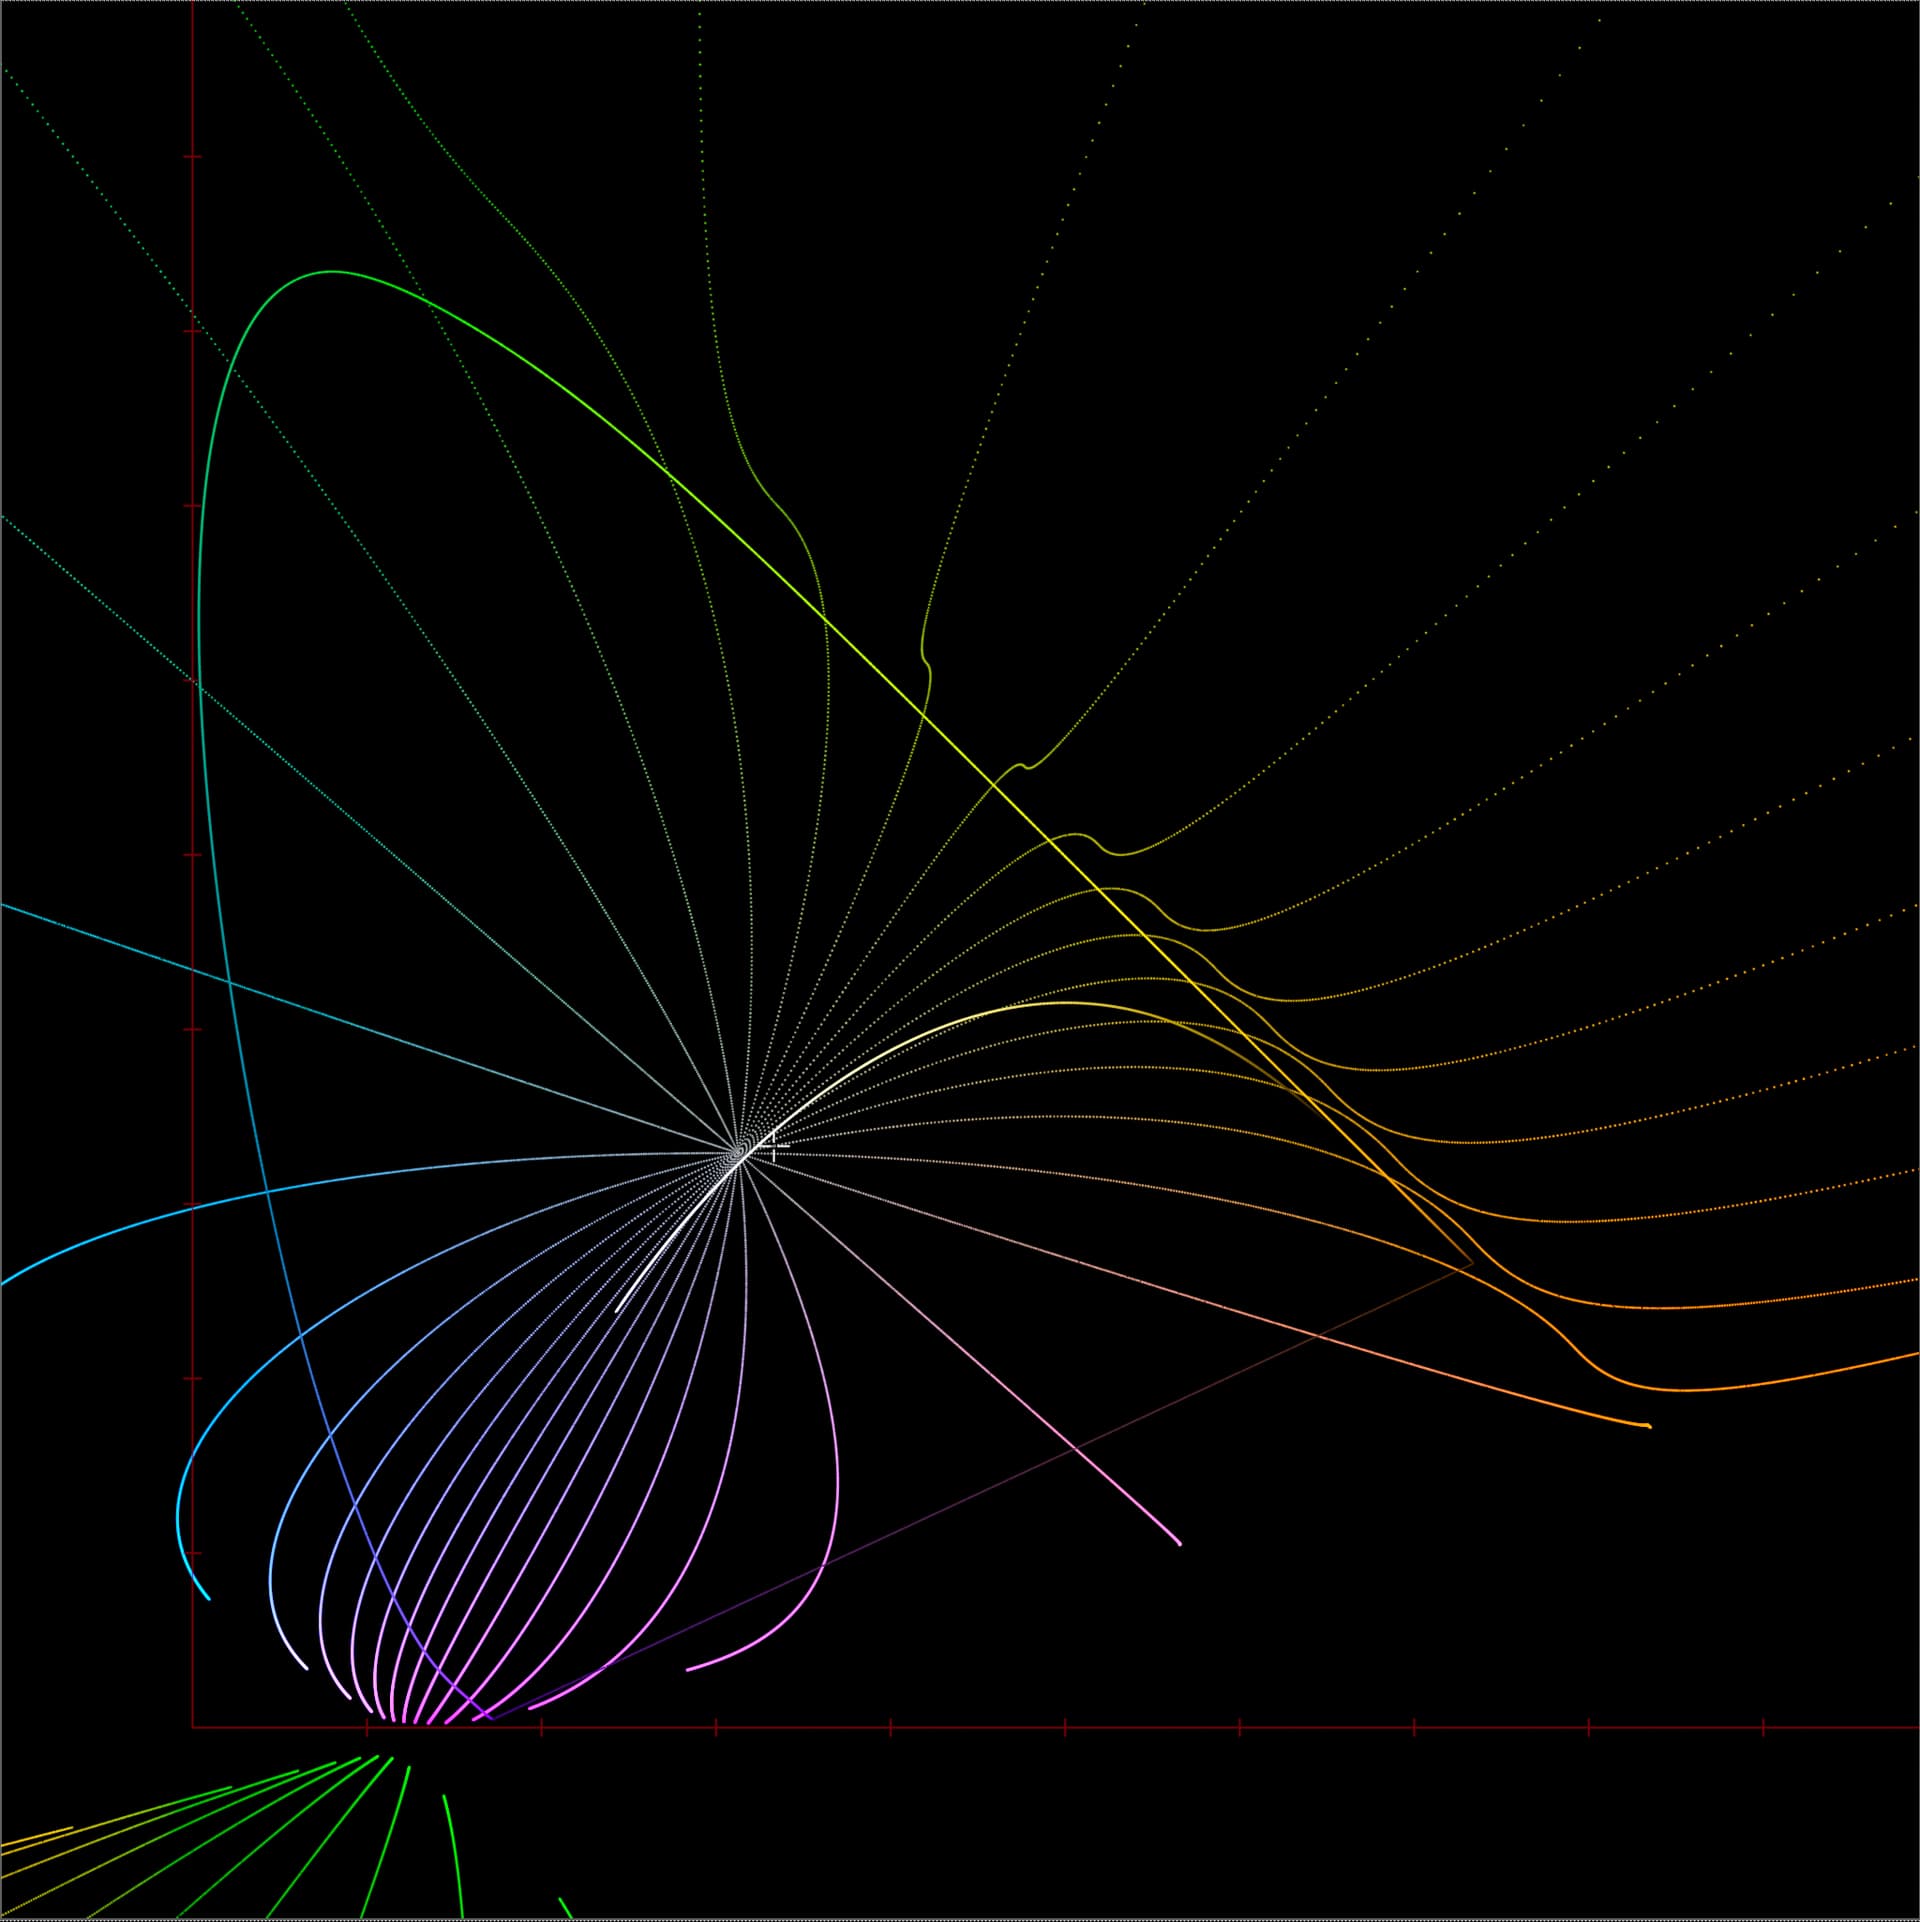
My initial impression is that this isn’t going to make things any more controlable around blue, with a collapse point very similar to ZCAM (Maybe even closer), and a lot more strangeness around yellow beyond the spectral locus.
All of this looks like super reasonable behaviour for real world plausible colours inside the locus, but weirdness outside of it. Totally reasonble for a model who’s goal is to make predictions about the appearance of real colours to real observers. But less than ideal in our case, where we’re trying to find plausible new homes for nonsense colours.