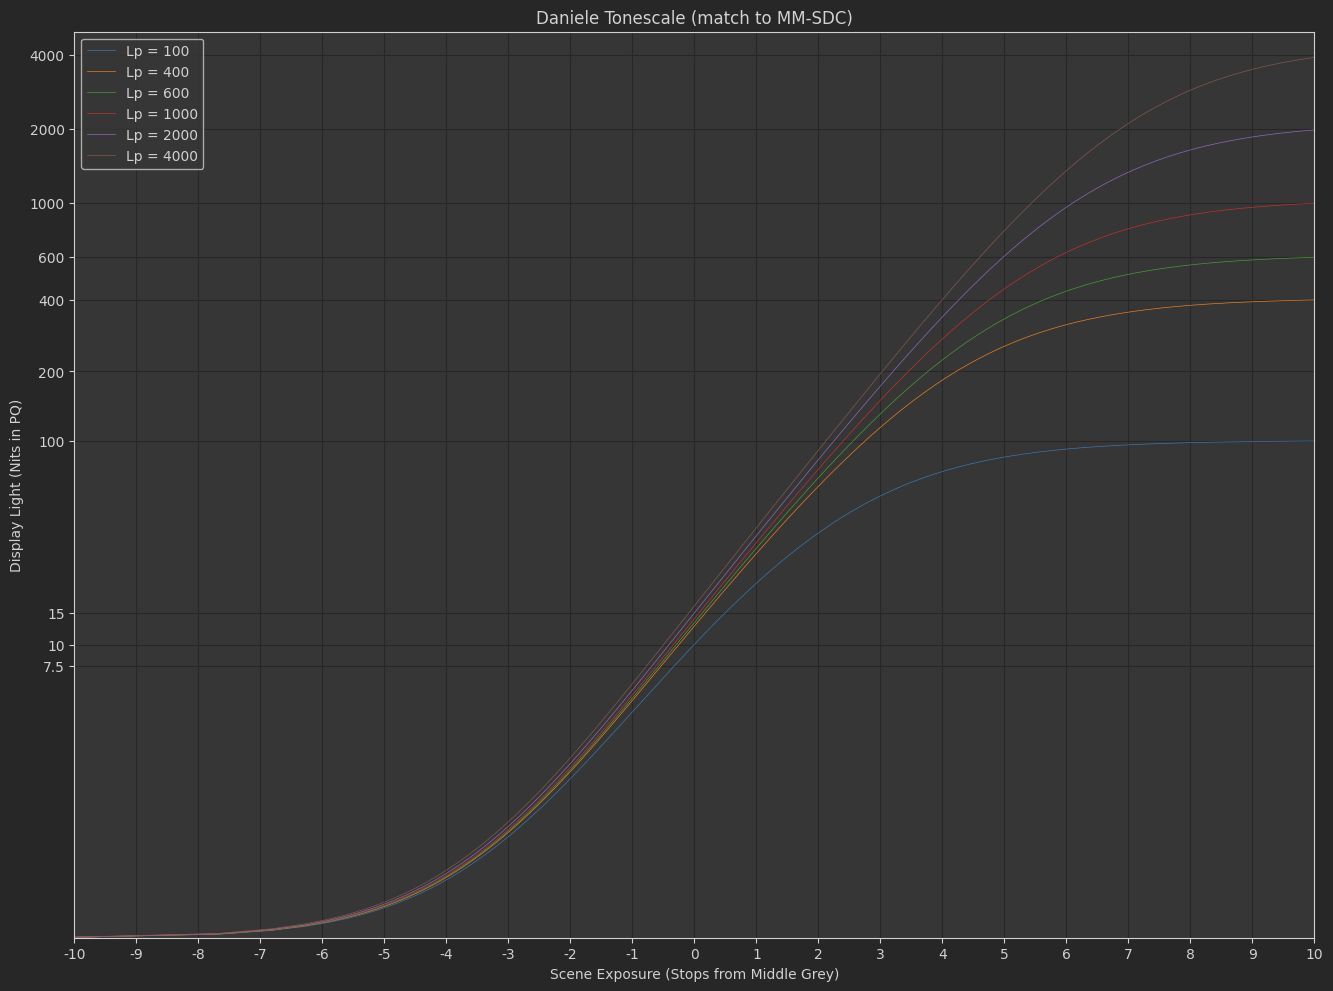
Agreed. Personally I’d like the curves to hit peak luminance at ACEScct 1.0 (or around 10 stops above mid grey) but this isn’t doing exactly that but that’s what I tried to hit with those numbers. I’m equally unsure how Jed derived his numbers.
Looking back at my tonescale models colab, I realize I did not describe well my thinking behind what scene-linear value we decide to map to peak display value. I’ve added a bit more description on this topic there, but in short:
For all 3 of the tonescale models I shared in that colab, the scene-linear value to peak display value mapping roughly follows the following table:
| L_p | value |
|---|---|
| 100 | 35 |
| 600 | 65 |
| 1000 | 75 |
| 4000 | 100 |
The regression fits you see linked in the colab code are to find a function of L_p that roughly fits these values through the tonescale function, so that we can smoothly vary L_p and get an “interpolated” result that makes sense. FYI there are also a few variations of tonescale functions which allow you to explicitly specify this mapping (at the expense of mathematical complexity), in the tonescale functions colab I posted earlier.
I don’t believe this is the only valid approach though. I think @daniele suggested in one of the meetings last year to have a constant peak white mapping, perhaps based on the peak value of the log space used for grading (ACEScct in the ACES system, I guess). There are pros and cons to each approach that should probably be considered.
Edit: removing the term “luminance”, because this discussion really has no consideration of color information.
2 Likes
wait wait,
we have two scaler m and w,
- m is post tonemapping
- w is before
with w you move exposure in a scene-referred scene
with m you move so that the top end lands where it should be
so which scene-referred value should hit max on the output is not something w should do.
w is there to adapt exposure between SDR and HDR.
So if you can express how let’s say grey should move between SDR and HDR this should guide the calculations of w. Nothing else.
1 Like
It’s not, it’s the w_1. It should be named m_1 perhaps. The w only changes exposure.
Yes, agreed on all points (sorry for the confusion). In my post above I’m only talking about m. I’m using different names for the variables, but the models I built are exactly as you describe:
- pre-tonemap multiply adjusts position of grey (overall image exposure)
- post-tonemap multiply adjusts position of peak / max value (HDR/SDR scaling and peak value position)
Additionally (in case it is not clear) all of the tonescale models that I built are driven with one user parameter (L_p), which in turn drives the variables of the tonescale function. The tonescale functions generally have the following variables:
- pre-tonemap multiply
- pre-tonemap power function (only in the “dual contrast” tonescale model)
- post-tonemap multiply
- post tonemap power function for “contrast” and surround compensation
- quadratic toe compress flare compensation
yes naming is important.
I still think that tone scale match between SDR and HDR should be driven by w and not m.
m shall be used to map any number (in my first suggestion it is inf+) onto the top end of the output scale. We can trivially change it to 1.0 in ACEScct or 128 or whatever… Not sure if this is an important factor now. It barely changes the appearance of the curve.
I think it should be possible to hit the display peak without having to create crazy scene values. I don’t know whether fixed limit or a variable range is better, but the limit(s) should be decided. It’s of course possible to match exactly what MM-SDC candidate uses right now and just go with that.
In yesterday’s meeting @nick said:
“Some broadcasters mandate graphic white at 100% SDR.”
In SDR, with mapping to infinity, ACEScct 1.0 comes out as 0.998. Jed’s limit of 35 for SDR comes out as 0.987. Do you think these would be close enough for SDR so that they would be acceptable? Going with the infinity mapping would be simplest.
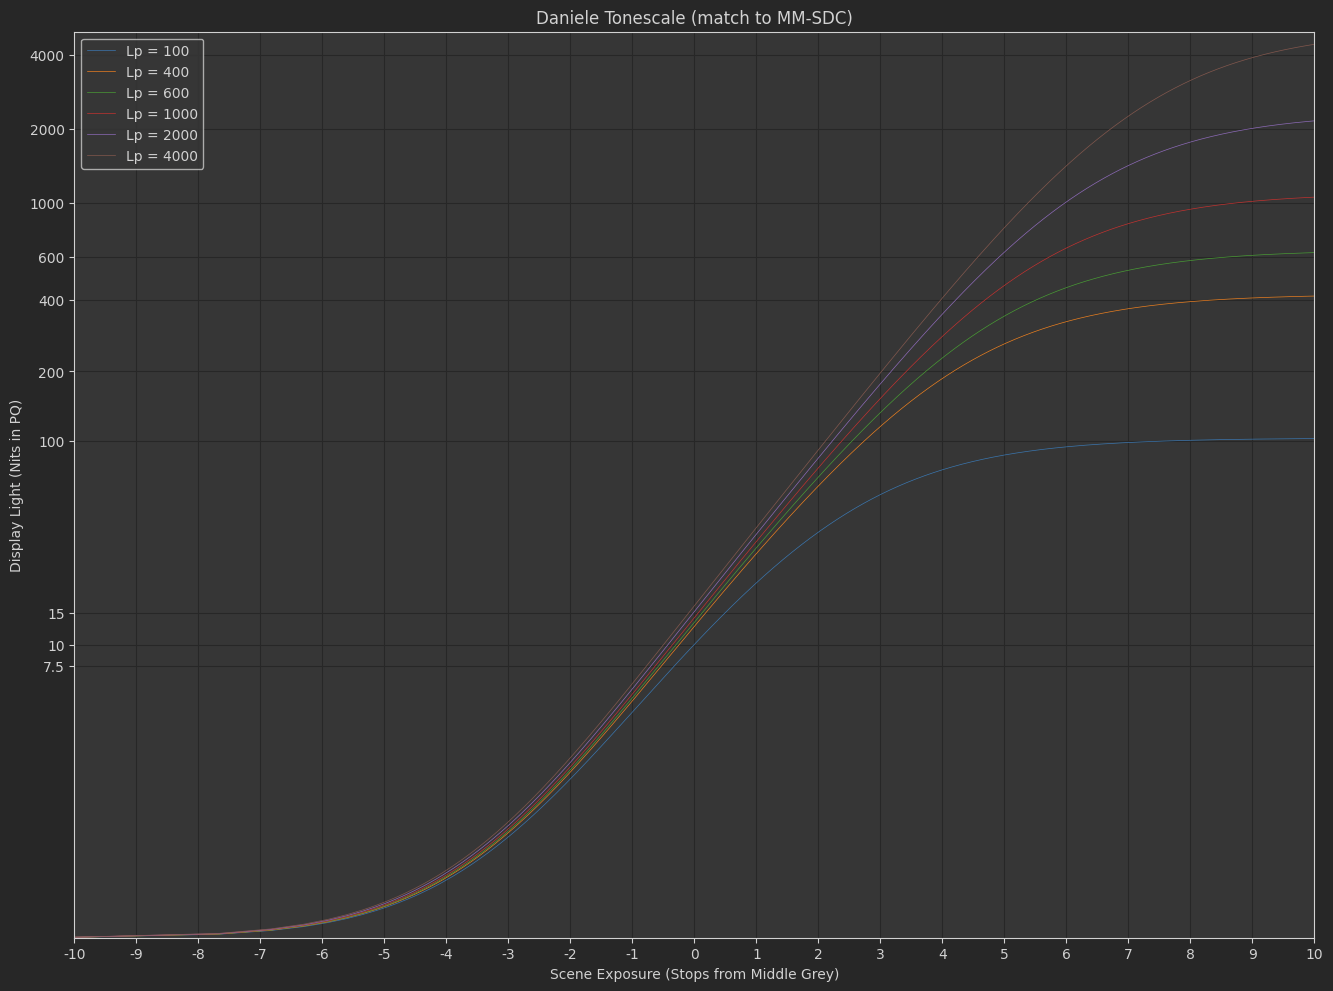
another version where a finite number r is “hitting the roof”
Same Rendering Code
4 Likes
Did a quick check where other DRTs land peak white in Rec.709. These are very approximate, I just checked the values from the Nuke viewer.
| DRT | scene value |
|---|---|
| ARRI REVEAL | 230 |
| RED IPP2 | 190 |
| ARRI ALF2 | 57 |
| ARRI K1S1 | 41 |
| TCAMv2 | 40 |
| SONY S-Gamut3.Cine | 30 |
| ACES 1.3 | 17 |
Here’s a version with Daniele’s r parameter that sets the peak white value. I’ve set it now to ACEScct 1.0 but of course that could now be also fitted to match the MM-SDC values if wanted. Other parameters should give decent match to MM-SDC now.

Heya,
out of curiosity, are there visual examples of where C2 continuity is necessary over C1 ?
Thanks,
Chris
1 Like
C2 is guarantee for continuous curvature and no defect no matter the quantisation of the data.
It is C0, C1, C2 continuous when C_0 is set to 1, but at any other values the tangents are really wobbly with a kink in the middle: ACES2 MM-SDC with Tangents
It might not be visible but this is rather undesirable.
And it is a useful limitation…
1 Like
Why?
Why?
Don’t get me wrong, I am not opposed to C2 continuity as a requirement. I just think a better justification than “because I said so” could be useful.
1 Like
Having any form of wobbliness, especially in the middle of the brightness range is not a a design we should be satisfied with, it is not elegant even if it is not producing artefacts with the current parameterisation. It makes fitting with other functions harder for example, although most likely not an issue. Unless there is an excellent reason to have a piece-wise function grafted at 18% that produce wobbly curvature, then a function that has continuous curvature is preferable, it is simpler to manage and much more elegant.
Every modification to an image will have second order consequences. Sometimes these second order effects are driven by a derivative of our modification.
We want that these second order effects are continuos.
3 Likes
We could generalise to the n th order as the modifications have consequences on all the derivative orders, them being computed recursively.
@sdyer, the following version of Daniele’s curve now matches the exposure exactly to the MM-SDC curve and the peak white is a very close match (100 nits lands white at ~35 and 4000 nits at ~100). This version doesn’t have the r parameter for peak white. This uses Jed’s original model for the peak white (the m_1 parameter).
Could I possibly ask that the labelling in the Desmos plots is edited for clarity? It says “ACEScc log plot on x axis”, but opening that up it is a pure log function from L_{min} to L_{max} stops around 0.18. Those default to +/-12, so it is in fact not ACEScc at all. That confused me for a while, as I was trying to work out why setting r to 222.86 (ACEScc 1.0) did not make the curve pass through [1.0, 1.0].