I am going to have to ask you how this can happen. If a Rec.709 image file is display-encoded then all the values should lie between 0…1 and have the Rec.709 EOTF applied to them. Same for sRGB, BT.1886 and Display P3 as those are all 0…1 relative encoding. Could it be that you are using raw files in scene-referred Rec.709 gamut? In that case, the IDT is not the inverse ODT but a simple 3x3 matrix transform.
Any signal below minimum code or above maximum code value, e.g. outside [0, 255] in 8-bit, is lost in a typical integer processing chain, I’m confused as to what you are referring to here. Do you have a practical example?
I assume he’s talking about “video” cameras or broadcast TV cameras, where there is often information above 100% white, which is preserved in the super-white range above CV940 of the “legal range” coding that this kind of camera normally uses.
Just regular h264 video files from some phones and DSLRs. They often have information above the legal range. And signal levels are also set correctly, this was the first thing I checked when I’ve noticed this at the first time.
No, I’m not talking about RAW files with output set to Rec709, I understand that there is almost always no tone-mapping and it’s just a Rec709 formula encoding curve. And because of that it has a lot of useful information above 1.
Yes, this is exactly what I’m talking about, thanks!
Here is a source footage from Sony alpha A7C. It has Limited range in metadata. And visually looks like this metadata is correct. So we probably can assume that this video is in limited levels, and that setting levels to Video is correct (which is also usually done automatically). But it has information above legal range. Details of the clipped window could be restored if “Inverse Rec709 ODT” IDT didn’t clip at 1. And sometimes there is some information below legal black as well.
I will take a look at the footage later but the Inverse ODT should not clip and it will reexpand the values to its original domain, e.g [0.002, 16.3] for the sRGB 100nits ODT. Two questions: Is the footage encoded with the Rec709 ODT and which software are you using to apply the inverse ODT, it works perfectly in Nuke for example.
Footage is Rec709-ish (with tone-mapping and other things) source from camera. So it’s encoded by camera. I use Resolve. I also have Nuke non-commercial, but I don’t use it. I’ve opened it a few times, when I was helping a cleanup artist to set up her Nuke color management.
Actually here is another example of a similar problem (not related to ACES but super white data). Nuke wasn’t able to bring back superwhite information from rec709 video in limited range. That’s why we decided to encode it into LogC in Resolve, so cleanup artist would have all the super white data. But probably Nuke can do it somehow. I opened nuke just a few times.
Well you have to choose between Legal range and Full range in Resolve. There’s also Auto but I’m not sure what algorithm it uses to pick between Legal and Full since I prefer not leaving anything to chance and I don’t use it. Actually, as a game developer, I never use Legal range  so when you talk of CV 940 being 100% white, I’m thinking more 940/1023 white. For me 100% white is graphics white at CV 1023 thus you can’t have anything display-encoded higher than 100% and lower than 0%
Applying the Inverse ODT seems like a super bad idea here as you have no clue as to what was used on the way forward. You would probably need to shoot some test footage at different exposures and retrieve the camera response functions (CRFs) to get anywhere sensible.
With Nuke, you should be able to load the data without processing at which point you can do legal to full scaling, linearisation, etc… Admittedly, It can get ugly rather quickly though!
I understand that doing this inverts all the RRT things that wasn’t made by the camera. But it also does one very important thing. It is undoing tonemapping that is presented in the rec709-ish source. Of course its just an approximation and it will never give me real scene linear values. But I’ve never noticed any artifacts by doing so. And in the end it goes back by the same ODT that was used as an inverse. At least for SDR ODTs it looks pretty good for me. It’s way better and quicker to work with compared to using rec709 formula for transforming source footage into ACES. Because it would give double tone mapping in the end. And also it’s so unintuitive to work with tone mapped highlights that are baked in in the working space.
Video range is very common in video ![]() Even LogC ProRes from Alexa is in video range.
Even LogC ProRes from Alexa is in video range.
Still, as @Thomas_Mansencal says, to properly use the inverse ODTs you have to do Legal to Full conversion. However, if your video is tagged Limited but has data outside the Limited range then I’m thinking that you should probably ignore the metadata and ingest the clip as Full range.
No. That really is a bad idea!
But equally, trying to apply an inverse of the ACES tone mapping (which rolls of to 100%) to something from a video camera which rolls off to 109% is probably also a bad idea!
1 Like
My current workaround with soft clipping before Inverse IDT is far from good. But If Inverse ODT wouldn’t clip below 0 and above 1, those super white and sub-black values would be available in ACES, but still be mapped above 1 and clipped by SDR ODT. So they could be brought back if needed, but until that the image would look identical to the source.
If you are always working with the same type of camera, it is worth trying to find out the CRFs, it is a bit of work but you will get closer to proper linearisation than using a random transform on random footage while hoping for the best.
1 Like
In my continuing mission to document all sigmoid functions known to exist, here is another post on the subject.
The Hill-Langmuir equation f\left(x\right)=\frac{x^{n}}{x^{n}+k} (often referred to as the “Naka-Rushton equation” in the literature) has been shown to describe the response of eye cells to light stimulus
update: I got lost in my trash pile of papers about colorscience and linked the wrong paper before… I’ve updated the links below.
- Michaelis-Menten Equation
-
The Luminance-Response Function of the Dark-Adapted Rabbit Electroretinogram - Kee-Ha Chung, M.D., Sang-Ha Kim, M.D., Jin-Ho Cho, 1994
Korean J Ophthalmol. 1994;8(1):1-5. Published online June 30, 1994
DOI: Links for doi: 10.3341/kjo.1994.8.1.1 -
S-Potentials from Luminosity Units in the Retina of Fish (Cyprinidae) -K. I. Naka and W. A. H. Rushton, 1966
J Physiol. 1966 Aug;185(3):587-99. doi: 10.1113/jphysiol.1966.sp008003. PMID: 5918060; PMCID: PMC1395832. -
The Luminance-response Function Of The Human Photopic Electroretinogram: A Mathematical Model - Hamilton R, Bees MA, Chaplin CA, McCulloch DL.
Vision Res. 2007 Oct;47(23):2968-72. doi: 10.1016/j.visres.2007.04.020. Epub 2007 Sep 24. PMID: 17889925. -
Light Adaptation And Photopigment Bleaching In Cone Photoreceptors In Situ In The Retina Of The Turtle - D A Burkhardt 1994
Burkhardt DA. Light adaptation and photopigment bleaching in cone photoreceptors in situ in the retina of the turtle. J Neurosci. 1994 Mar;14(3 Pt 1):1091-105. doi: 10.1523/JNEUROSCI.14-03-01091.1994. PMID: 8120614; PMCID: PMC6577543. -
Visual Adaptation In Monkey Cones: Recordings Of Late Receptor Potentials - R M Boynton, D N Whitten 1970
Science. 1970 Dec 25;170(3965):1423-6. doi: 10.1126/science.170.3965.1423. PMID: 4991522.
The Michaelis-Menten equation is a simpler form without the power.
f\left(x\right)=\frac{x}{x+k}
I recently rediscovered something which is probably obvious to most of you already: the function I’m using in OpenDRT is based on Michaelis-Menten, but adds a power function after the tonemap is applied.
f\left(x\right)=\left(\frac{x}{x+k}\right)^{n}
This is not quite the same thing as the Hill-Langmuir equation where the power is applied directly to the input data, and the behavior (and curve) is slightly different.
So I thought it might be a fun exercise to solve this slight variation for some intersections, and see if it could also be useful for a tonescale in a display rendering transform.
It turns out that solving for middle grey and 1.0 intersection constraints, as well as the inverse, is quite easy to do (or maybe I’m just smarter than I was a year ago when I started this thread originally).
Here is a google colab using sympy with some excessively descriptive explanation, for the math-cautious among us.
And here is a desmos with the final solve.
If it were desired to apply an “s-curve” on log domain data, this form of the equation might work better than the one used in OpenDRT.
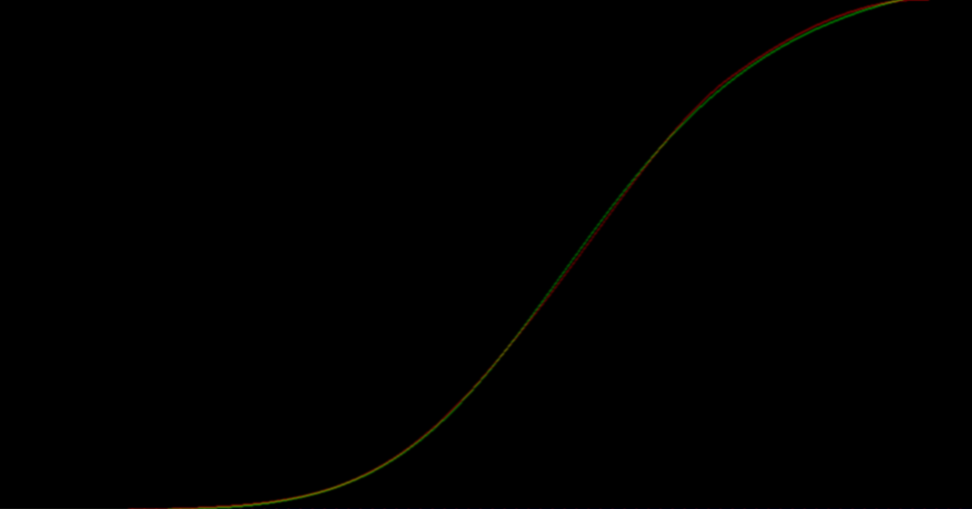
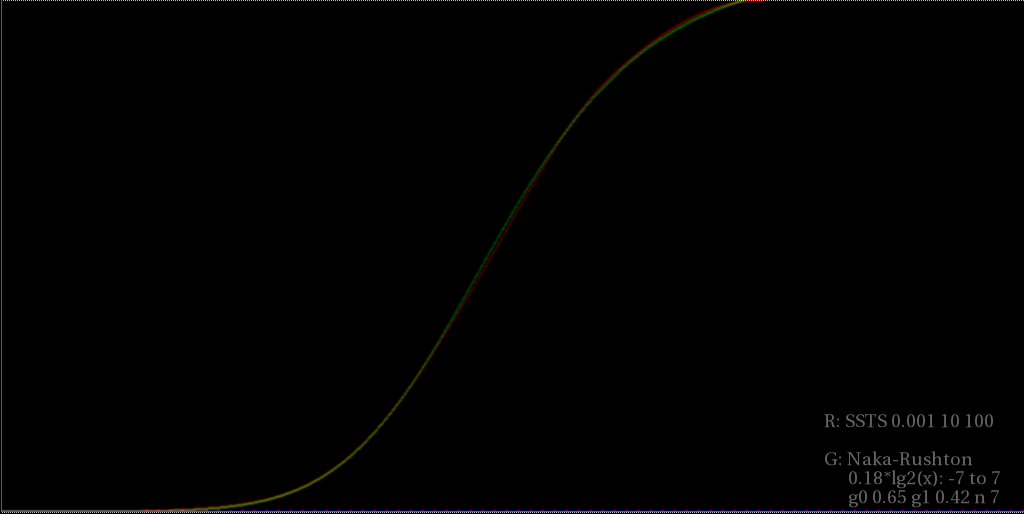
Just as a quick proof of concept, I spent a few minutes manually tuning the intersections and powers on a log2 input encoding to match the SSTS using the 0.001, 10, 100 settings, as shown in the last meeting.
HLTonemap_match_ssts.nk (13.6 KB)
I bet it would be pretty easy to to fit @KevinJW 's average sdr tonescale data with this function too, if that data were available. Might be a fun experiment.
Edit
Made a couple little tweaks to the post above for readability, and added a variable m_1 for the upper point intersection constraint, in case it’s useful for fitting.
8 Likes
Nice work,
How does it Transfer to HDR?
I think your approach is better for HDR. I also think that it simplifies a lot to apply the tonescale to linear domain input data instead of log domain input data.
However there seems to be strong resistance to new ways of doing things here, so I thought it might be useful to post this alternate formulation which might work better in the log domain.
If matching the behavior of the SSTS is desired, it seems like this function works pretty well.

HLTonemap_match_ssts_hdr.nk (24.9 KB)
Personally I don’t really like the look of the SSTS in HDR though. It compresses highlights too much. But there doesn’t seem to be much interest in evaluating or even thinking about HDR in this working group either so maybe it’s a moot point.
Hope it helps clarify…
I think there is plenty of interest.
But my sense of if it is that’s HDR is in someways a simpler issue, as all of the boundaies we’re crashing into in the SDR domain will be relaxed in the HDR world.
Although it’s much harder in some other ways, as there are very few displays in the wild we can work with that aren’t complicating the issue by imposiinng their own secondary rendering/tonemapping step on top.
Isn’t the SSTS curve applied to linear domain data?
At the end of the day, it doesn’t matter if the curve is applied to linear or logarithmic data. If the maths is adapted accordingly, the same result can be achieved with either approach. I think it is simply that for visualisation of the s-curve, plotting on log/log axes can be clearer.
No. The Single Stage Tonescale is a bezier spline applied to pure log10 of input linear pixel value.
I would say it does matter quite a bit from a system design perspective. There are pros and cons to each approach.
Glad to hear this!
Naka-Rushton Tonescale Function
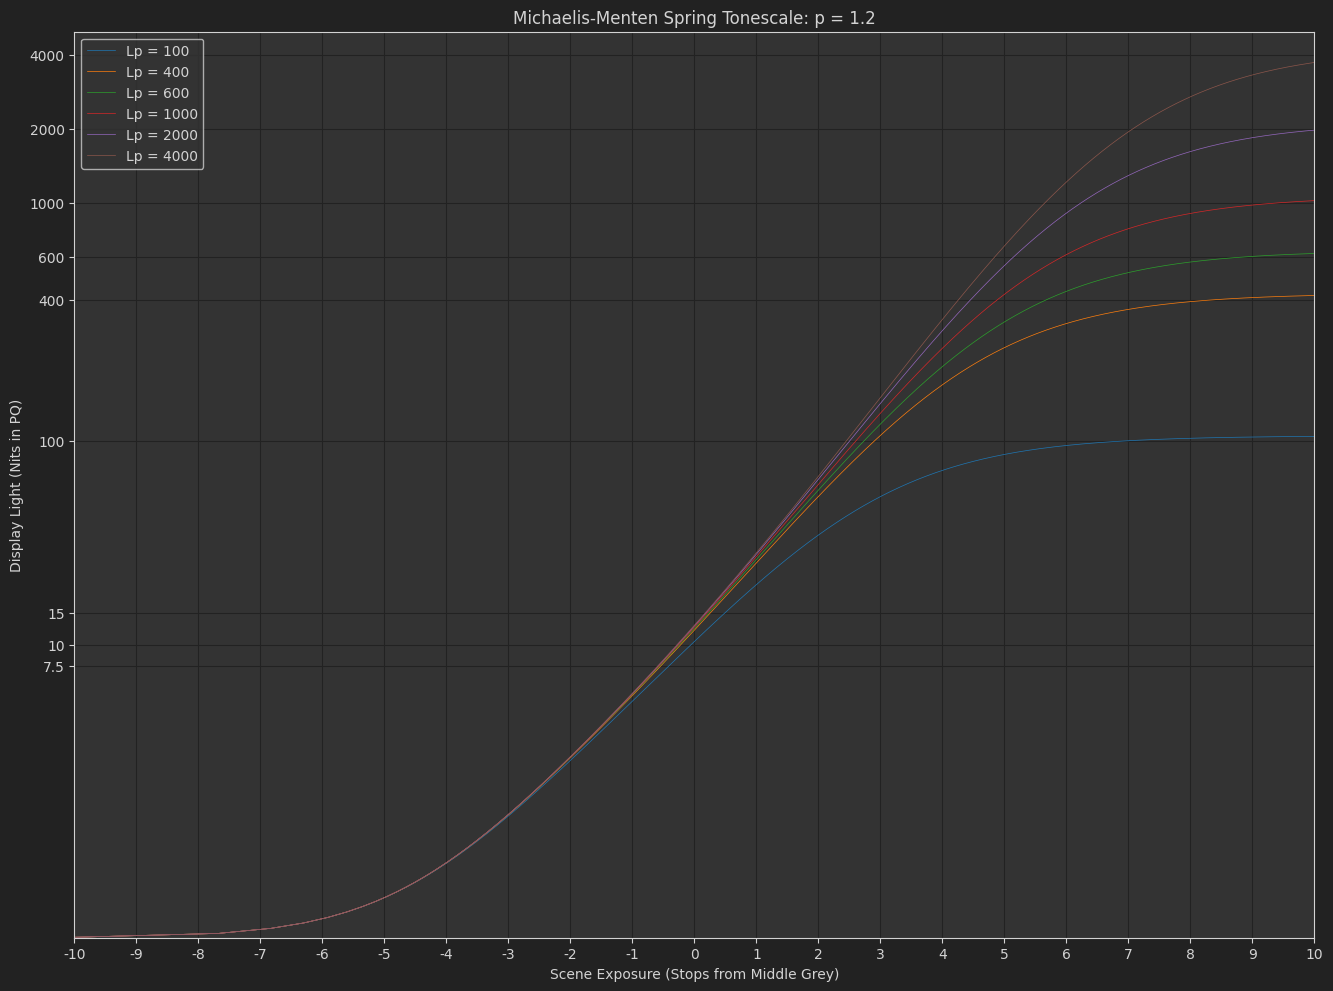
I spent a bit of time today experimenting with this alternate idea for a tonescale function (Let’s call this thing the Naka-Rushton Tonescale Function.)
“But what is tone exactly?”)
– The voice of @troy_s in my head
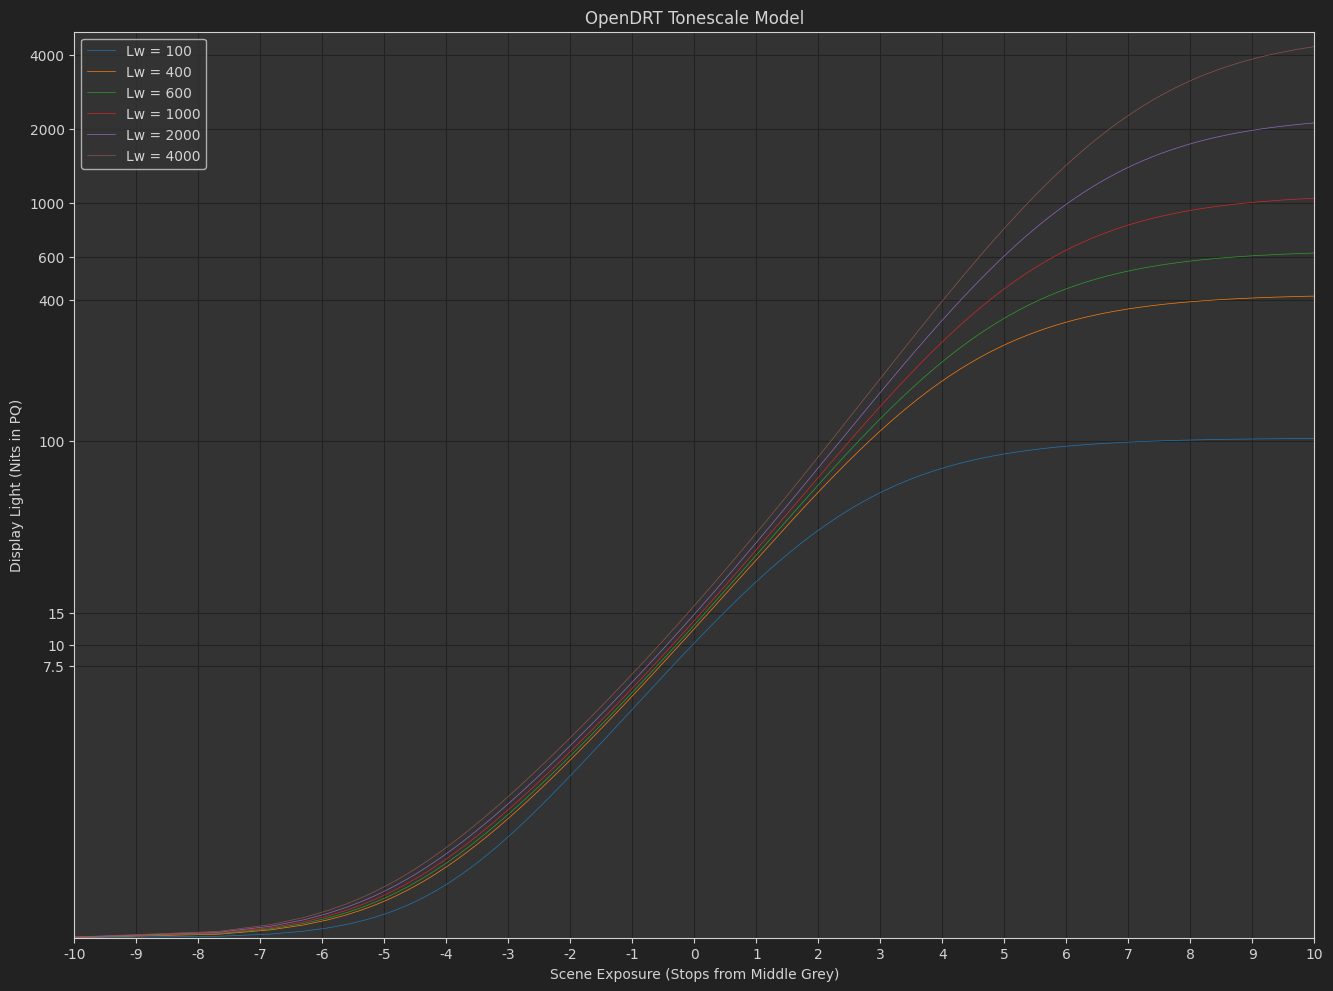
Long story short I came up with a model for how this function might be used across display devices with varying peak luminance. The function might actually work okay for HDR, though I will need to do more testing, and the usual caveat applies that I don’t have a professional quality HDR display device.
I made a colab to plot and compare different tonescale functions. The plots that follow have the following attributes:
- X-Axis: 0.18*2^ev stops from Middle Grey, -10 to +10 stops
- Y-Axis: Display light nits output, Displayed with PQ distribution - (comments welcome on if this is appropriate. I thought it did a good job of showing the behavior of the curves in HDR).
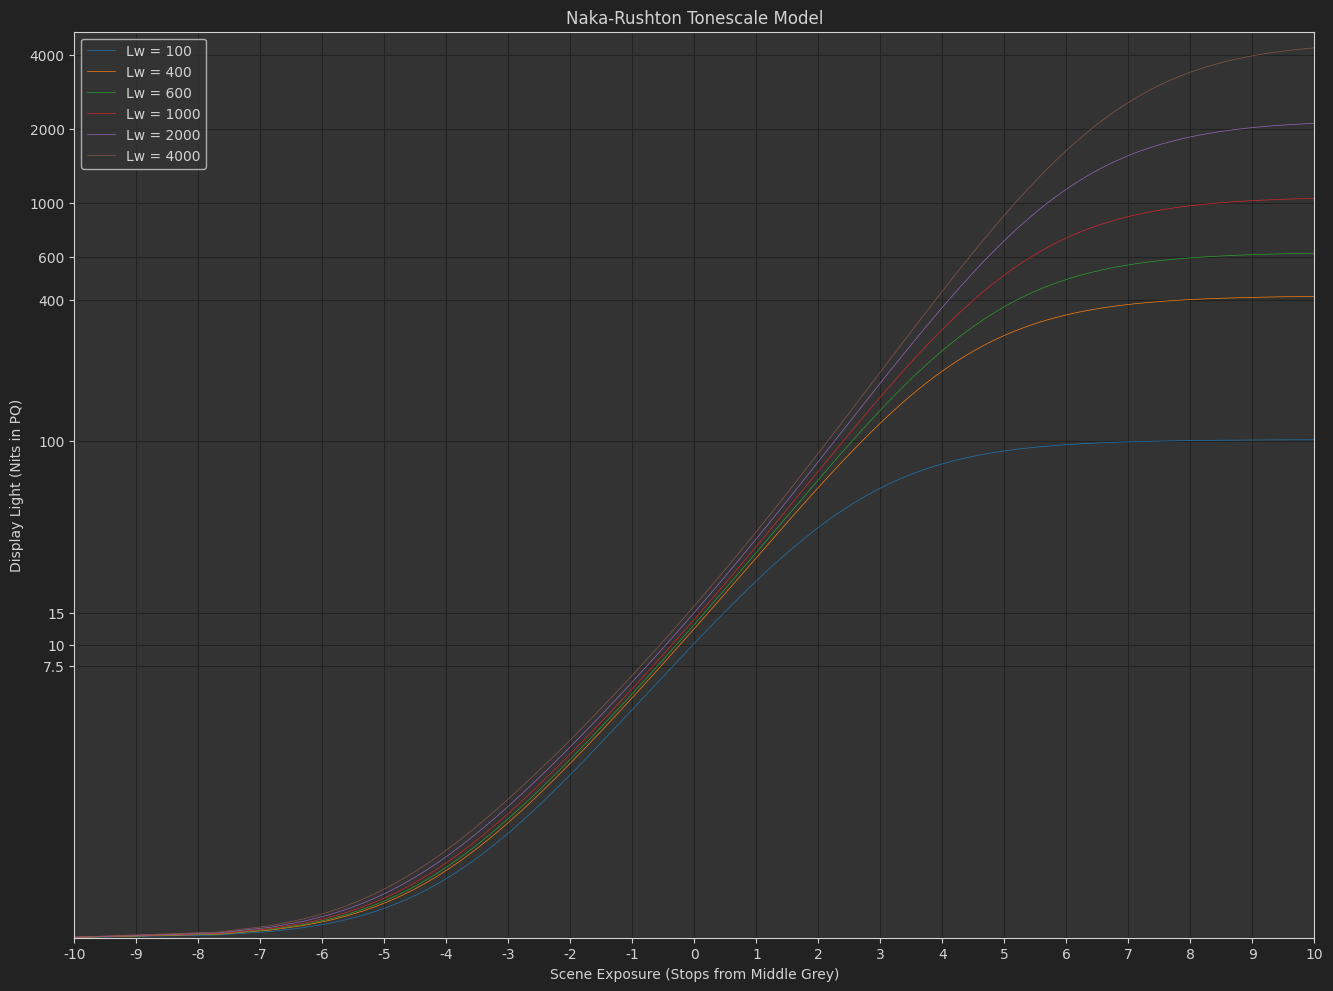
One advantage of the Naka-Rushton tonescale function seems to be controllability. With this function it is pretty easy to get the same shape out of the curve with varying middle grey output y position.
With the model I’m using in OpenDRT, I have to adjust the exponent on the curve as I transition between SDR and HDR. The power is set to ~1.4 in SDR and ~1.2 in HDR. This results in a bit of a change in the shape of the curve between SDR and HDR, especially in shadows. This might be good or bad depending on what you want.
OpenDRT Tonescale Model
The exponent in the Naka-Rushton function just sets the slope through the middle-grey intersection constraint. So if we keep the slope constant, the slope of the curve at grey stays constant. (I’ve added a flare compensation as well so this is not 100% true, but more true than with OpenDRT).
Naka-Rushton Tonescale Model
And as a desmos graph
And quickly hacked into OpenDRT (sat 1.1, no surround compensation model)
OpenDRT_NR.nk (26.8 KB)
The model was created by me by eye, looking at images, and comparing with other tonescales like the Arri transforms. I’ve also included a bit of an exposure boost on middle grey as peak luminance increases, as Daniele suggested in one of the meetings last year. One thing I’m a little worried about is that it is difficult to reduce slope at the top end as peak luminance increases, without changing slope by adjusting the exponent. So this curve might have stronger highlight appearance. Though I can not really confirm or deny this with the display devices I have access to. Any testing from people who have access to a professional quality display would be appreciated.
This weekend I learned me some matplotlib, so I thought it would be fun to use pandas and plot some other tonescales as well.
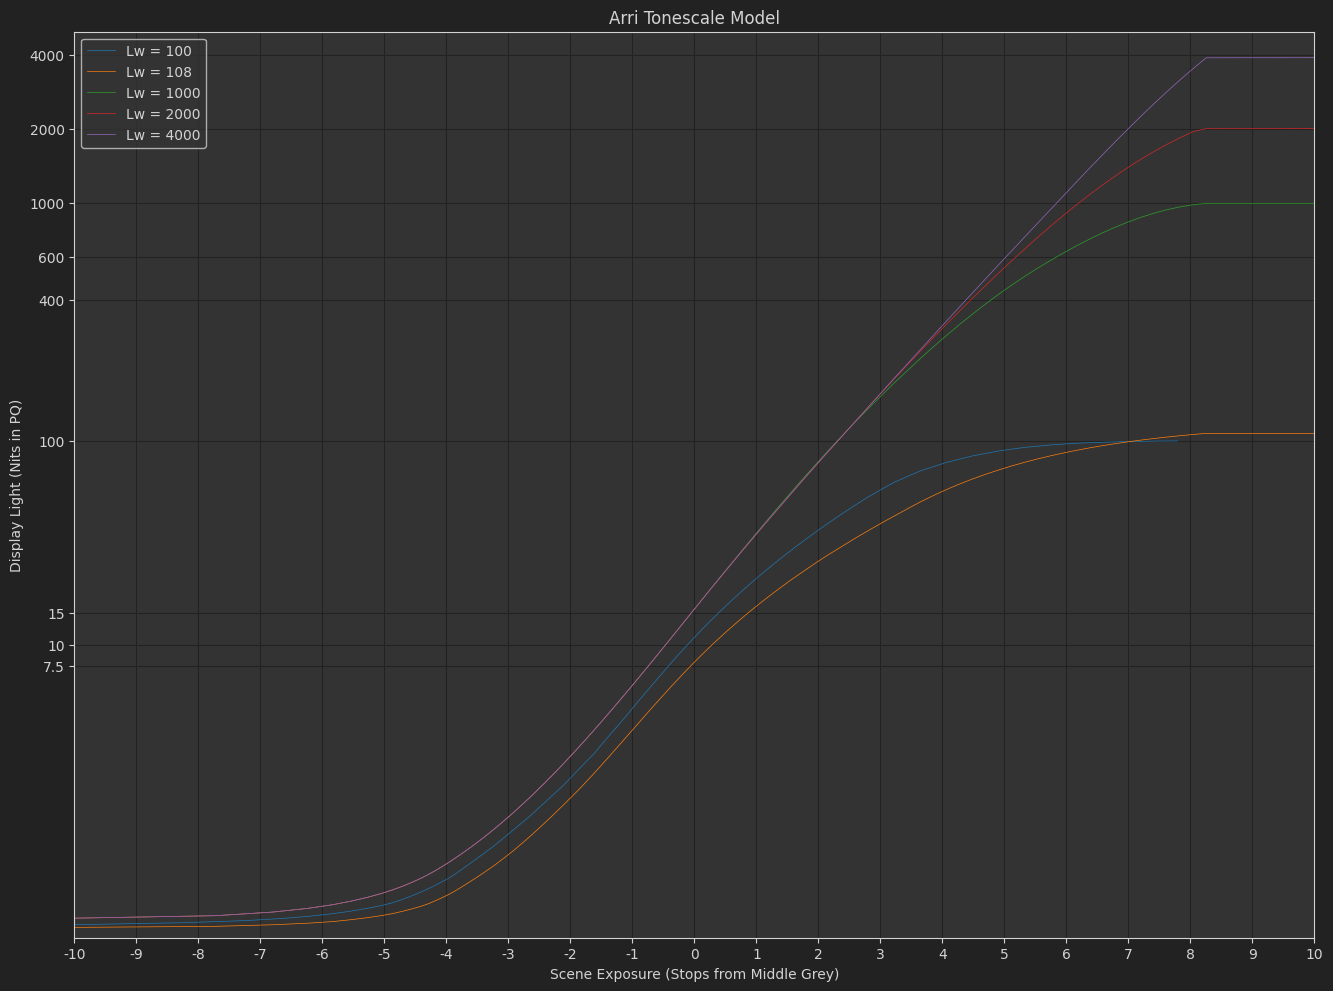
ARRI Tonescale Model
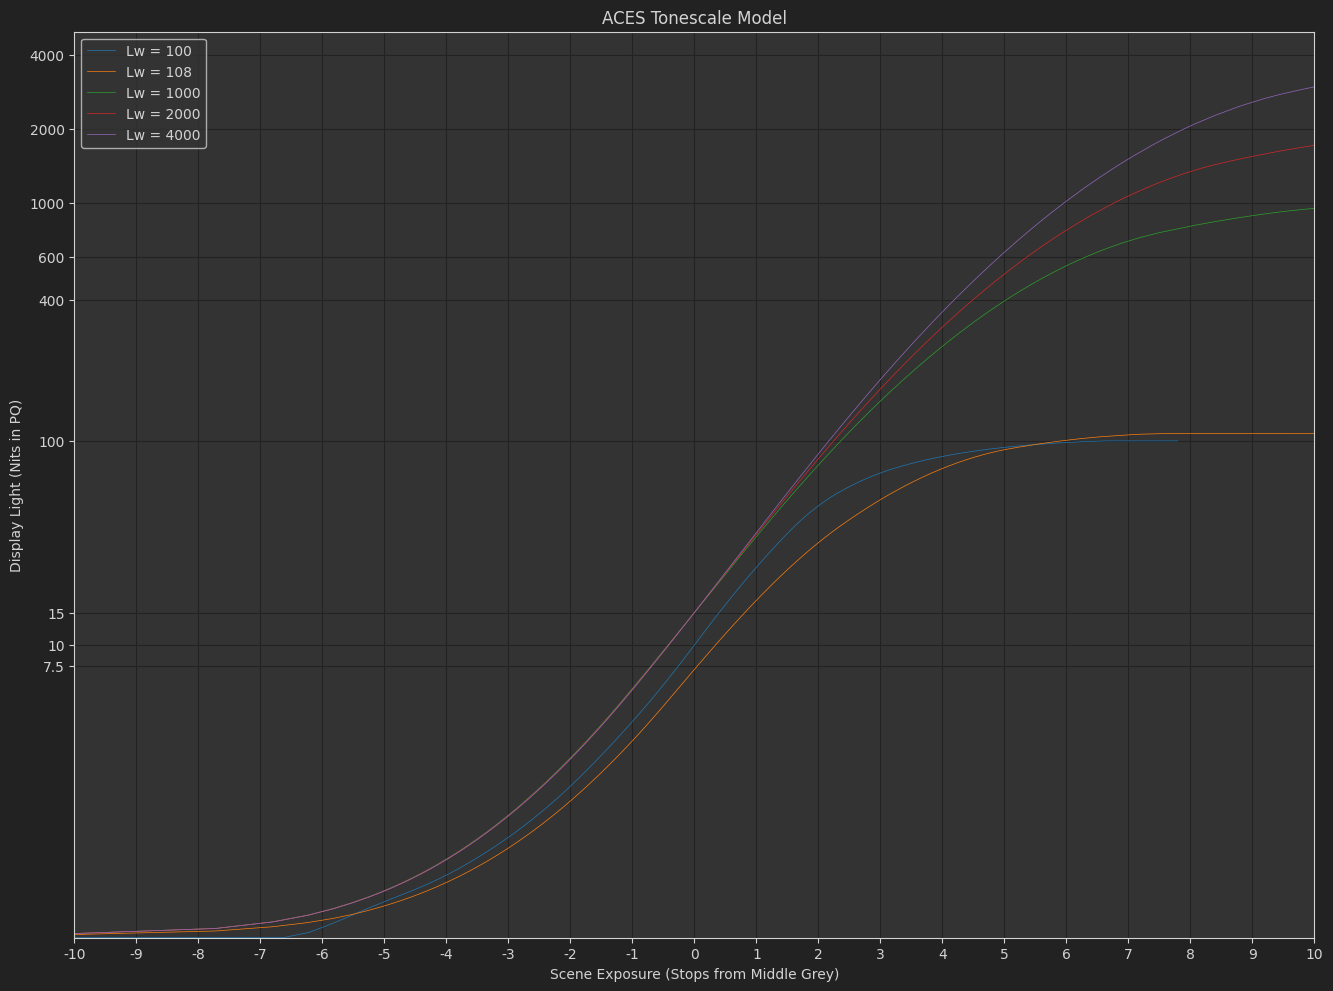
ACES Tonescale Model
Hope it helps and doesn’t distract too much from the important investigations into dish soaps.
8 Likes
I went back to @daniele’s original post and took another pass at understanding it.
One thing I noticed making the naka-rushton model above (and many times in the many garbage dead-end post I did before) is that with an intersection constraint at grey, it’s very easy to get undesireable behavior in the low end below the constraint. Slope changes or contrast changes, “wobbling” as you do tweaks of the curves for different peak luminance outputs.
The really cool thing about Daniele’s original formulation is that it is very stable down there. (Why am I am only fully appreciating this now nearly a year later  )
)
The reason it is stable is because in simple terms if you have
f\left(x\right)=s_{1}\frac{x}{x+s_{1}}
The bottom end is very stable as you adjust s_1
If you add a power function
f\left(x\right)=s_{1}\left(\frac{x}{x+s_{0}}\right)^{p}
where s_{0}=e_{0}s_{1}^{\frac{1}{p}}
The bottom end is still very stable, and we have control over scene-referred exposure e_0 and “contrast” p.
This can give very controllable and predicable results actually.
Here’s another desmos comparing this function with the naka-rushton one, with s_0 normalized in the same way. It’s pretty clear the different behavior of the exponent between the two curves.
5 Likes