Spectral Images Generation and Processing

Hi,

I’m creating a specific thread about Spectral Images Generation and Processing as a fork of some discussions started in the Notice of Meeting - ACES Gamut Mapping VWG - Meeting #2 - 2/20/2020 thread. I updated the Spectral Images Generation Computational Notebook of the aforementioned thread to mass-generate images. They are then being written to a directory on my Google Drive which is then served via Fast.io: https://academy-vwg-gm-spectral-spheres.imfast.io/ and presents the images with Jeri.

It is quite nifty as it makes it easy to compare things!

A few immediate TODOs:

  • Add Motion Pictures Camera sensitivities
  • Decide on which DSLR sensitivities
  • Decide on the lights spectrum
  • Perform IDTs computation as per the book

Cheers,

Thomas

1 Like

Here is the processing variant where an existing spectral image is used: Spectral Image Processing and also scaled to mass-generate data.

It is also served on Fast.io: https://academy-vwg-gm-hyper-spectral-images.imfast.io/

TODOs are pretty much the same than above, it might be worth sourcing real LED lights spectra, maybe @hbrendel and ARRI could provide Skypanel/Orbiter SPDs.

Cheers,

Thomas

1 Like

Hi,

Mitsuba 2 has been released a few days ago: https://github.com/mitsuba-renderer/mitsuba2

I will start looking at that tonight.

Cheers,

Thomas

1 Like

Hi,

First light with the Point Grey Grasshopper 50S5C sensitivities:

There is a related thread on Mitsuba 2 repo: https://github.com/mitsuba-renderer/mitsuba2/issues/15

Cheers,

Thomas

1 Like

Hi,

Some good progress over the weekend and I have mostly ported the Maya scene I made for Cinematic Color 2 to a pure Mitsuba 2 implementation:

Repository is here: https://github.com/colour-science/colour-mitsuba and I will add LED lights this week.

Cheers,

Thomas

2 Likes

Hi,

I have almost all the pieces required now: https://academy-vwg-gm-mitsuba-spectral-images.imfast.io/


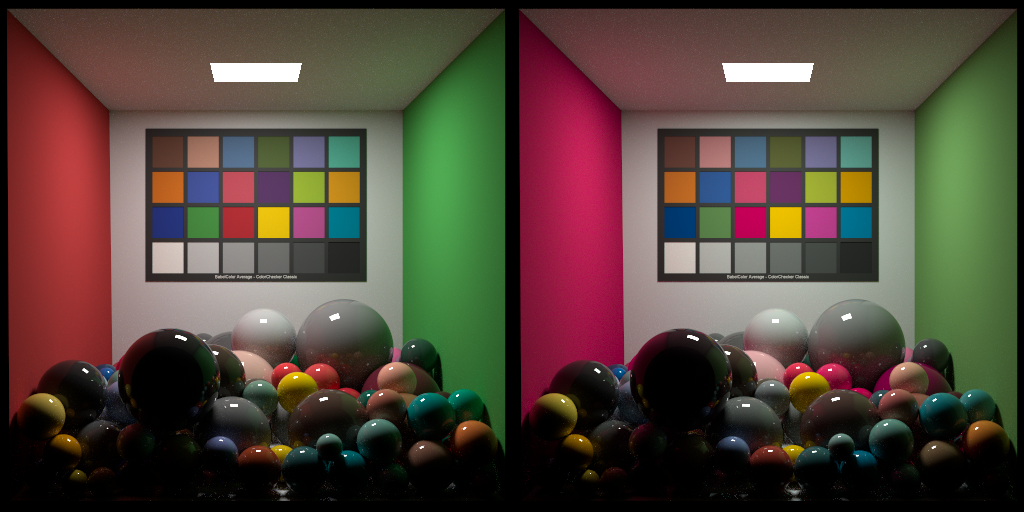
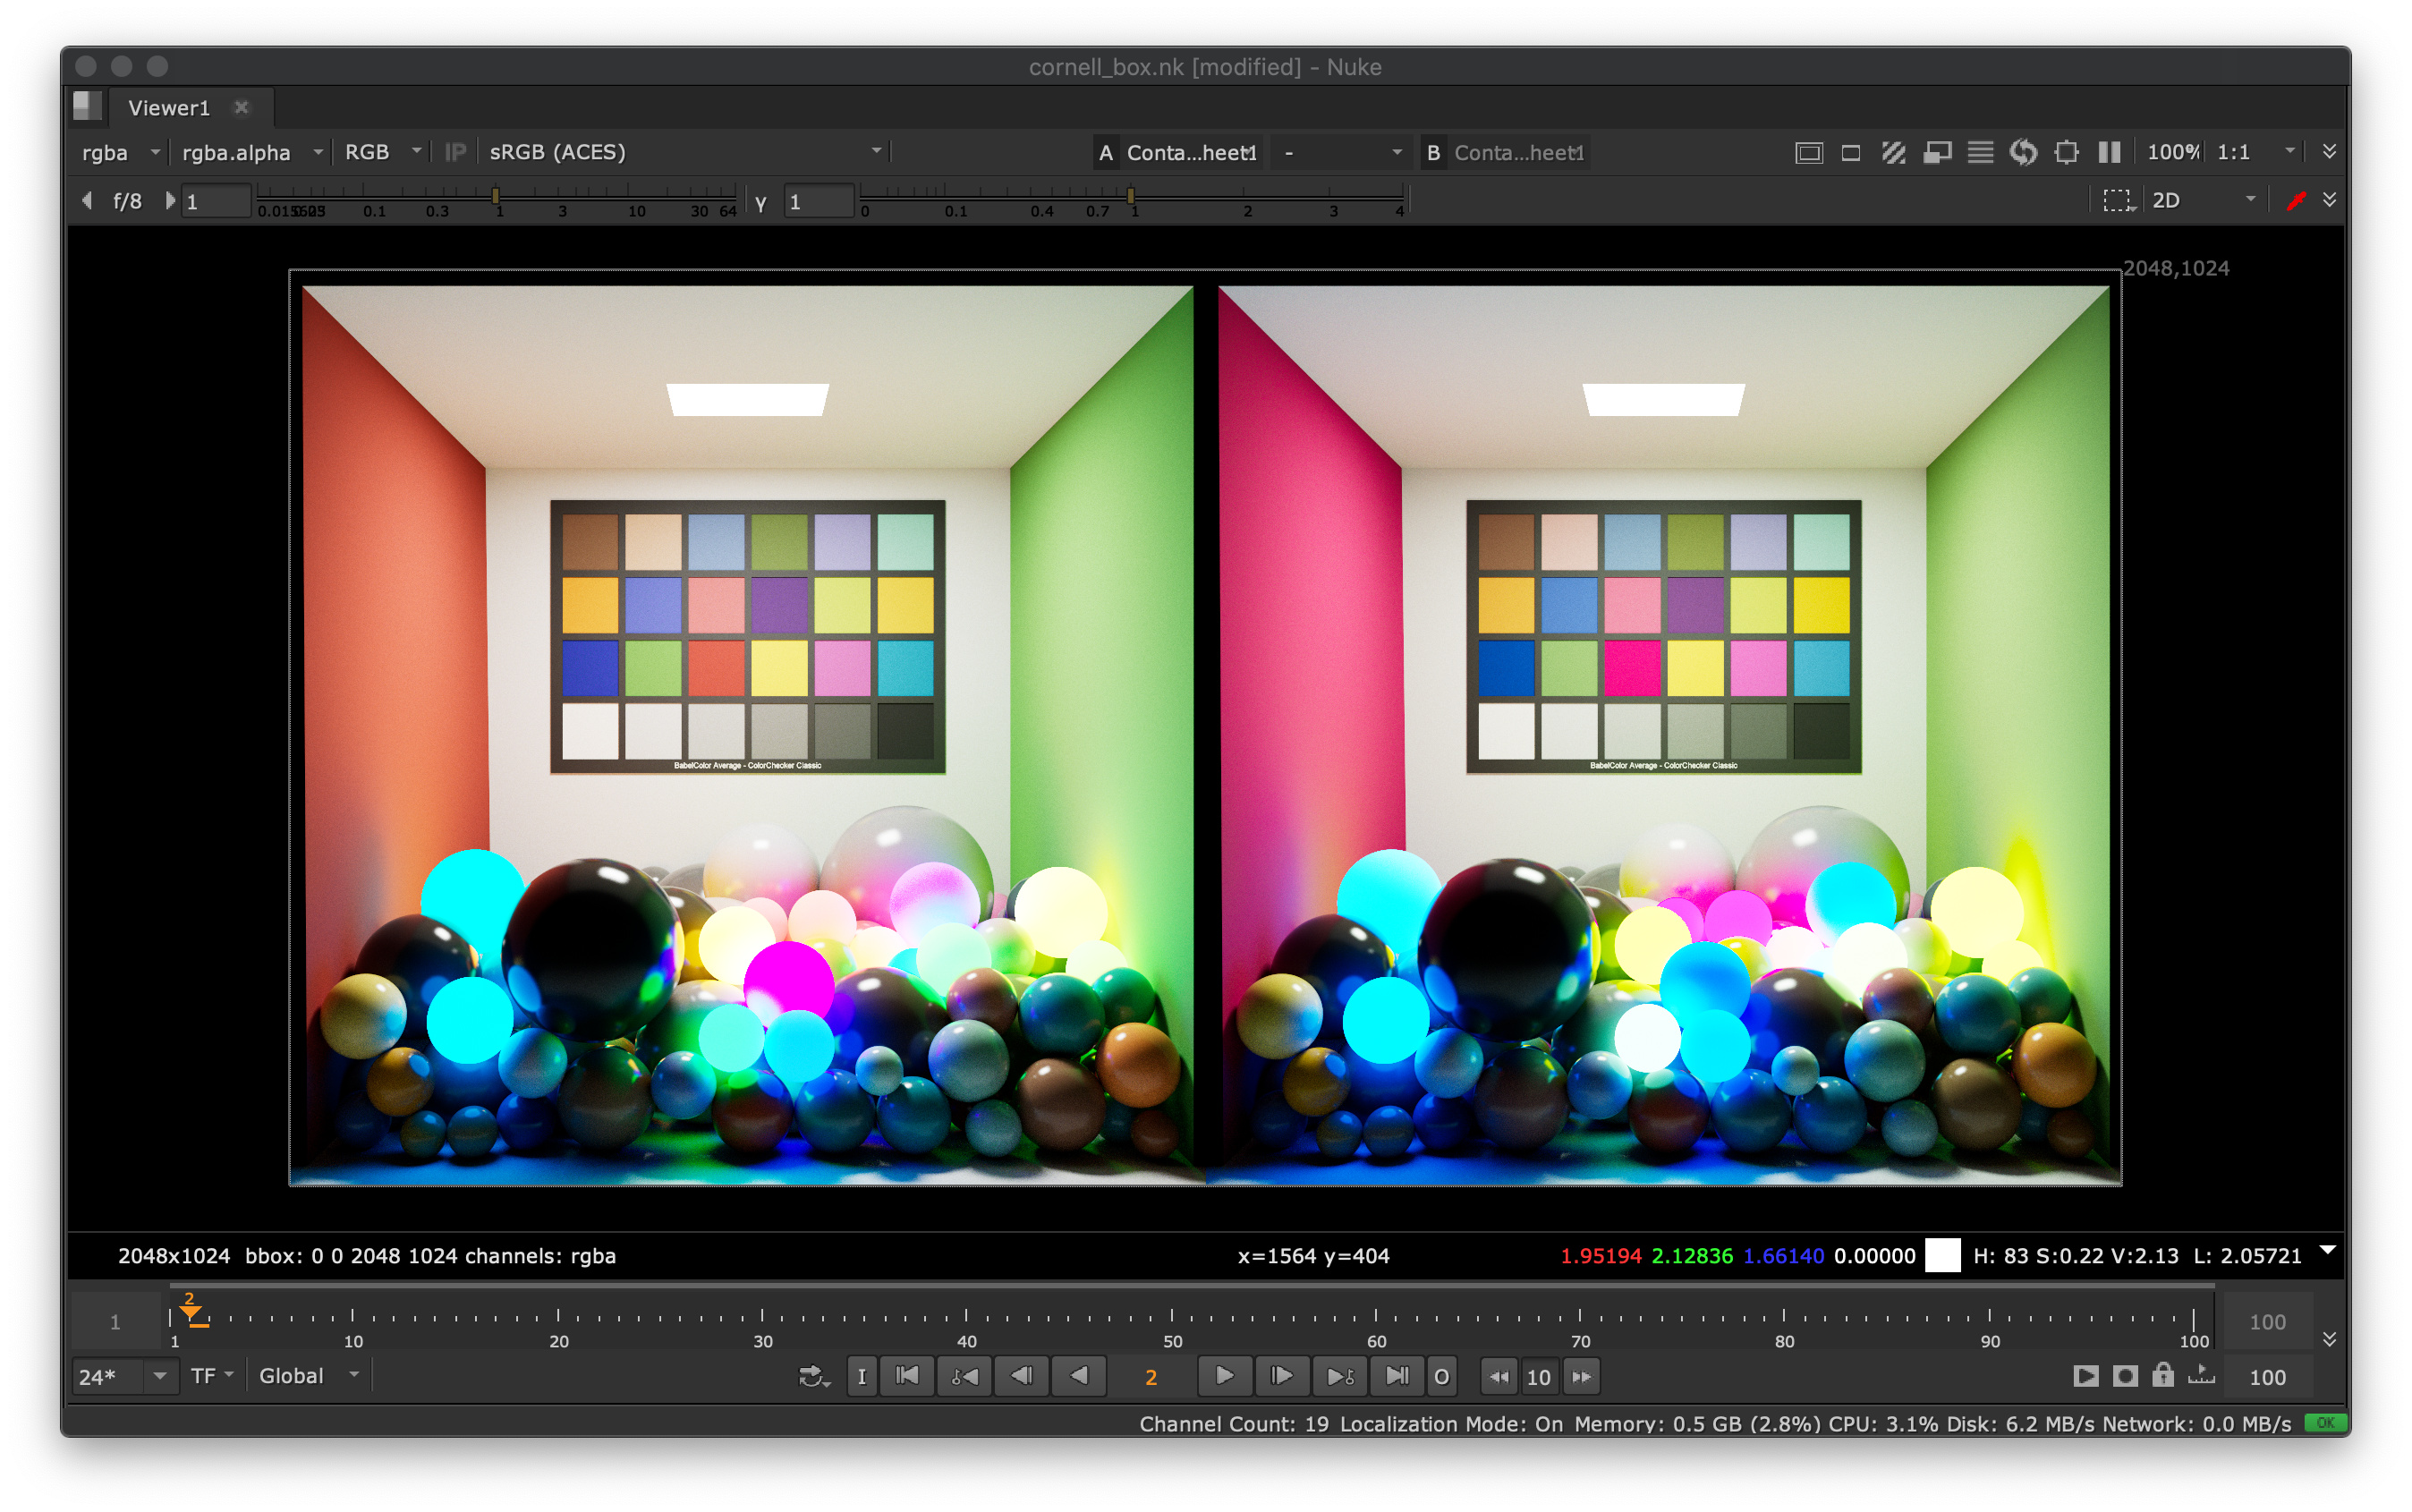
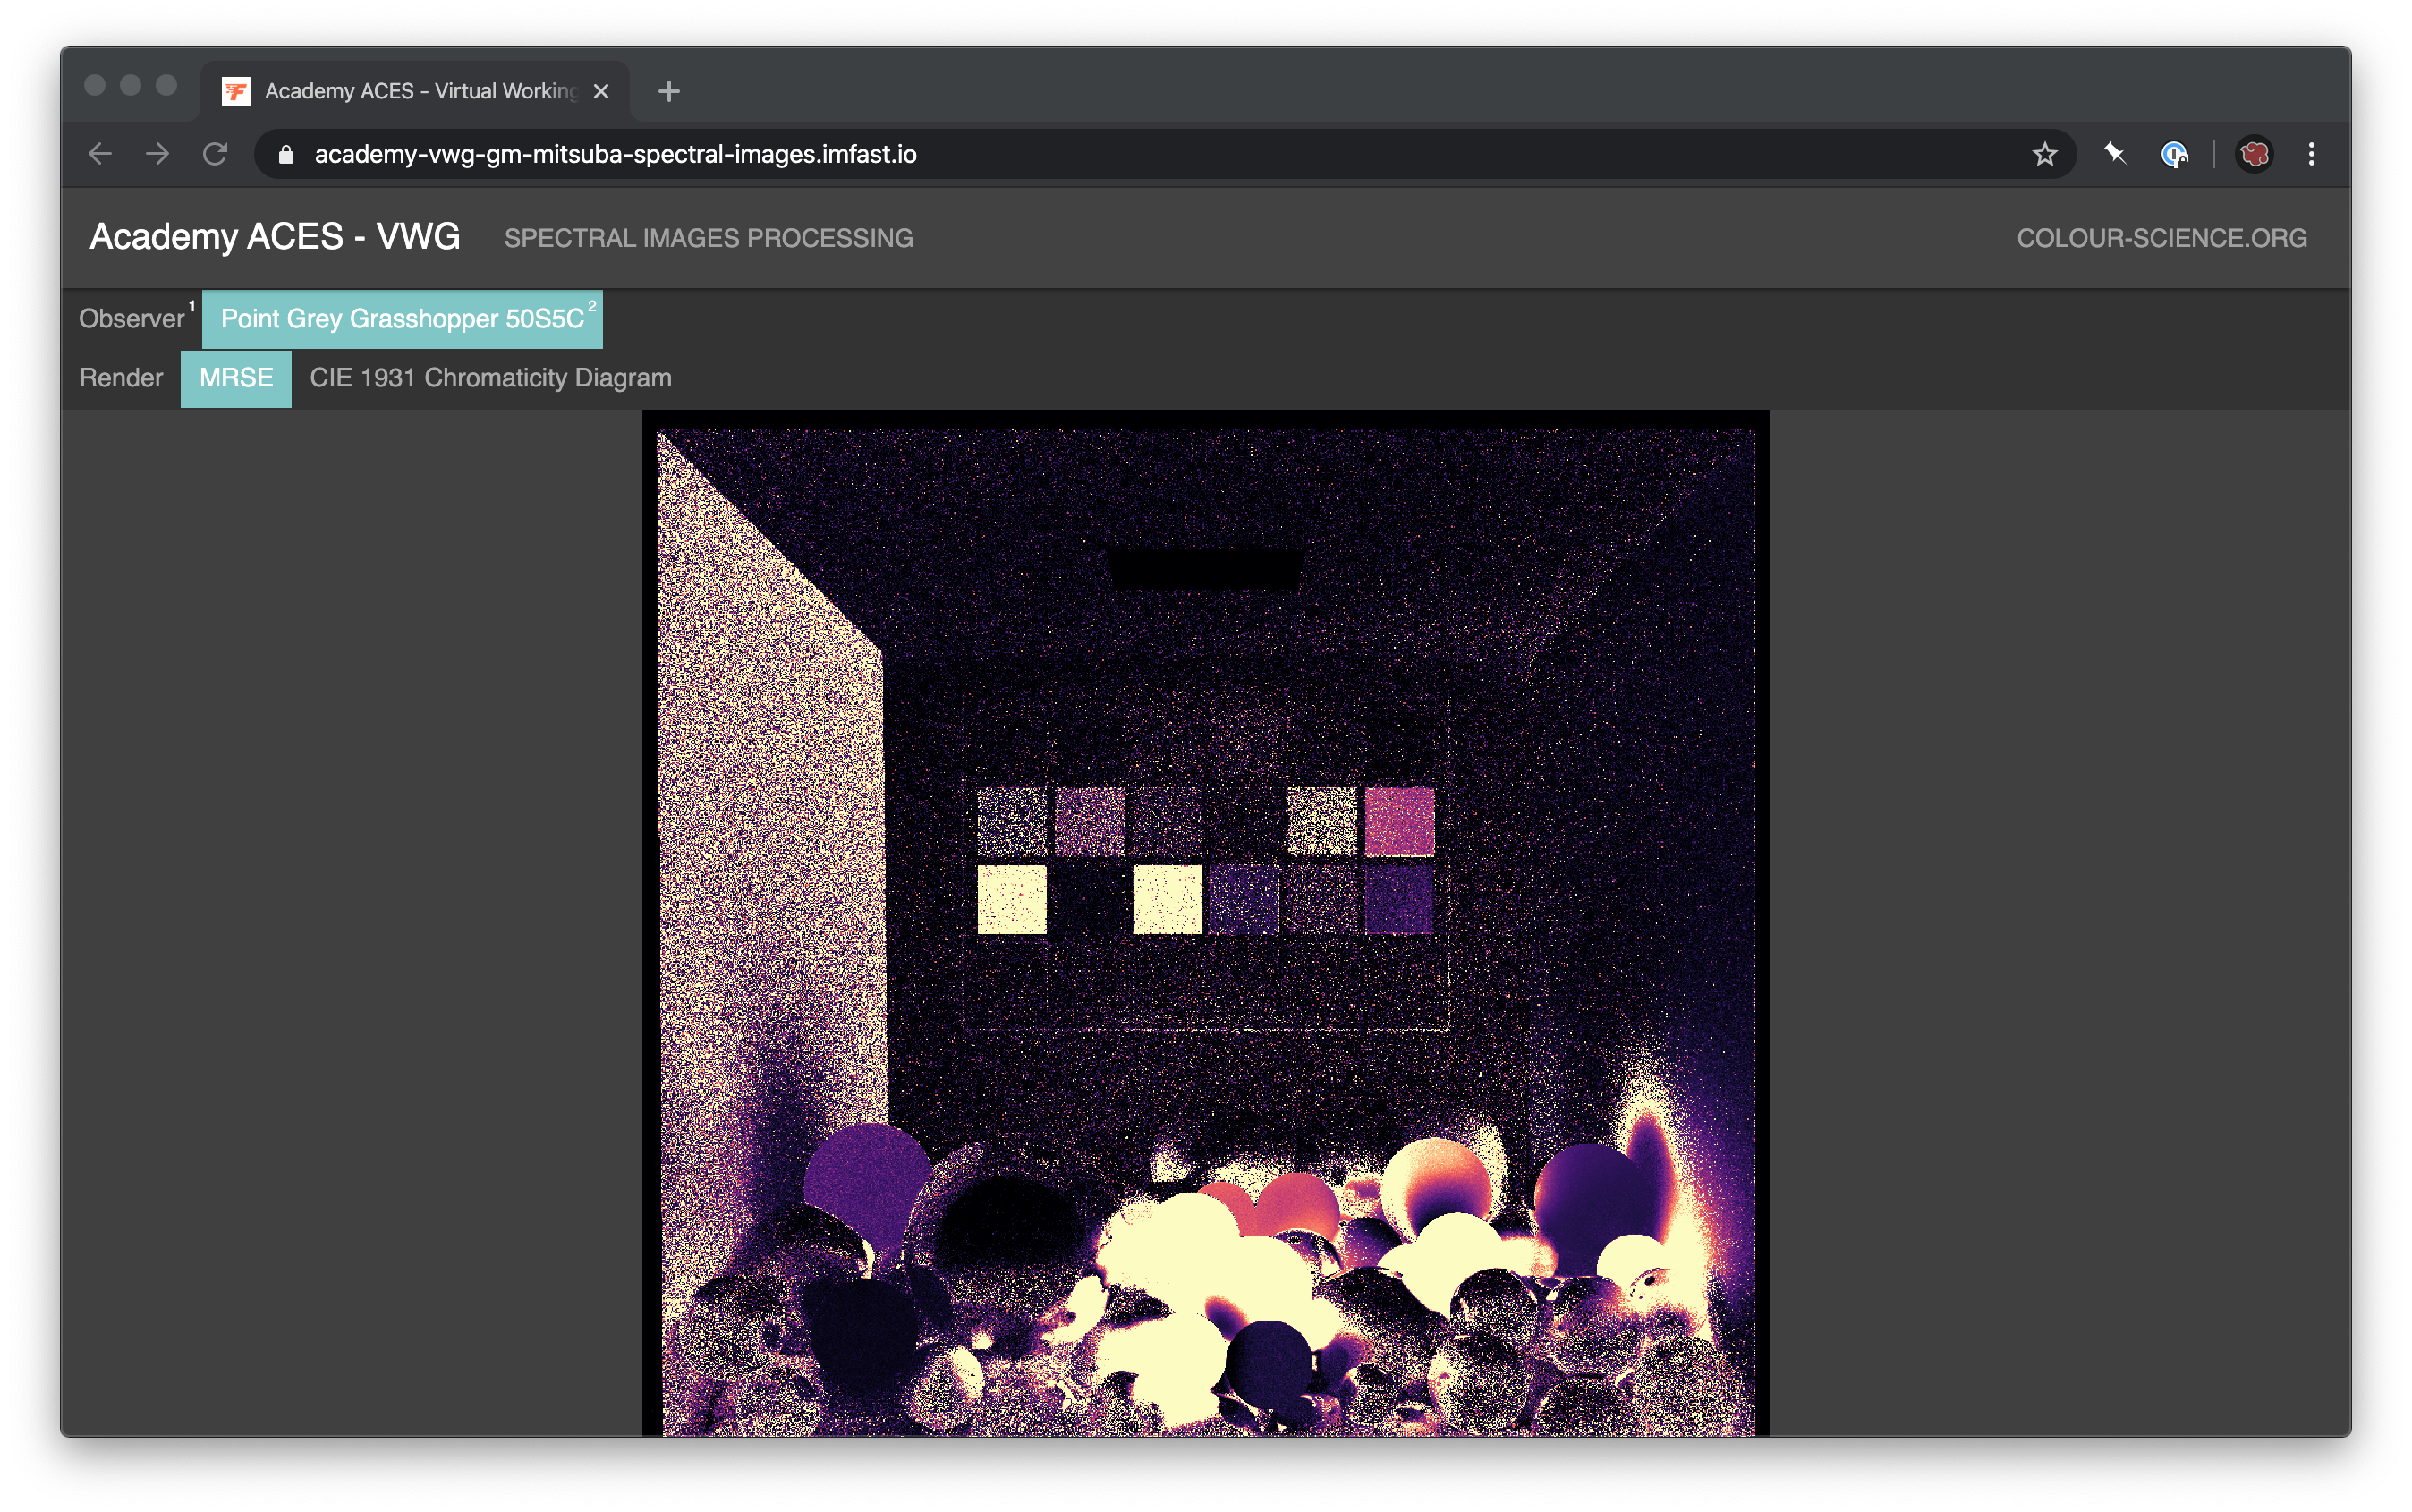
It should be straightforward to generate other images and the advantage with those synthetic renders is that now we are avoiding the clumping that was happening with the relight spectral images.

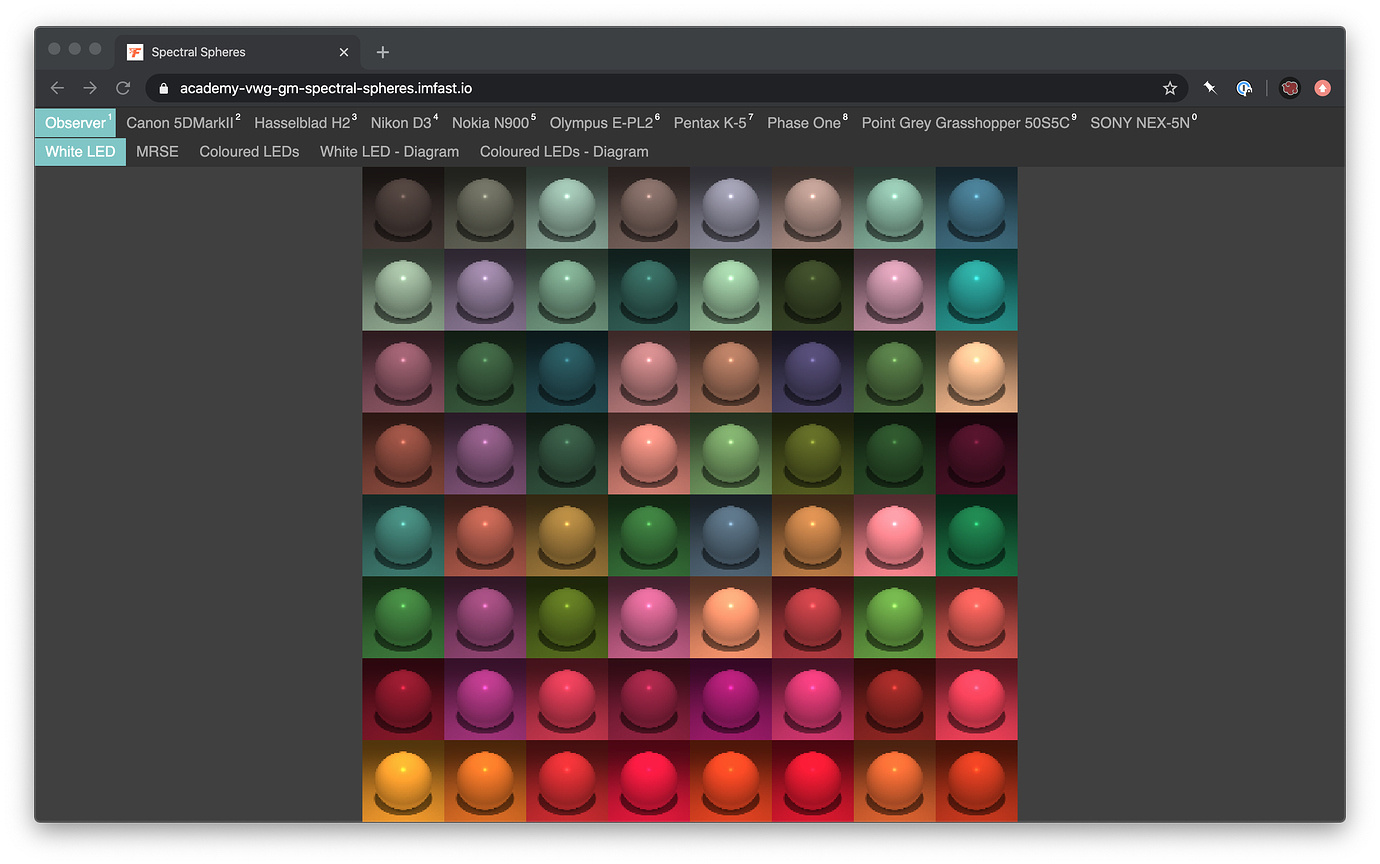
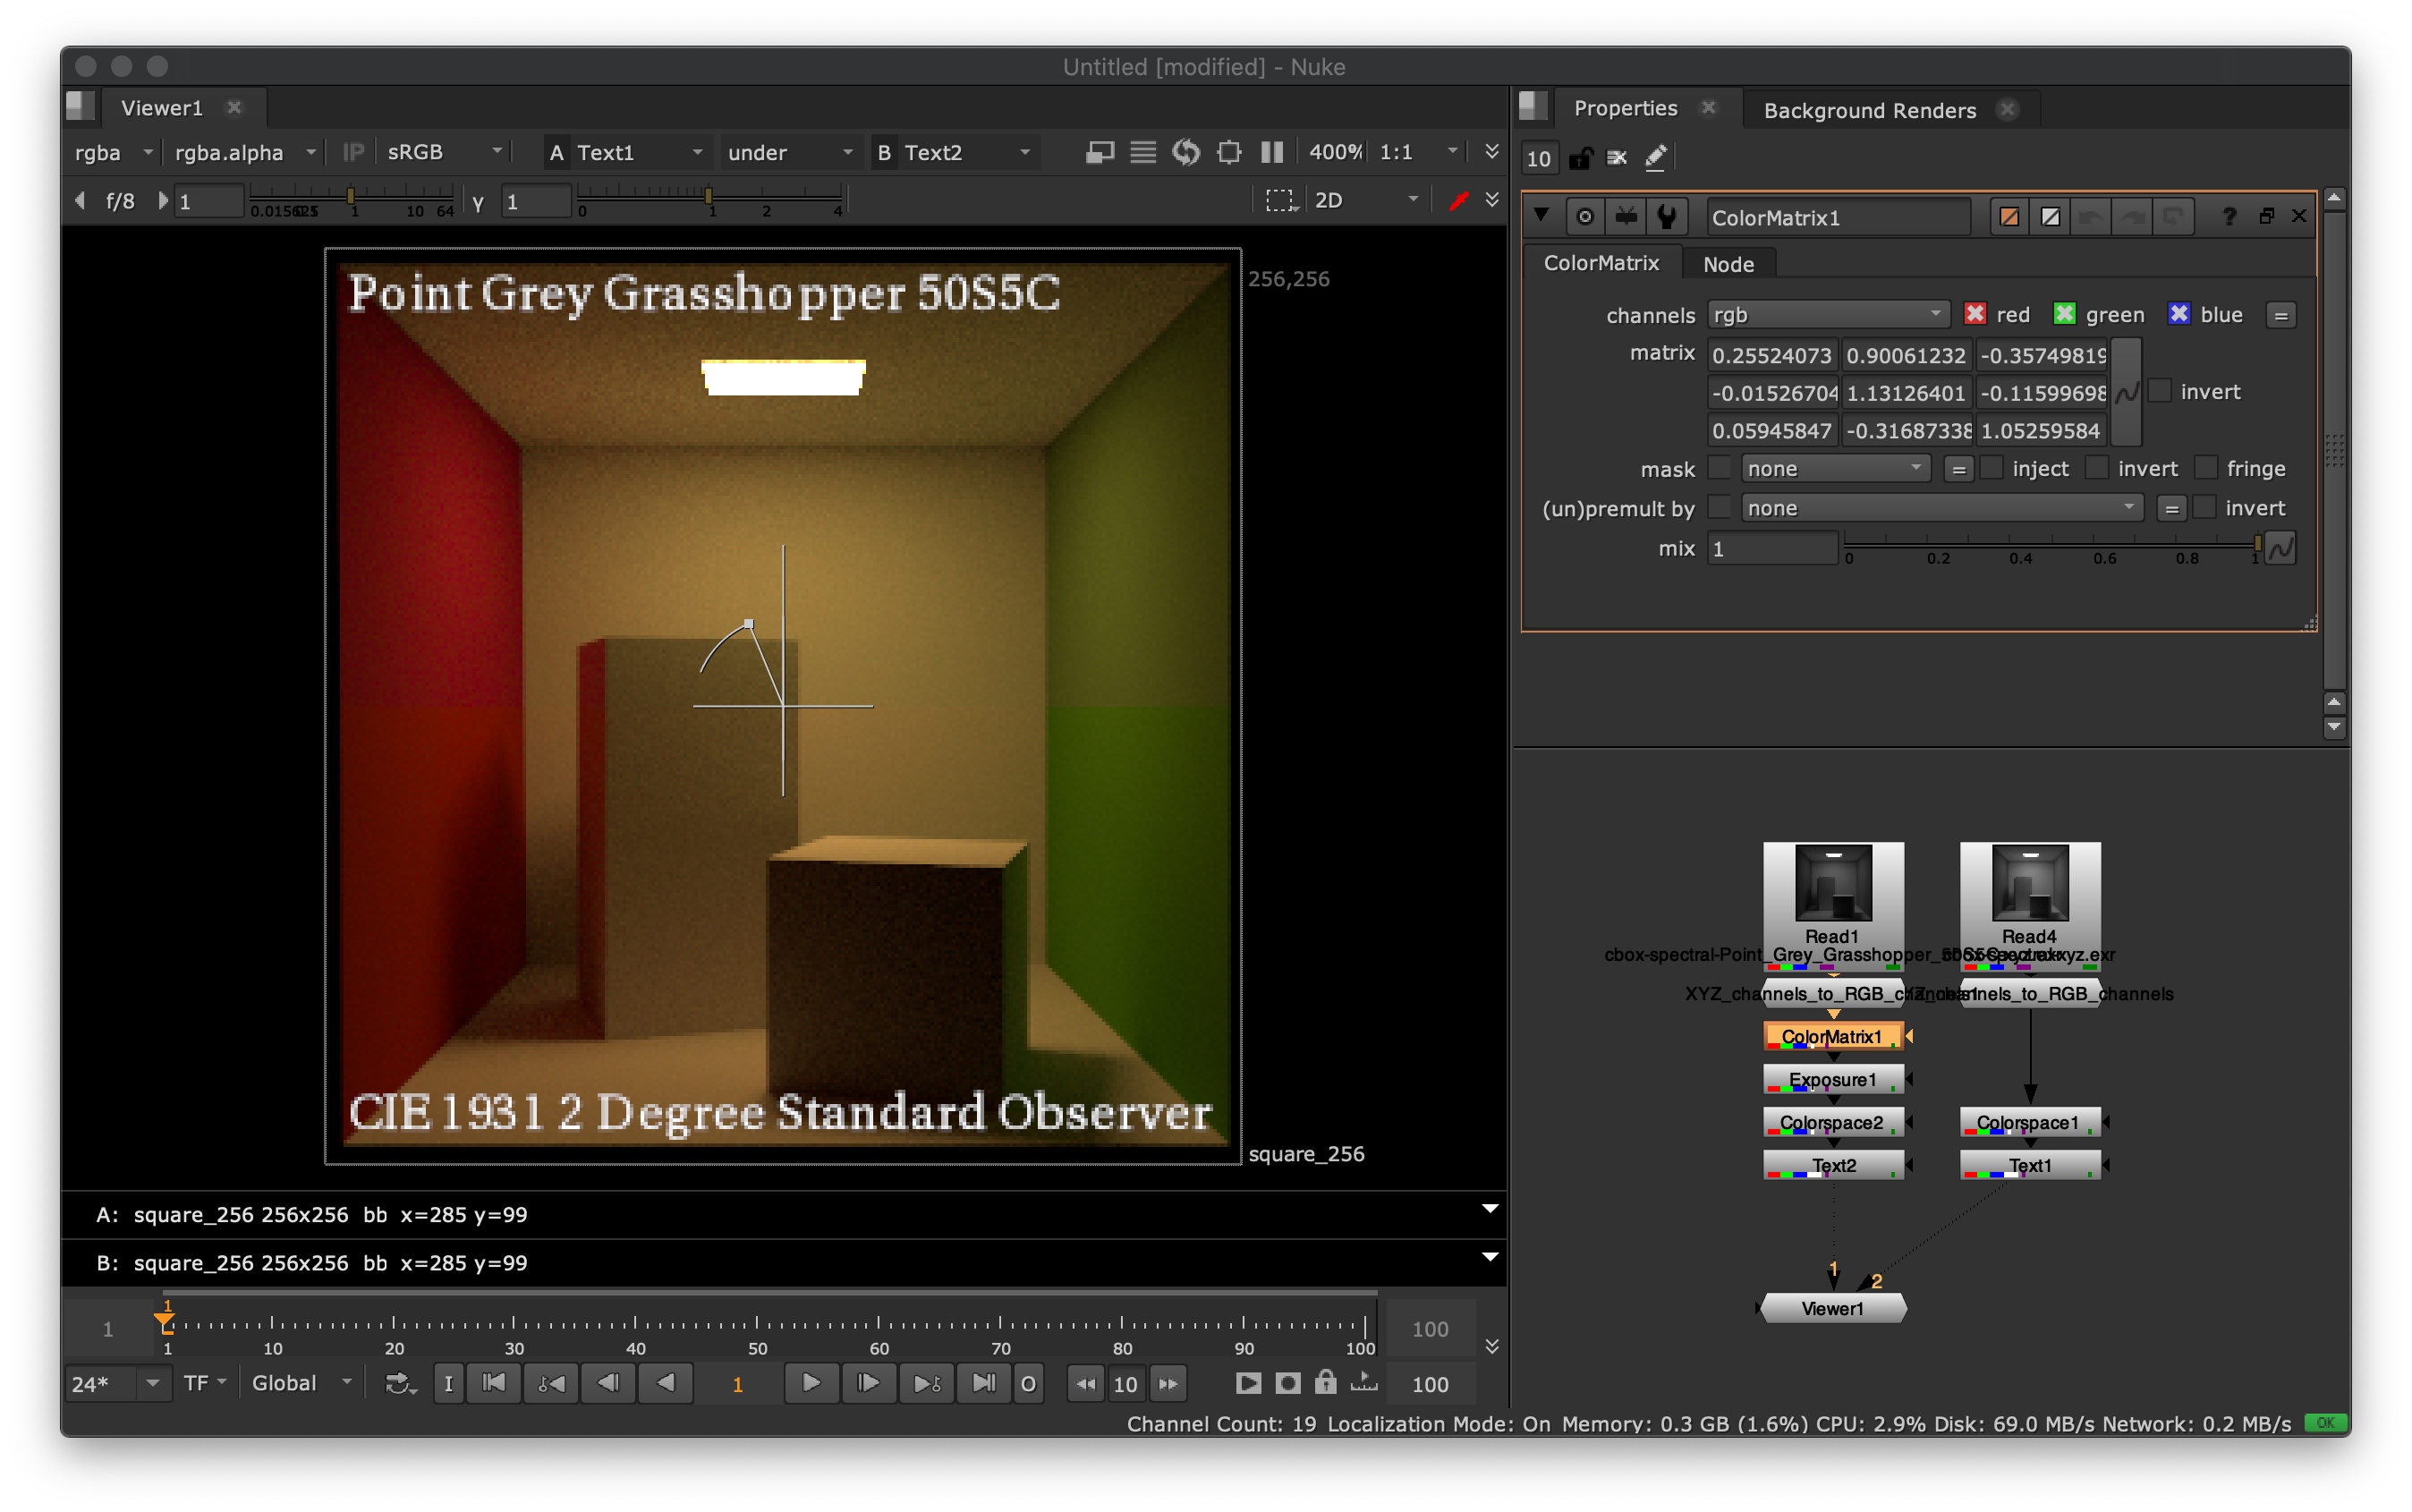
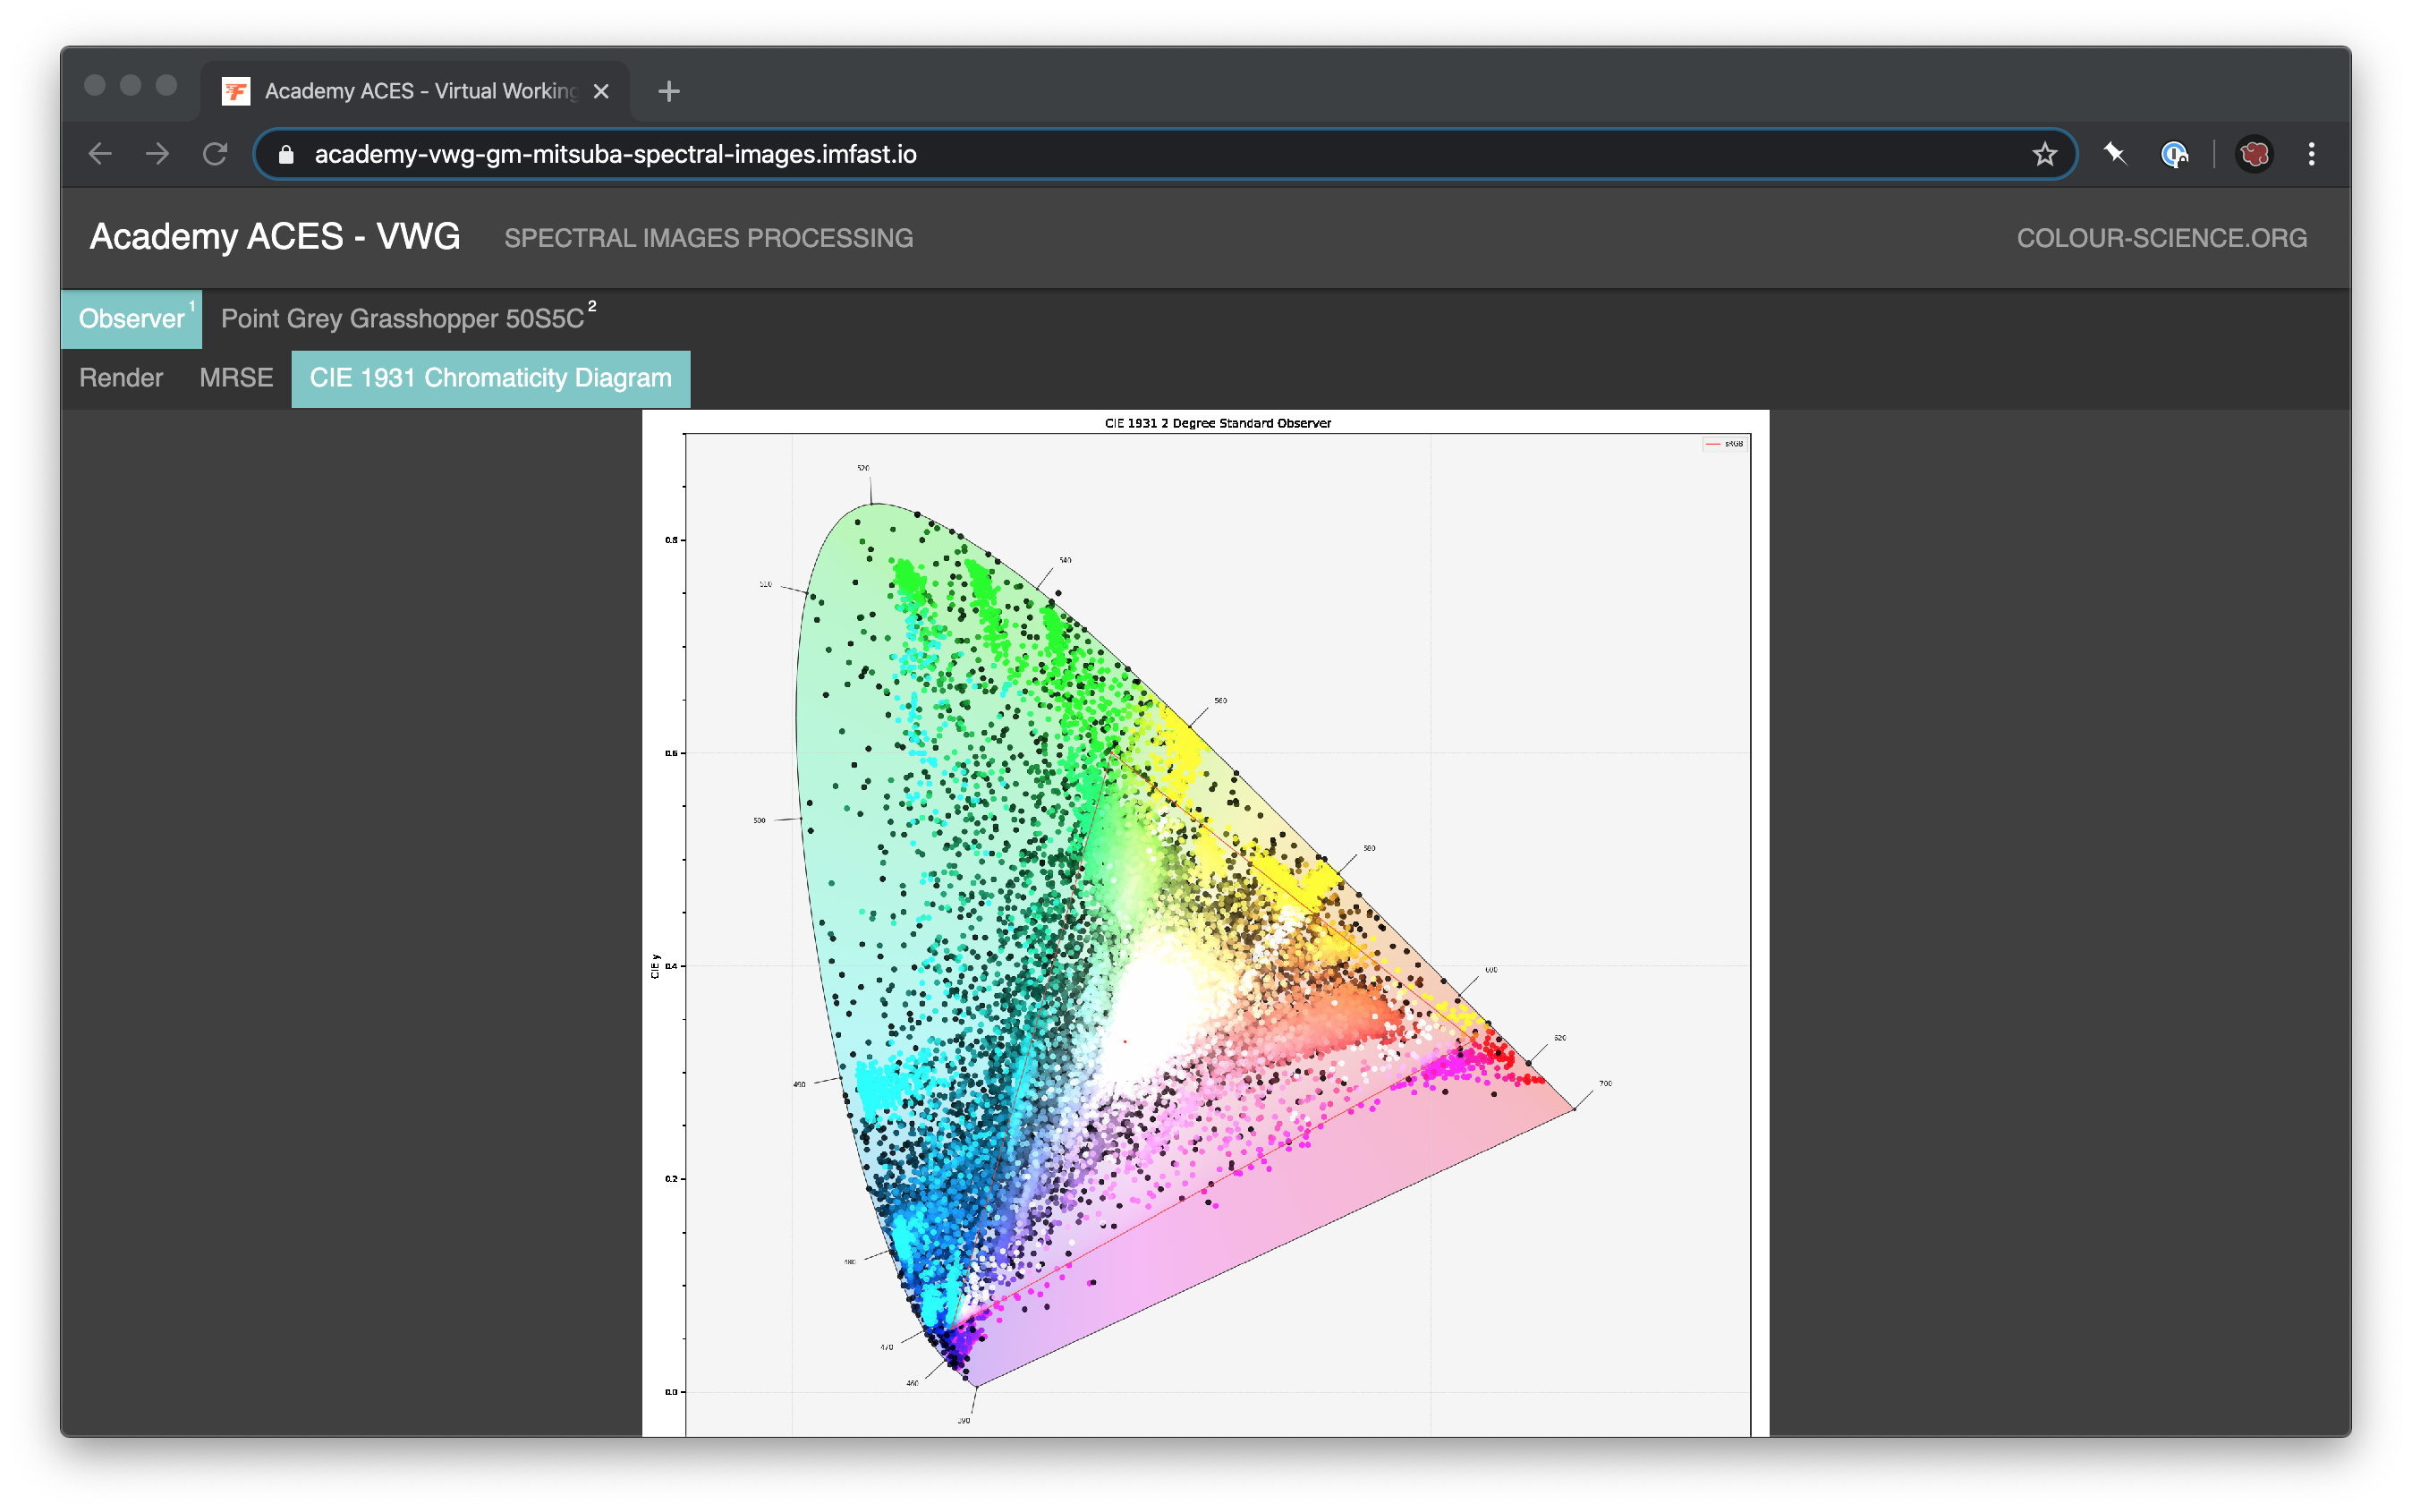
Note that the Nuke screengrab is rendered using the ACES RRT while on the website we don’t have that, you can press ? to get a list of shortcuts.

Cheers,

Thomas

1 Like

Hi,

In continuation of the previous post, here are two notebooks for Mitsuba 2:

Next step is to implement IDT generation closer to what Rawtoaces does, this would also be useful for @SeanCooper’s Notebook - Sketches of Hue.

I’m currently computing the IDT using the rendering light source which is an optimal scenario and could be considered as cheating to a degree by purists.

Cheers,

Thomas

2 Likes

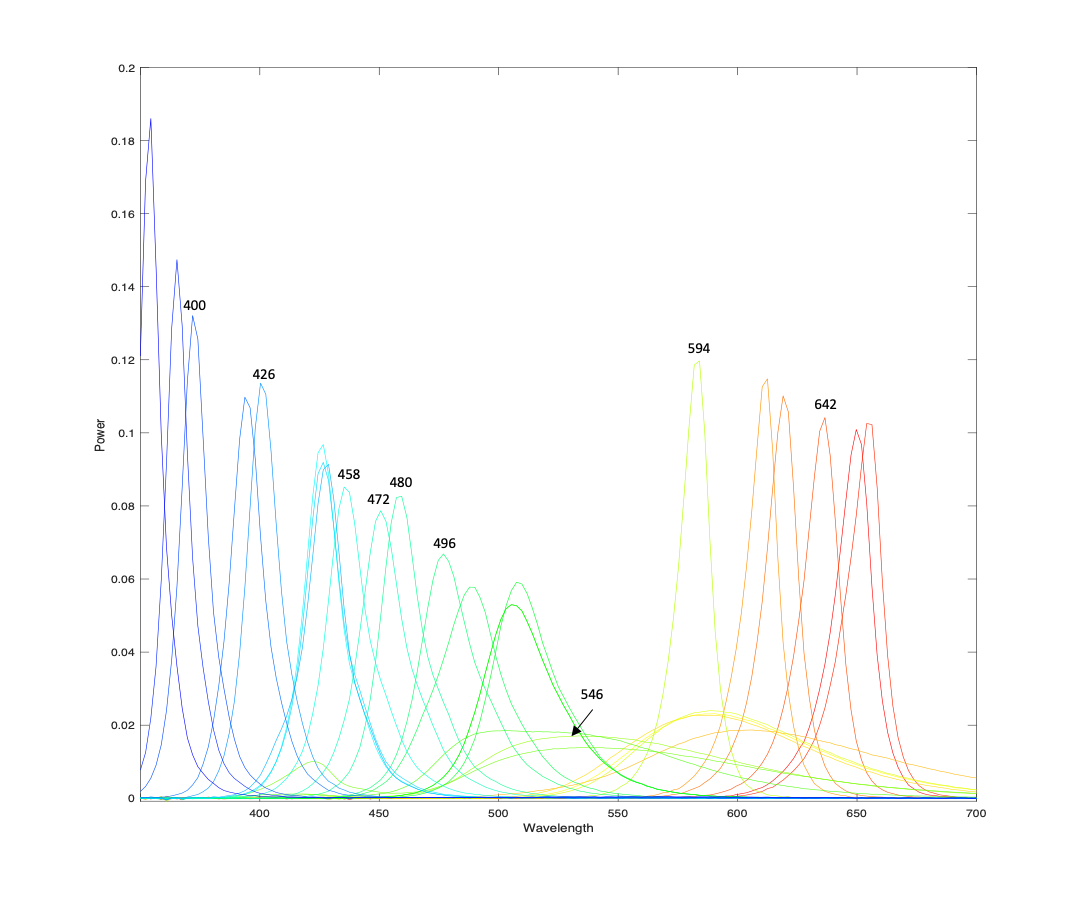
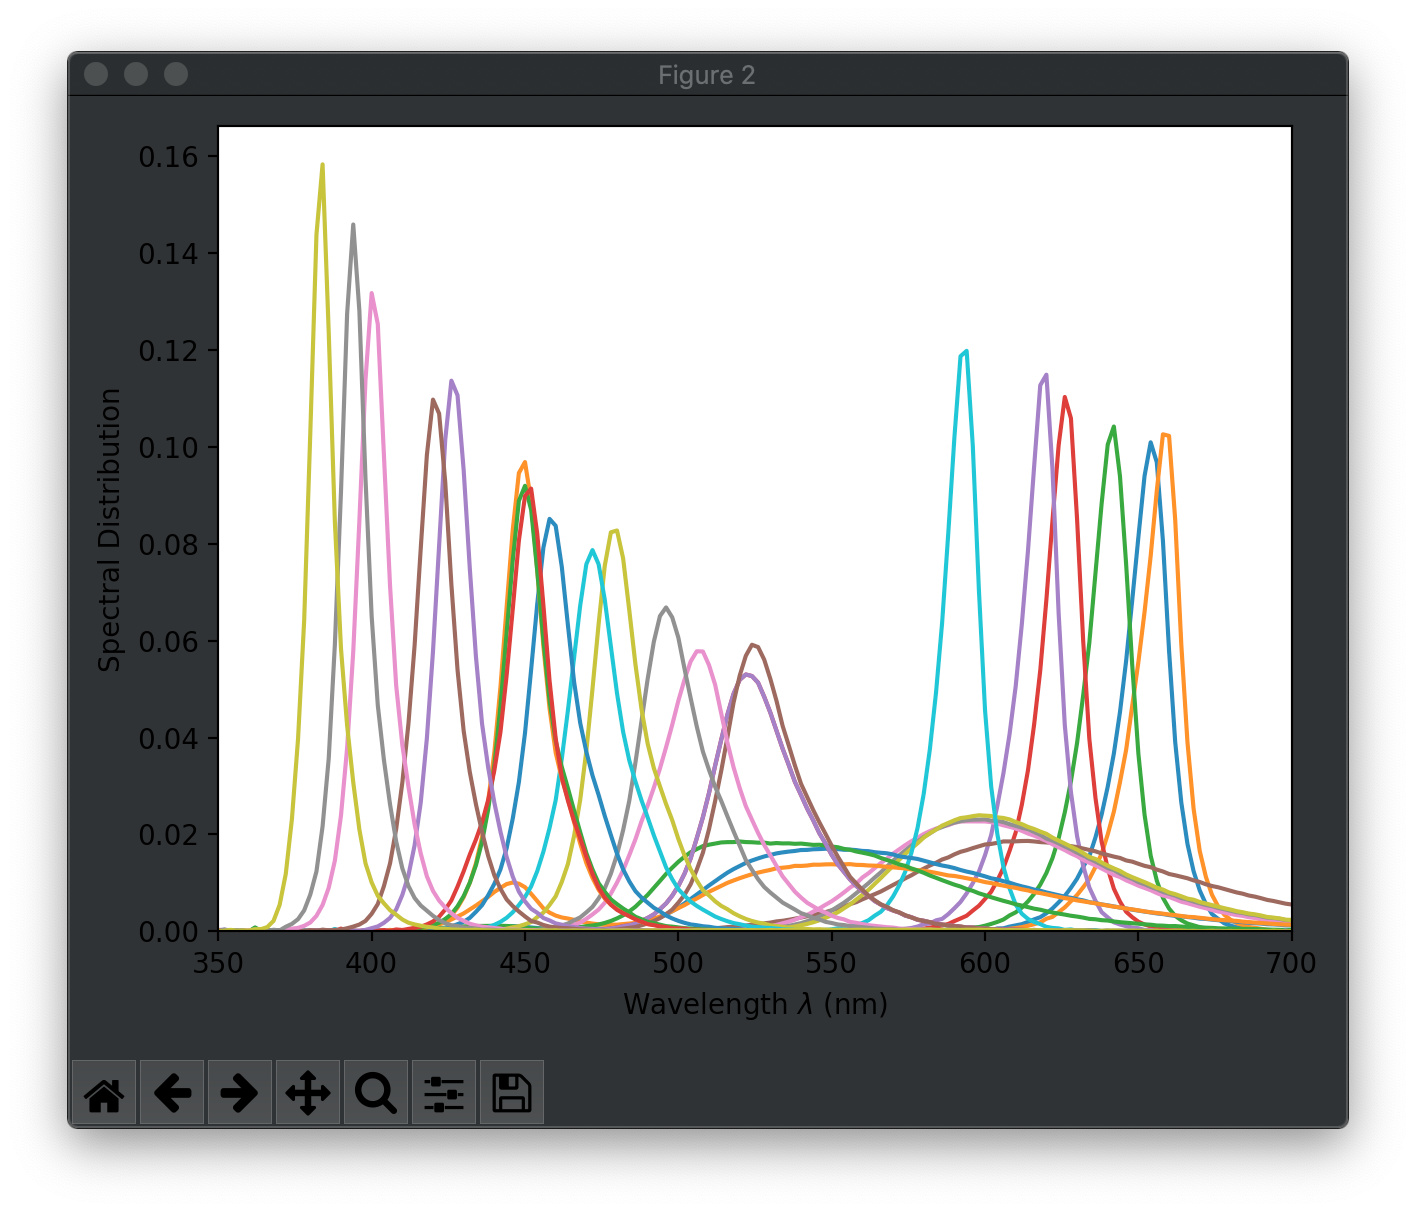
I provide measured spectra of 29 commercially available LEDs spanning the range from 380 to 660 nm peak wavelength.
The file contains one SPD per line. Each spectrum is given in 176 samples from 350 to 700 nm normalised to a unity power integral.

https://haraldbrendel.com/files/led_spd_350_700.csv

Below is a graph of the LED spectral power distribution.

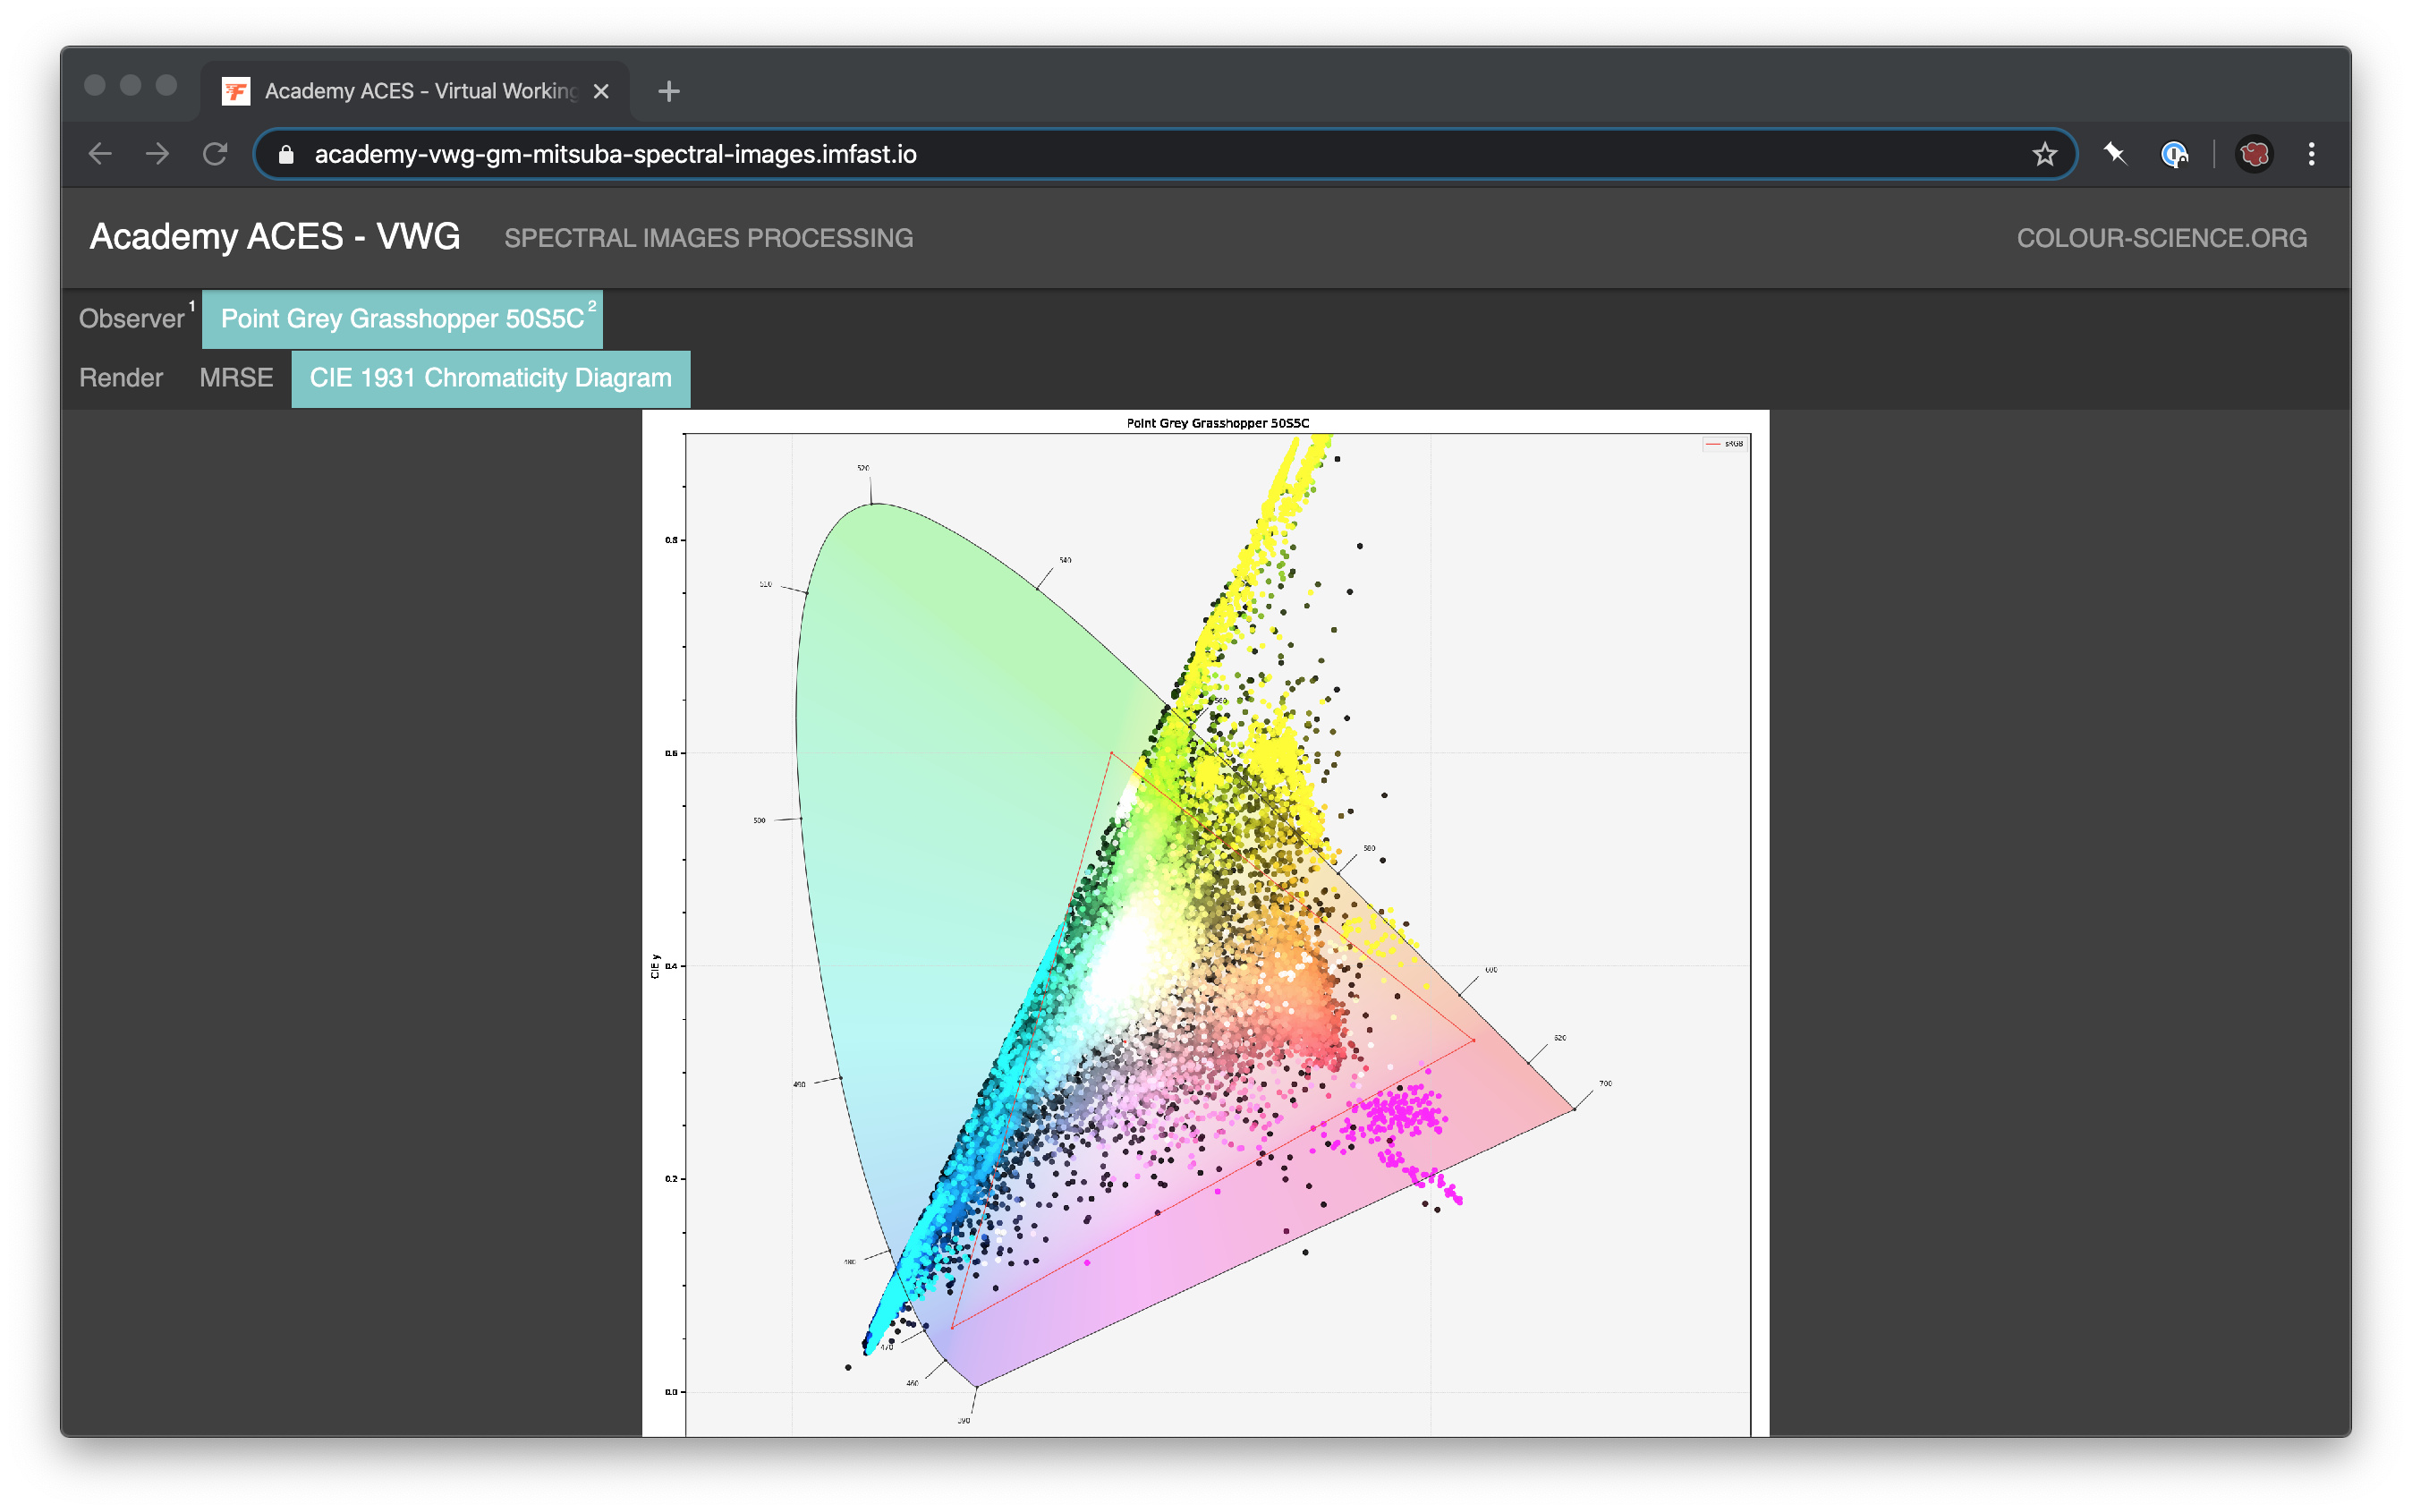
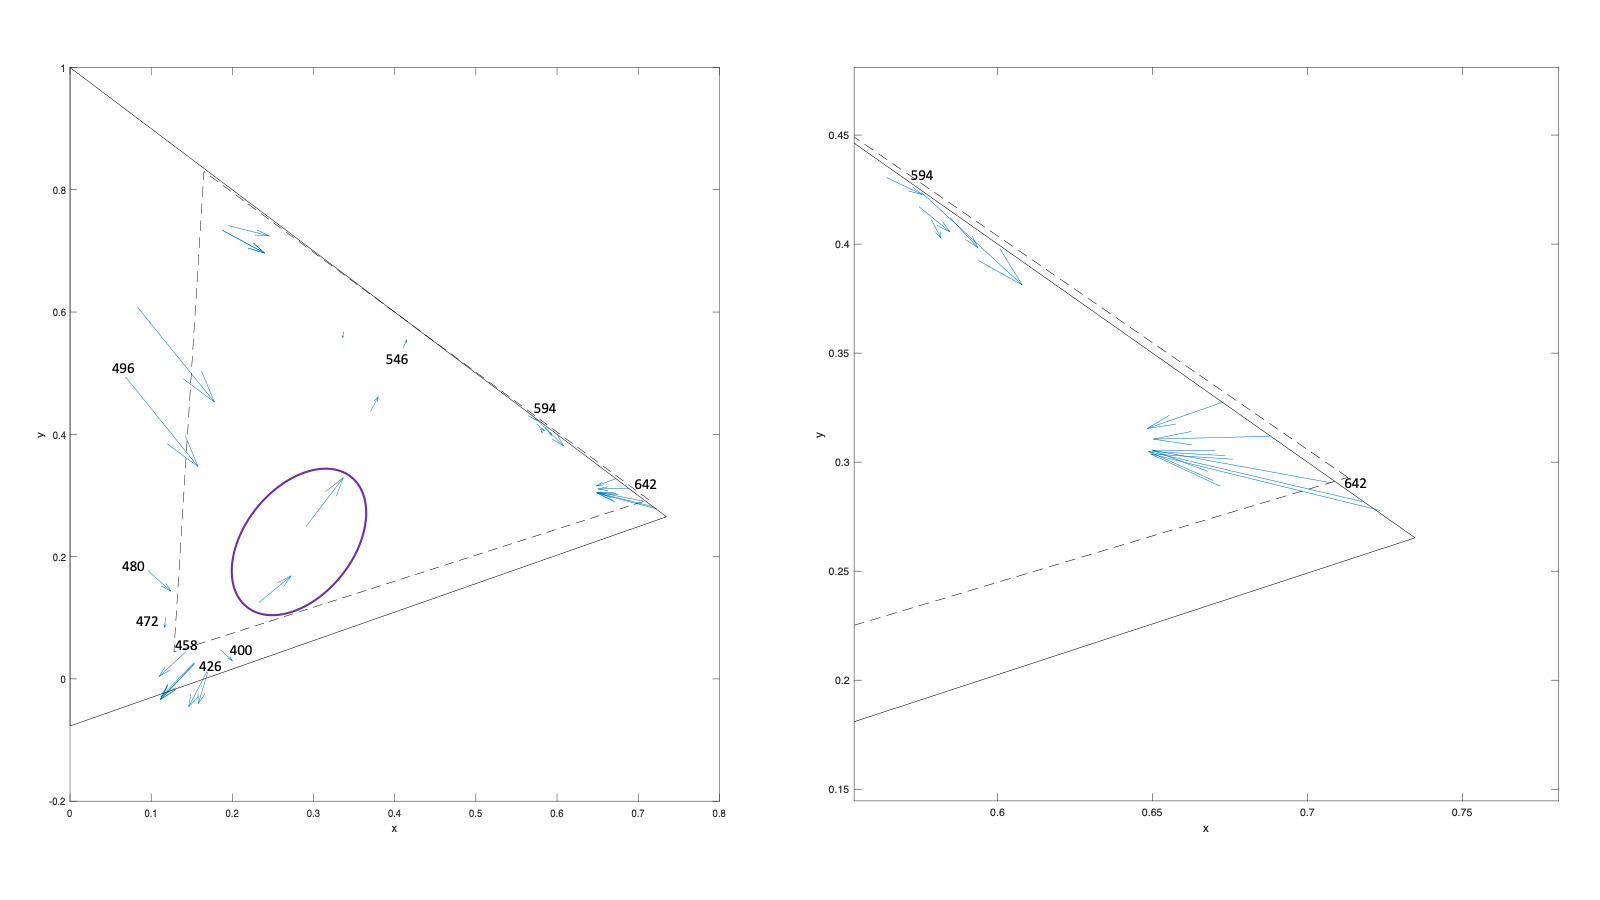
The following figure shows the color of each LED in the xy diagram (begin of arrow) and the reproduction in the ALEXA camera system balanced to D65 (end of arrow). The solid line is AP0 and the dashed line is AP1.

This illustrates the rather complex situation. The color reproduction error of the camera system shifts some colors outside (examples are LEDs with peak wavelength between 400 and 458 nm). I think that is what many users of ACES with ALEXA footage have experienced. Other colors are shifted inside (LEDs with peak wavelength in the range from 480 to 500 and longer wavelengths around 640 nm). The color reproduction error “replaces” a gamut mapping from AP0 to AP1!
I would not put much confidence in the reproduction of the LED with peak wavelengths below 400 nm (enclosed by purple ellipse) because the UV blocking filter attenuates these wavelengths. Thus the chromaticities are the result of dividing small small numbers by small numbers.
I would like to emphasise that it’s not possible to clearly define regions in the chromaticity diagram where the color reproduction error of the camera is small or large. Compare the errors (length of arrows) for the LEDs with peak wavelengths of 472 and 480 nm with others in between. The result of the color reproduction is determined in the higher-dimensional spectral space of which we see a projection only.

6 Likes

Sorry for not getting back to you @hbrendel earlier, but this is obviously super appreciated!

1 Like

I finally found the time to add your LED dataset to colour-datasets:

import colour
import colour_datasets
colour.plotting.plot_multi_sds(colour_datasets.load(4051012).values(), legend=False)

The Zenodo record is here: https://zenodo.org/record/4051012

Thank you!

2 Likes

With Fast.io going down end of the year, I have re-hosted everything on Netlify:

Cheers,

Thomas